
BADVIN vehicle history report for
2018 TOYOTA RAV4VIN: 2T3RFREVXJW784604
Get FULL ACCESS to the vehicle history report and see all blurred info.
⭐ Read 205+ reviews from our customers who used BADVIN to avoid buying junk vehicles.
Historical Records
events
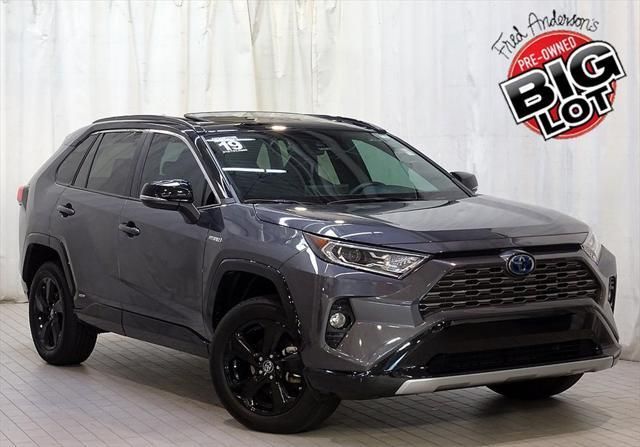
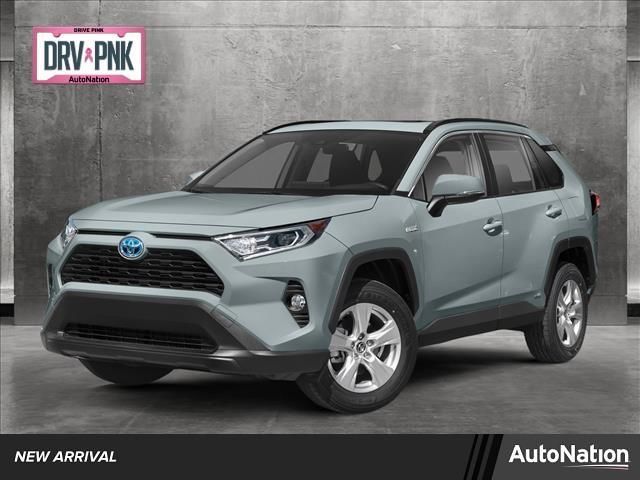
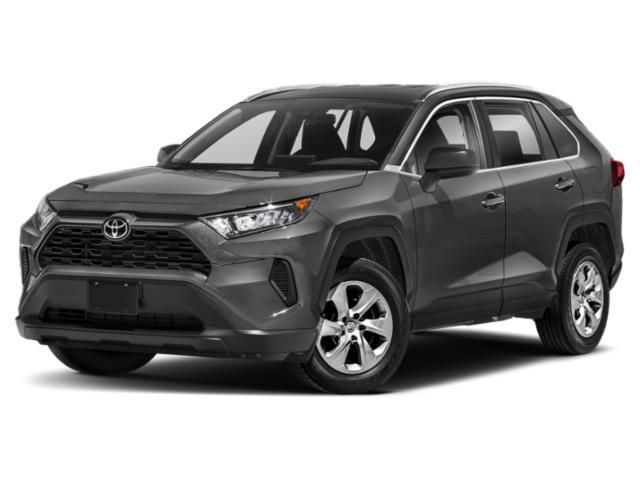
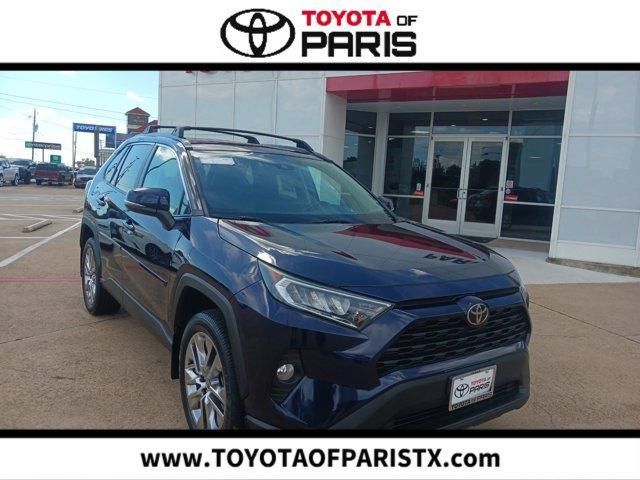
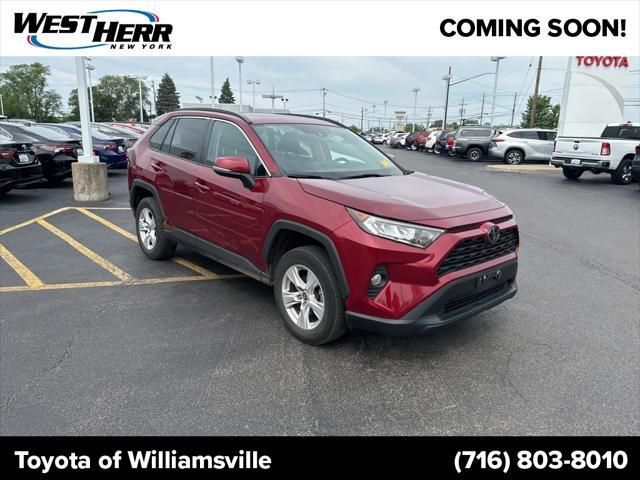
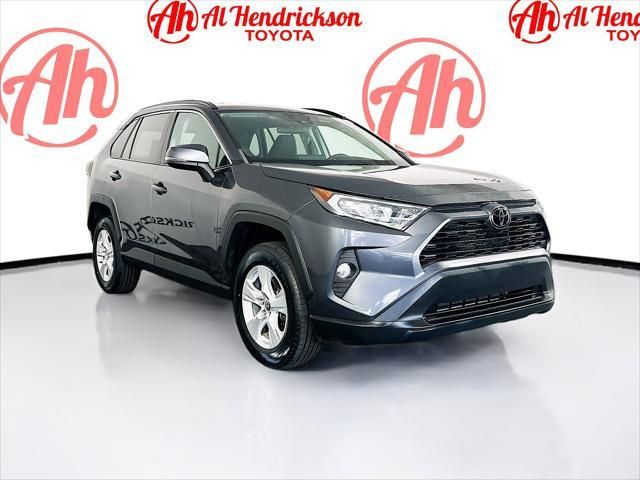
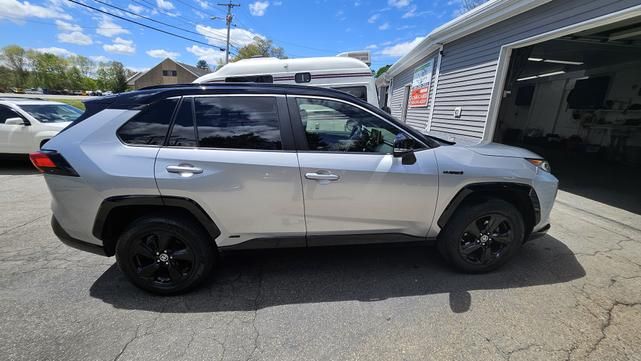
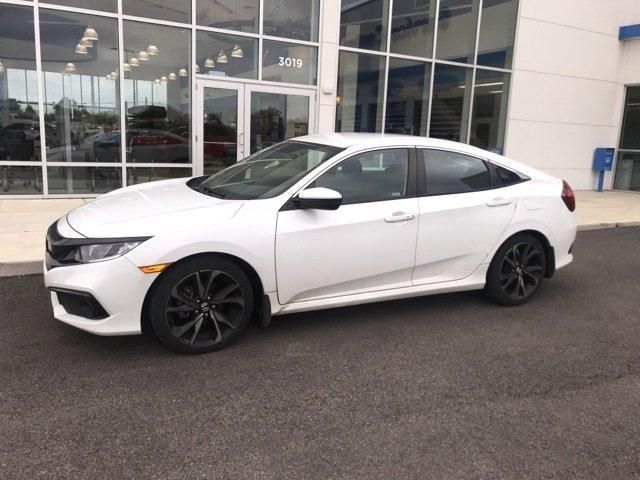
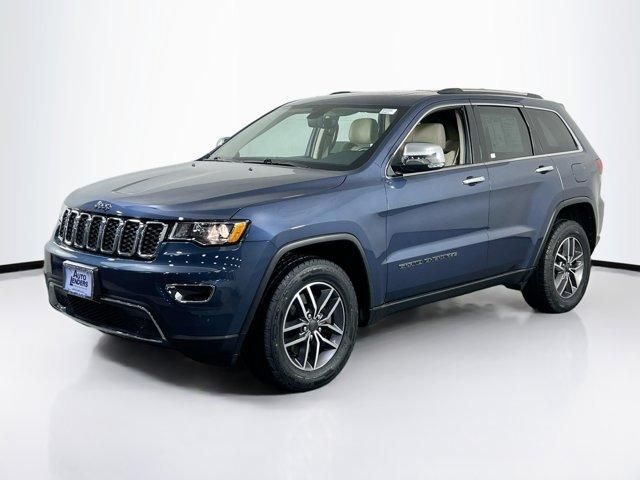
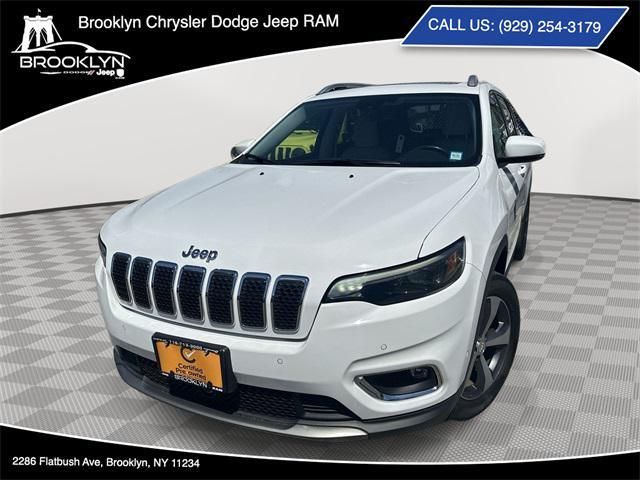
Photos
12 images
Sales History
1 records
Sale Prices
1 records
Market report
Price analytics
Historical Records
Historical records may include service and maintenance records, title status (clean, junk, salvage), insurance records, number of owners, registration events and states, and other information.
You can find more information about historical records in BADVIN reports and see more examples here.
Available historical records for VIN 2T3RFREVXJW784604
Latest reported mileage: 113 mi
Below you can see some examples of what these records could look like.
2022-09-28
2 years ago
82,158 mi
REBUILT TITLE ISSUED
2022-01-14
2 years ago
12,172 mi
Vehicle serviced
40,000 mile service performed
40,000 mile service performed
2021-07-21
3 years ago
28,957 mi
Passed emissions inspection
| Year | 2018 |
| ODO | 2472 mi |
| Seller | Hidden text (Hidden text) |
| Location | Owego, NY, 13827 |
| Date | appeared 9 months ago latest price $2204 sale post disappeared 2020-11-27 |
| Price History | |
| Sale Website Type | classifieds |
| Notes | |
| Hidden text | |
sale information provided by user #402210


All photos above are REAL and display ACTUAL car. After you get the report you will see full resolution photos.
Tech Specs
| Body Style | SUV |
| Color | Magnetic Gray Metallic |
| Transmission | Automatic |
| Engine | Engine: 2.5L DOHC 4-Cylinder w/Dual VVT-i |
| Drive | All-wheel Drive |
| Fuel Type | Gasoline |
Model Analytics & Market Report
We've analyzed more than 294,800 sales records of this model and here are some numbers.
The average price for new (MSRP) 2018 TOYOTA RAV4 in 2018 was $30,710.
The average price for used 2018 TOYOTA RAV4 nowadays in 2024 is $21,231 which is 69% from the original price.
Estimated mileage driven per year is 10,177 miles.
For this model we also have depreciation curve, photos, list of features and options, and other analytics.
Take a look at 2018 TOYOTA RAV4 model page in BADVIN vehicles catalog.
Depreciation
The graph below is a depreciation curve for 2018 TOYOTA RAV4. It shows how much this model looses per year in price. This analytics is calculated using sales records from BADVIN database.
The table below shows average price for used 2018 TOYOTA RAV4 in each year since the year of manufacturing, current year price and projected price in the future years.
You can scroll the table horizontally to see all columns.
| Year | Average Mileage | Average Price | % Left | % Lost | ||
|---|---|---|---|---|---|---|
| 2018 MSRP | 0 mi | $30,710 | — | — | 100% | 0% |
| 2018 | 10,177 mi | $35,784 | −$5,074 | −16.52% | 116.52% | -16.52% |
| 2019 | 20,354 mi | $30,999 | +$4,785 | +13.37% | 100.94% | -0.94% |
| 2020 | 30,531 mi | $29,739 | +$1,260 | +4.06% | 96.84% | 3.16% |
| 2021 | 40,708 mi | $27,682 | +$2,057 | +6.92% | 90.14% | 9.86% |
| 2022 | 50,885 mi | $26,863 | +$819 | +2.96% | 87.47% | 12.53% |
| → Visit 2018 TOYOTA RAV4 depreciation page to see full data. | ||||||
Price vs Mileage
The graph below shows how mileage affects the price for 2018 TOYOTA RAV4. This data was calculated using sales records from BADVIN database.
The table below shows average price for used 2018 TOYOTA RAV4 by mileage and number of sales.
You can scroll the table horizontally to see all columns.
| Mileage | Average Price | Sample Size |
|---|---|---|
| 10,000 mi | $25,991 | 33 sales |
| 15,000 mi | $24,995 | 49 sales |
| 20,000 mi | $25,181 | 115 sales |
| 25,000 mi | $24,498 | 173 sales |
| 30,000 mi | $23,998 | 204 sales |
| 35,000 mi | $23,998 | 266 sales |
| → Visit 2018 TOYOTA RAV4 depreciation page to see full data. | ||
Get FULL ACCESS to the vehicle history report and see all blurred info.
⭐ Read 205+ reviews from our customers who used BADVIN to avoid buying junk vehicles.
Testimonials from our customers
I always rely on badvin to check out any used car before I buy. It gives such a complete history, including past accidents, service records, recalls and much more. Feel so much more confident as a used car shopper having this info.

Sofia Garcia
verified on Trustpilot
Bad Vin's vehicle history report showed that the 2018 Audi A4 I was about to buy had been in a major accident that was not disclosed by the seller. The severity analysis helped me avoid a bad purchase. Great service!
Sophie Dubois
verified on Trustpilot
I almost bought a used Honda but luckily checked the BadVin report first. Turned out it had a salvage title from flood damage that the seller didn't disclose. Phew, dodged a huge issue!
Emily Turner
verified on Trustpilot
As a used car dealer, I rely on badvin.org for checking every vehicle I'm considering purchasing at auction. The comprehensive reports give me peace of mind and help me avoid problem cars. Photos of past sales have saved me from overpaying many times. Worth every penny!
Misha
verified on Trustpilot
Compare to other 2018 TOYOTA RAV4


Other vehicles sales records


Frequently asked questions
Total loss status, if documented, is reported along with the circumstances and damage type, critical for assessing whether the 2018 TOYOTA vehicle has been substantially compromised.
The expected depreciation of a vehicle after three years can vary, but generally, cars lose a significant portion of their value within the first few years.
Yes, the Monroney label includes information about the vehicle’s manufacturing origin, specifying where the vehicle was assembled and the origin of its parts.
The market value of a vehicle is calculated based on its historical depreciation trends, current condition, mileage, and market trends.
A salvage title generally indicates that the vehicle was declared a total loss by an insurance company due to severe damage from an accident, flood, or other causes, if such information is recorded.
If the 2018 TOYOTA was used as a taxi, this information may be noted in the vehicle history report, including the duration and any relevant details affecting its wear and tear, if reported.
A VIN decoder can provide detailed information about a 2018 TOYOTA RAV4, including its manufacturing location, model year, engine type, and equipment details.
Total loss is usually determined when the cost of repairing the vehicle exceeds a certain percentage of its value before the damage occurred, as decided by the insurance company, if such data is recorded.
Sales prices from past transactions may be documented in our reports, providing a price history that aids in determining current market value, if such data is available.


