BADVIN vehicle history report for
2018 FORD EDGEVIN: 2FMPK3K9XJBB94991
Get FULL ACCESS to the vehicle history report and see all blurred info.
⭐ Read 205+ reviews from our customers who used BADVIN to avoid buying junk vehicles.
Historical Records
events
Photos
12 images
Sales History
1 records
Sale Prices
1 records
Market report
Price analytics
Historical Records
Historical records may include service and maintenance records, title status (clean, junk, salvage), insurance records, number of owners, registration events and states, and other information.
You can find more information about historical records in BADVIN reports and see more examples here.
Available historical records for VIN 2FMPK3K9XJBB94991
Latest reported mileage: 354 mi
Below you can see some examples of what these records could look like.
2022-11-30
2 years ago
111,934 mi
Damage reported: minor to moderate damage
Damage to right rear
Damage to rear
Damage to right rear
Damage to rear
2021-10-08
3 years ago
14,076 mi
Vehicle serviced
Tire repaired
Tire repaired
2019-10-11
5 years ago
42,074 mi
Vehicle sold
MILEAGE INCONSISTENCY
MILEAGE INCONSISTENCY
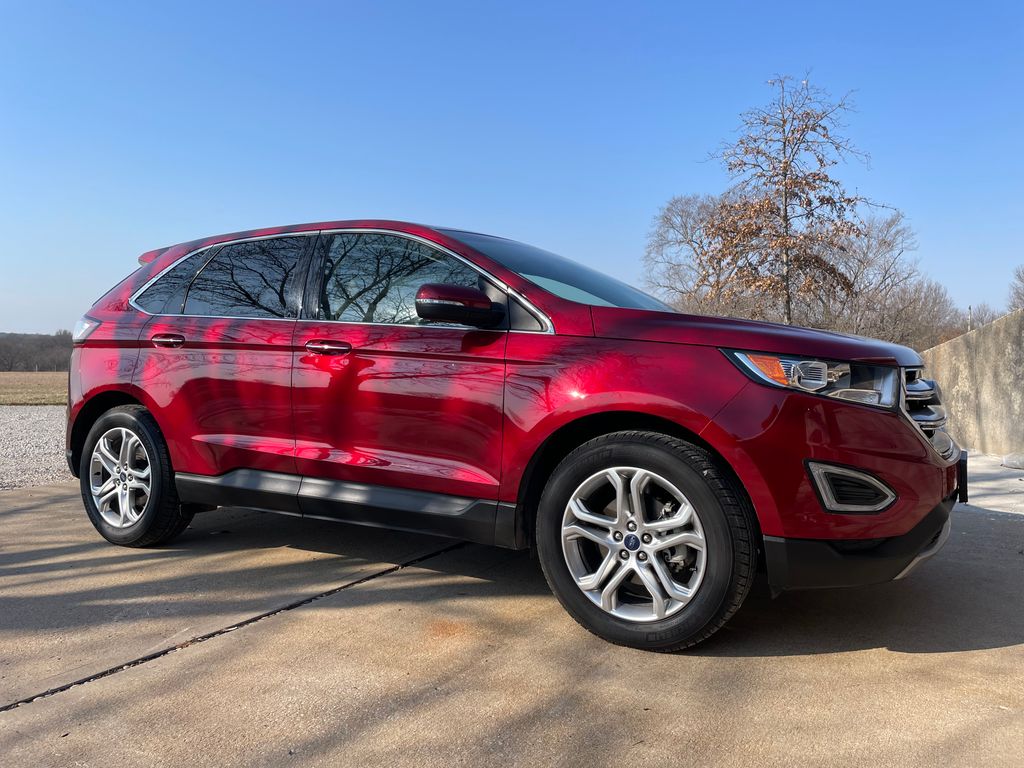
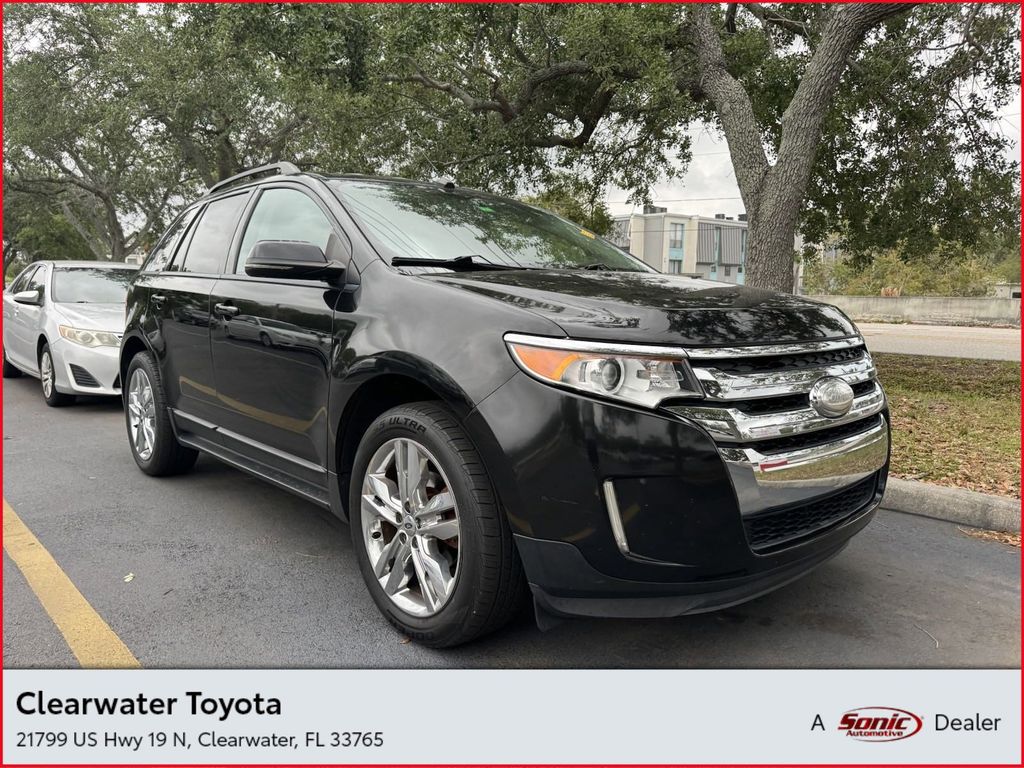
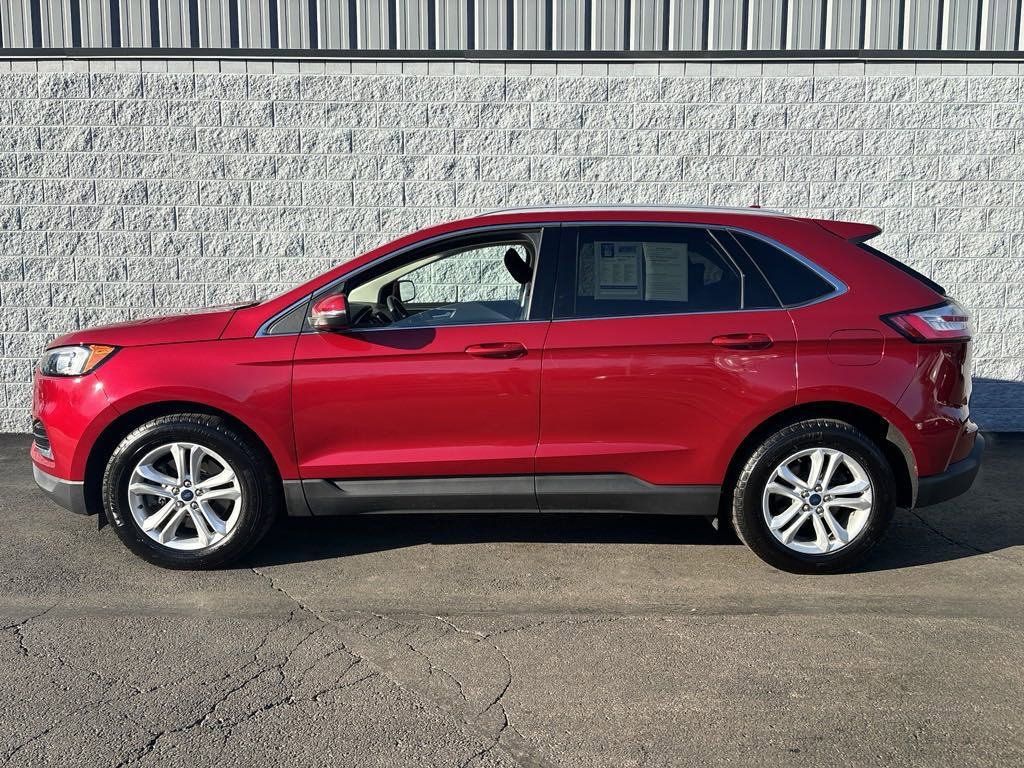
2018 Ford Edge Titanium w/ Technology Package
| Year | 2018 |
| ODO | 3685 mi |
| Seller | Hidden text (Hidden text) |
| Location | Freeman, MO, 64746 |
| Date | appeared 2 months ago latest price $4490 sale post disappeared 2020-01-05 |
| Price History | |
| Sale Website Type | classifieds |
sale information provided by user #608905


All photos above are REAL and display ACTUAL car. After you get the report you will see full resolution photos.
Tech Specs
| Color | Burgundy Exterior |
| Transmission | 6-Speed Automatic Transmission |
| Drive | 2 wheel drive - front |
Model Analytics & Market Report
We've analyzed more than 122,000 sales records of this model and here are some numbers.
The average price for new (MSRP) 2018 FORD EDGE in 2018 was $39,485.
The average price for used 2018 FORD EDGE nowadays in 2024 is $18,183 which is 46% from the original price.
Estimated mileage driven per year is 11,664 miles.
For this model we also have depreciation curve, photos, list of features and options, and other analytics.
Take a look at 2018 FORD EDGE model page in BADVIN vehicles catalog.
Depreciation
The graph below is a depreciation curve for 2018 FORD EDGE. It shows how much this model looses per year in price. This analytics is calculated using sales records from BADVIN database.
The table below shows average price for used 2018 FORD EDGE in each year since the year of manufacturing, current year price and projected price in the future years.
You can scroll the table horizontally to see all columns.
| Year | Average Mileage | Average Price | % Left | % Lost | ||
|---|---|---|---|---|---|---|
| 2018 MSRP | 0 mi | $39,485 | — | — | 100% | 0% |
| 2018 | 11,664 mi | $39,434 | +$51 | +0.13% | 99.87% | 0.13% |
| 2019 | 23,328 mi | $31,500 | +$7,934 | +20.12% | 79.78% | 20.22% |
| 2020 | 34,992 mi | $26,995 | +$4,505 | +14.3% | 68.37% | 31.63% |
| 2021 | 46,656 mi | $25,998 | +$997 | +3.69% | 65.84% | 34.16% |
| 2022 | 58,320 mi | $23,558 | +$2,440 | +9.39% | 59.66% | 40.34% |
| → Visit 2018 FORD EDGE depreciation page to see full data. | ||||||
Price vs Mileage
The graph below shows how mileage affects the price for 2018 FORD EDGE. This data was calculated using sales records from BADVIN database.
The table below shows average price for used 2018 FORD EDGE by mileage and number of sales.
You can scroll the table horizontally to see all columns.
| Mileage | Average Price | Sample Size |
|---|---|---|
| 10,000 mi | $24,998 | 21 sales |
| 15,000 mi | $22,950 | 29 sales |
| 20,000 mi | $22,168 | 68 sales |
| 25,000 mi | $21,995 | 95 sales |
| 30,000 mi | $21,491 | 119 sales |
| 35,000 mi | $21,500 | 156 sales |
| → Visit 2018 FORD EDGE depreciation page to see full data. | ||
Get FULL ACCESS to the vehicle history report and see all blurred info.
⭐ Read 205+ reviews from our customers who used BADVIN to avoid buying junk vehicles.
Testimonials from our customers
As a car dealer importing vehicles from the US to Mexico, I rely on badvin for comprehensive history reports before bidding at auctions. Their info has helped me avoid several salvage vehicles and is more thorough than carfax. A must-have service!

Javier Ramirez
verified on Trustpilot
As a broke college kid I almost settled for a sketchy 2005 Altima cuz it was cheap. but splurged on the report from badvin 1st. soooo glad I did - turned out it had been totalled and rebuilt. spending a little saved me from wasting $1000s!
Sophie
verified on Trustpilot
As a used car dealer, I rely on badvin.org for checking every vehicle I'm considering purchasing at auction. The comprehensive reports give me peace of mind and help me avoid problem cars. Photos of past sales have saved me from overpaying many times. Worth every penny!
Misha
verified on Trustpilot
Purchased a badvin report before buying a used Lexus RX 350. It revealed a minor accident the seller hadn't mentioned. I still bought the car but used the info to negotiate a lower price. Well worth the cost for the leverage it gave me!
Aiden Patel
verified on Trustpilot
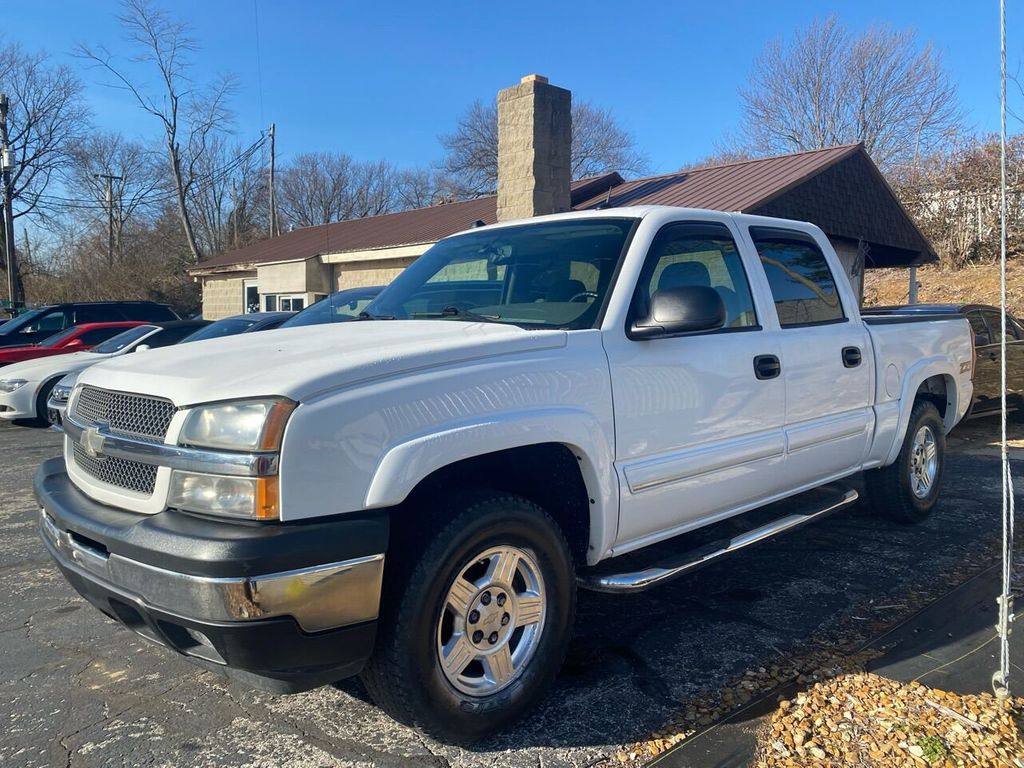
Compare to other 2018 FORD EDGE


Other vehicles sales records


Frequently asked questions
Saltwater damage, if documented, is specifically noted due to its corrosive impact on the 2018 FORD vehicle's mechanical and electrical systems.
The parts content information on a window sticker shows the percentage of vehicle components sourced from specific countries, important for consumers interested in the origin of their vehicle's parts.
The market value of a vehicle is calculated based on its historical depreciation trends, current condition, mileage, and market trends.
Regulatory changes can affect what is included on future Monroney labels, particularly as governments implement new requirements for transparency in vehicle pricing, fuel efficiency, and safety.
A VIN decoder translates the 17-character Vehicle Identification Number into understandable information about the vehicle's specifications and history.
The exterior and interior condition of vehicles significantly affects their depreciation, as well-maintained vehicles generally retain more value.


