
BADVIN vehicle history report for
2011 FORD EDGEVIN: 2FMDK4KC9BBB20807
Get FULL ACCESS to the vehicle history report and see all blurred info.
⭐ Read 205+ reviews from our customers who used BADVIN to avoid buying junk vehicles.
Historical Records
events
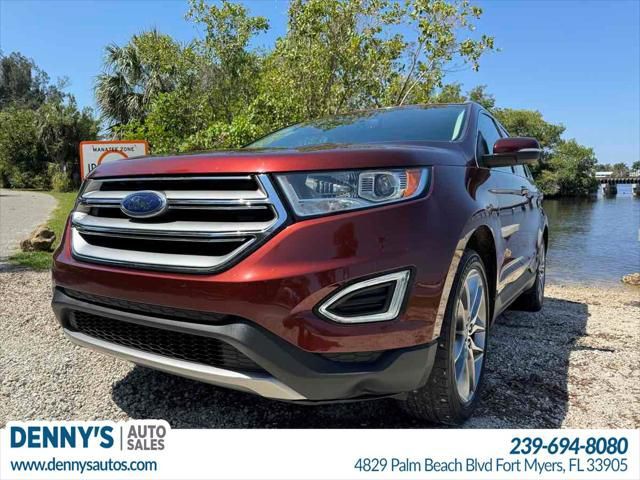
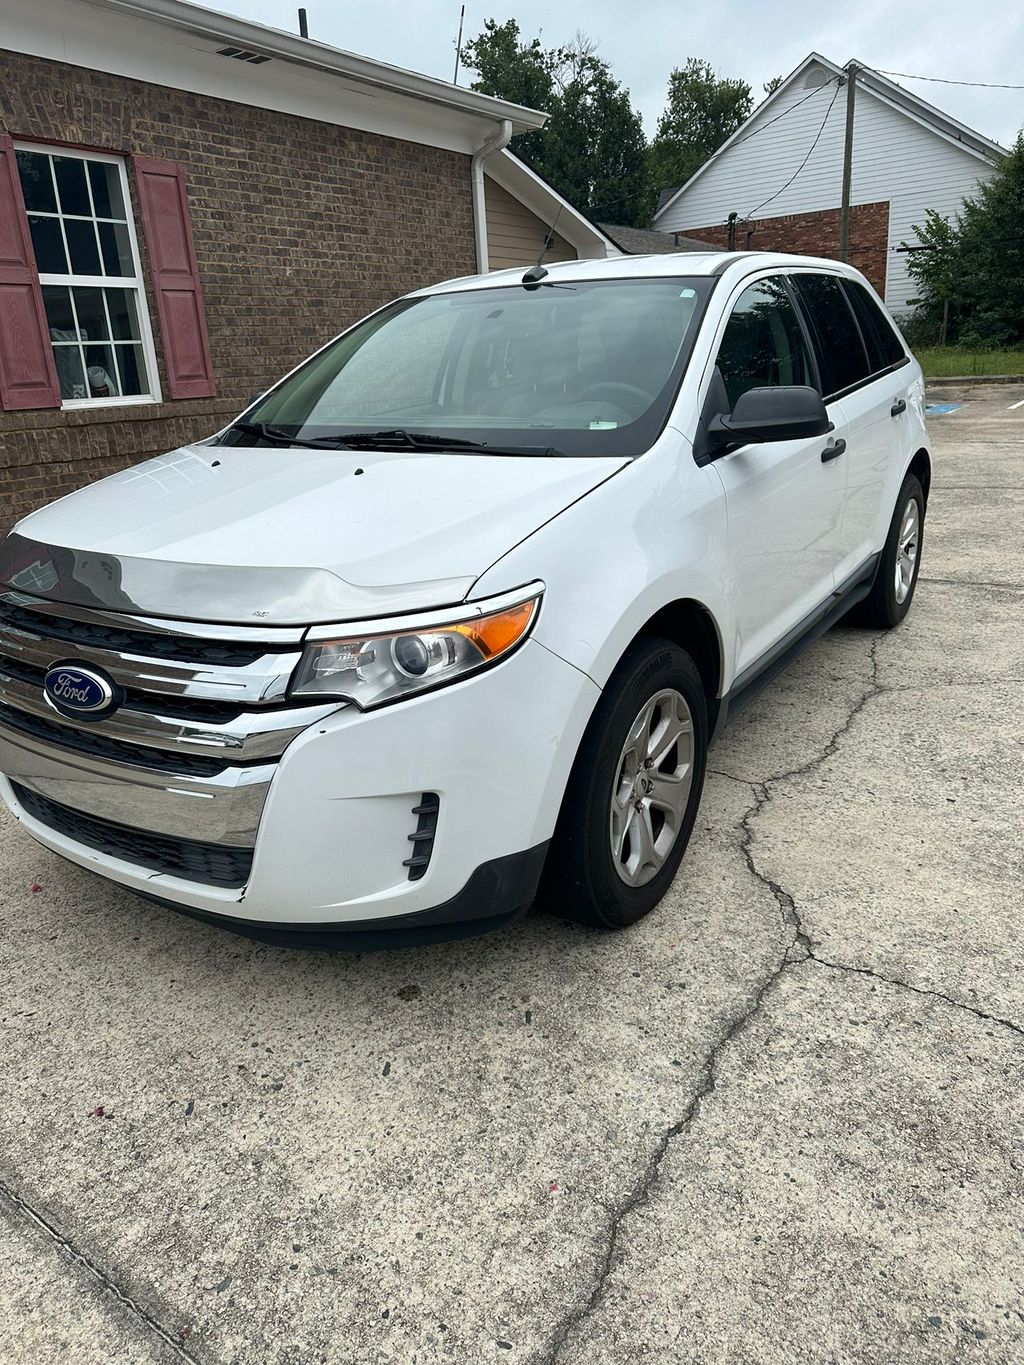
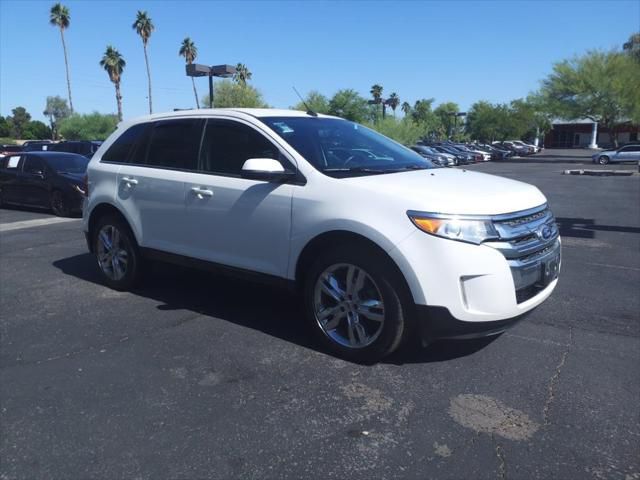
Photos
12 images
Sales History
1 records
Sale Prices
1 records
Market report
Price analytics
Historical Records
Historical records may include service and maintenance records, title status (clean, junk, salvage), insurance records, number of owners, registration events and states, and other information.
You can find more information about historical records in BADVIN reports and see more examples here.
Available historical records for VIN 2FMDK4KC9BBB20807
Latest reported mileage: 764 mi
Below you can see some examples of what these records could look like.
2023-07-11
a year ago
75,934 mi
Damage reported: very minor damage
Damage to rear
Damage to rear
2022-04-24
2 years ago
7,583 mi
TOTAL LOSS VEHICLE
Collision damage reported
Collision damage reported
2021-02-10
3 years ago
32,664 mi
Damage reported
Damage to front
Damage to front
2011 Ford Edge
| Year | 2011 |
| ODO | 7242 mi |
| Seller | Hidden text (Hidden text) |
| Location | Bordentown, NJ, 08505 |
| Date | appeared 3 years ago latest price $2470 |
| Sale Website Type | classifieds |
| Notes | |
| Hidden text | |
sale information provided by user #705983


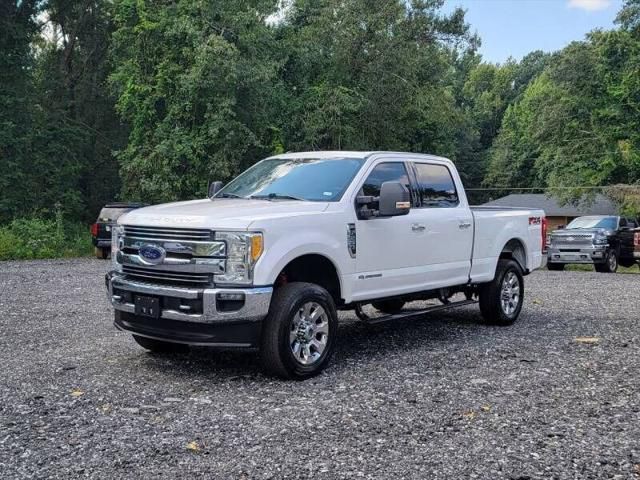
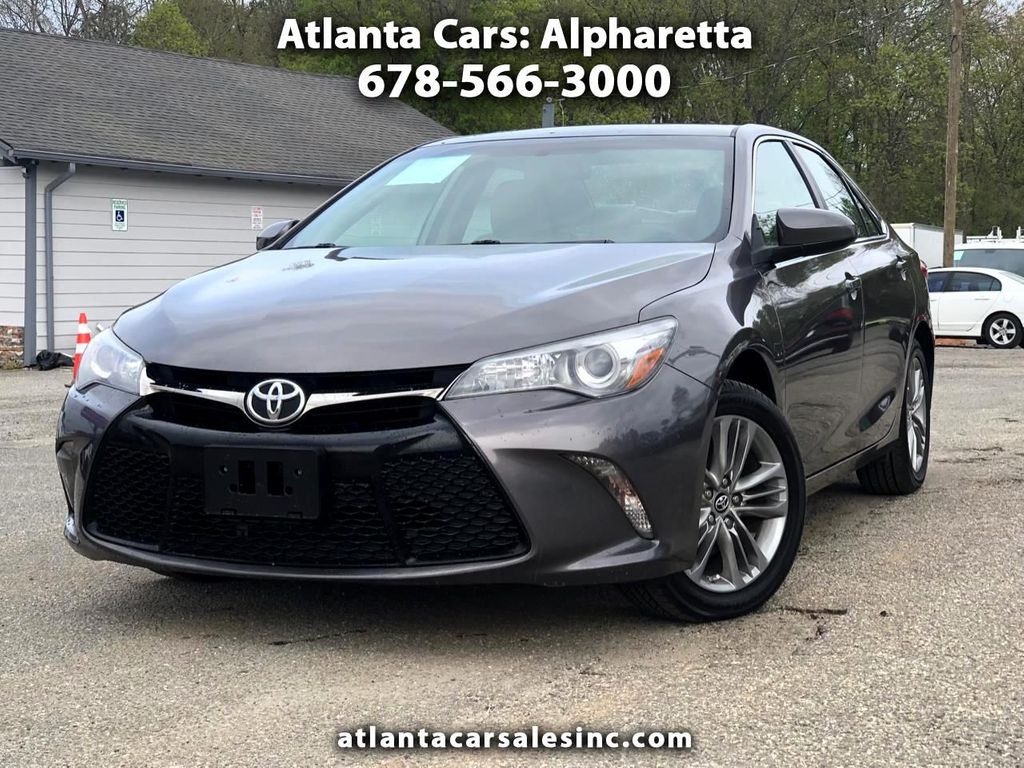
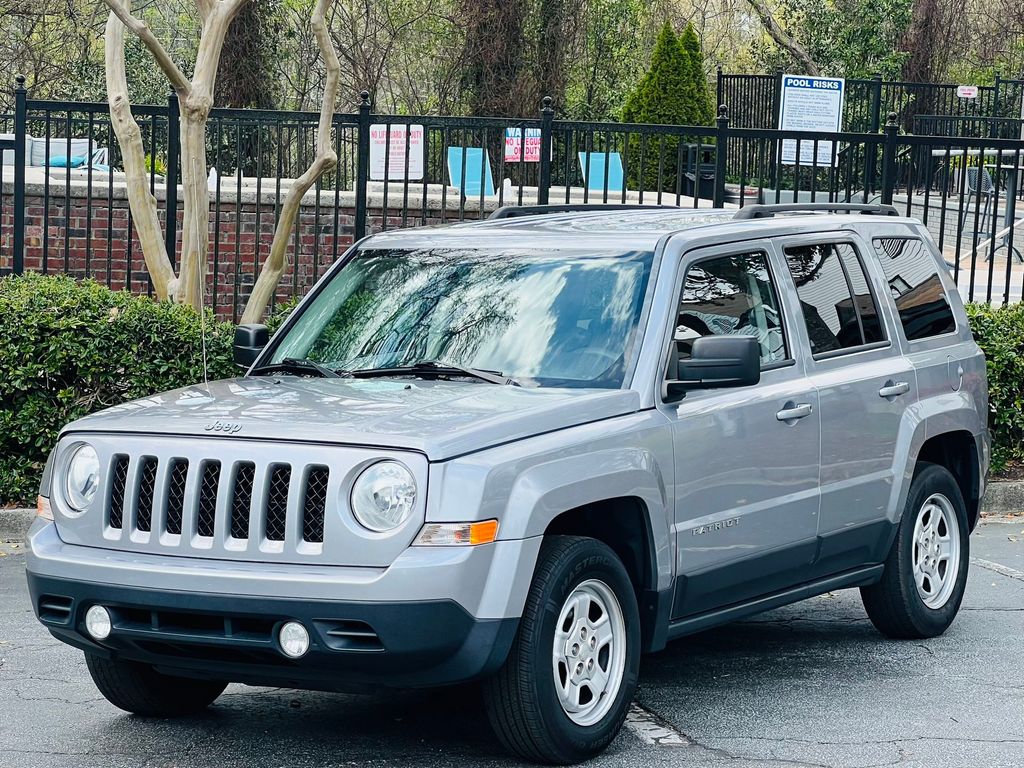
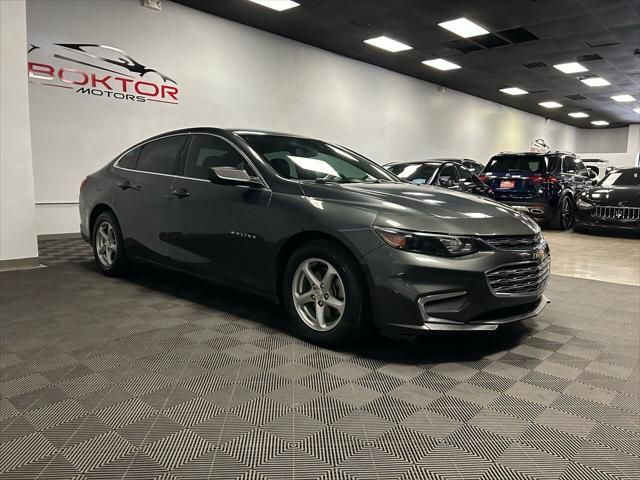
All photos above are REAL and display ACTUAL car. After you get the report you will see full resolution photos.
Tech Specs
| Body Style | Station Wagon |
| Color | blue |
| Transmission | 6-Speed Automatic w/OD |
| Cylinders | 6 |
| Drive | AWD |
| Fuel Type | Gasoline Fuel |
Model Analytics & Market Report
We've analyzed more than 40,500 sales records of this model and here are some numbers.
The average price for new (MSRP) 2011 FORD EDGE in 2011 was $39,485.
The average price for used 2011 FORD EDGE nowadays in 2024 is $8,495 which is 22% from the original price.
Estimated mileage driven per year is 11,664 miles.
For this model we also have depreciation curve, photos, list of features and options, and other analytics.
Take a look at 2011 FORD EDGE model page in BADVIN vehicles catalog.
Depreciation
The graph below is a depreciation curve for 2011 FORD EDGE. It shows how much this model looses per year in price. This analytics is calculated using sales records from BADVIN database.
The table below shows average price for used 2011 FORD EDGE in each year since the year of manufacturing, current year price and projected price in the future years.
You can scroll the table horizontally to see all columns.
| Year | Average Mileage | Average Price | % Left | % Lost | ||
|---|---|---|---|---|---|---|
| 2011 MSRP | 0 mi | $39,485 | — | — | 100% | 0% |
| 2011 | 11,664 mi | $39,434 | +$51 | +0.13% | 99.87% | 0.13% |
| 2012 | 23,328 mi | $31,500 | +$7,934 | +20.12% | 79.78% | 20.22% |
| 2013 | 34,992 mi | $26,995 | +$4,505 | +14.3% | 68.37% | 31.63% |
| 2014 | 46,656 mi | $25,998 | +$997 | +3.69% | 65.84% | 34.16% |
| 2015 | 58,320 mi | $23,558 | +$2,440 | +9.39% | 59.66% | 40.34% |
| → Visit 2011 FORD EDGE depreciation page to see full data. | ||||||
Price vs Mileage
The graph below shows how mileage affects the price for 2011 FORD EDGE. This data was calculated using sales records from BADVIN database.
The table below shows average price for used 2011 FORD EDGE by mileage and number of sales.
You can scroll the table horizontally to see all columns.
| Mileage | Average Price | Sample Size |
|---|---|---|
| 30,000 mi | $13,800 | 11 sales |
| 45,000 mi | $12,972 | 26 sales |
| 50,000 mi | $12,994 | 22 sales |
| 55,000 mi | $13,743 | 22 sales |
| 60,000 mi | $12,488 | 31 sales |
| 65,000 mi | $16,590 | 133 sales |
| → Visit 2011 FORD EDGE depreciation page to see full data. | ||
Get FULL ACCESS to the vehicle history report and see all blurred info.
⭐ Read 205+ reviews from our customers who used BADVIN to avoid buying junk vehicles.
Testimonials from our customers
As a used car dealer, I rely on badvin.org for checking every vehicle I'm considering purchasing at auction. The comprehensive reports give me peace of mind and help me avoid problem cars. Photos of past sales have saved me from overpaying many times. Worth every penny!

Misha
verified on Trustpilot
After a bad experience buying a used car that turned out to have major issues, I now use Bad VIN to thoroughly check every vehicle i consider. It costs a bit more than other services but the detailed records and photos of past sales are wotrh it for the added peace of mind.
Olivia Johnson
verified on Trustpilot
I've tried many vehicle reports but badvin's is by far the most comprehensive. It shows accident photos, past sales, repairs and so much more. I won't buy a car now without getting a report first. It's a must-have.
Alexander Hunt
verified on Trustpilot
Bad Vin's vehicle history report showed that the 2018 Audi A4 I was about to buy had been in a major accident that was not disclosed by the seller. The severity analysis helped me avoid a bad purchase. Great service!
Sophie Dubois
verified on Trustpilot
Compare to other 2011 FORD EDGE


Other vehicles sales records


Frequently asked questions
A reconstructed title, if issued, indicates significant past repairs after severe damage, which can impact the 2011 FORD vehicle’s safety and value.
The Monroney label can indirectly reflect the resale value of 2011 FORD vehicles by detailing features and specifications that are valued in the used car market.
Gray market status, if noted, indicates the 2011 FORD was imported outside official channels, potentially affecting its compliance with local regulations and parts availability.
Our reports may include records of tire rotations, indicating how regularly they were performed and at what intervals for the 2011 FORD, if data is available.
Yes, the choice of vehicle color can impact the depreciation rate, with neutral colors typically being easier to sell and potentially holding their value better than more unconventional colors.
Yes, the Monroney label typically lists the exterior color and interior options of the vehicle, providing buyers with specifics about the vehicle’s appearance and styling.
Remanufactured status, if detailed, includes major overhauls and replacements, offering a new lease on life for the 2011 FORD, but with considerations for its past use.
A VIN decoder is generally reliable for confirming the transmission type, as this information is encoded within the VIN by most manufacturers.
Discrepancies between a window sticker and actual dealer pricing can occur due to additional dealer markup, optional add-ons not included in the sticker, or regional pricing differences.


