
BADVIN vehicle history report for
2017 FORD TRANSIT CONNECTVIN: 1FTYR1ZM7HKB10760
Get FULL ACCESS to the vehicle history report and see all blurred info.
⭐ Read 206+ reviews from our customers who used BADVIN to avoid buying junk vehicles.
Historical Records
events
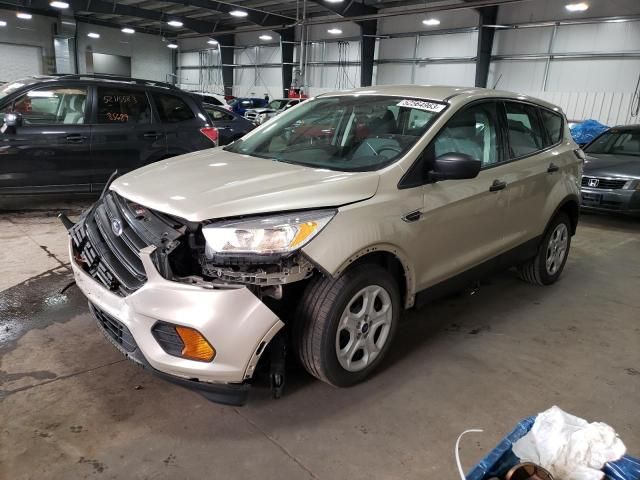
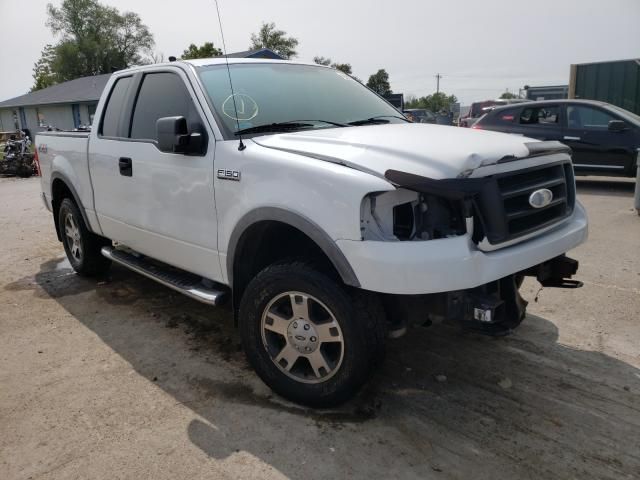
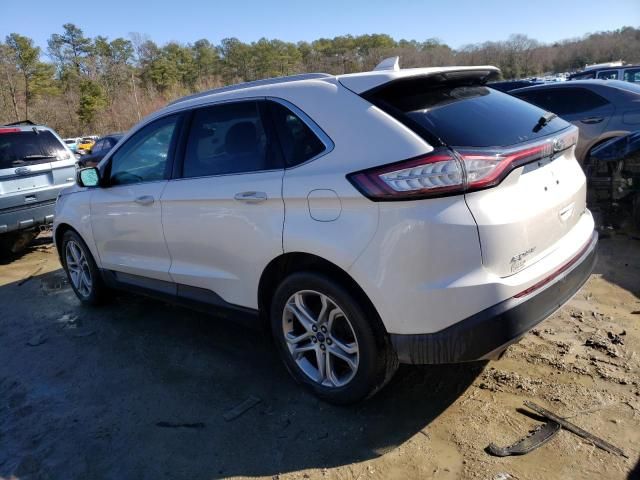
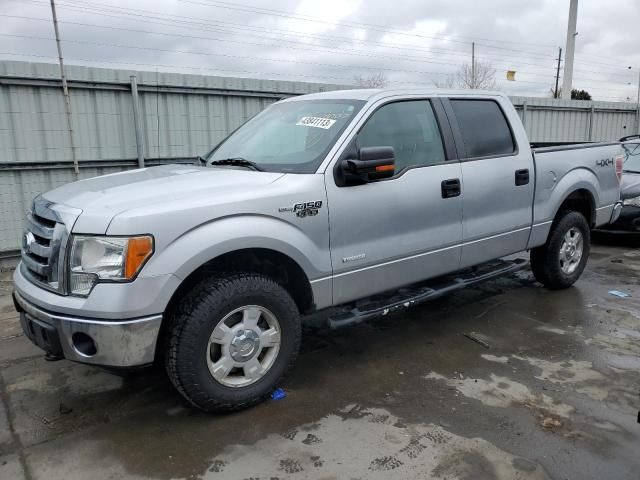
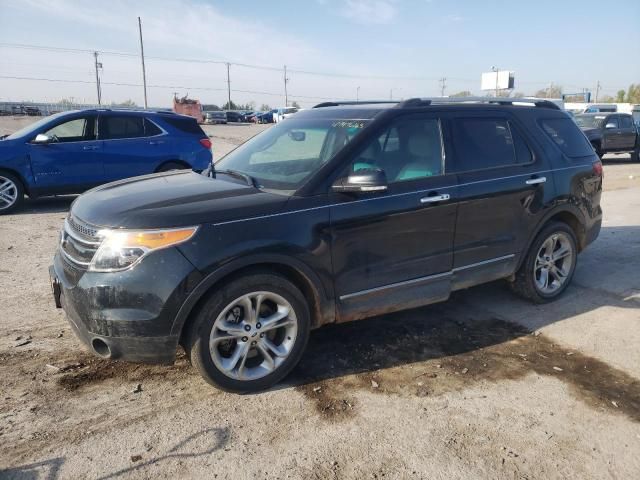
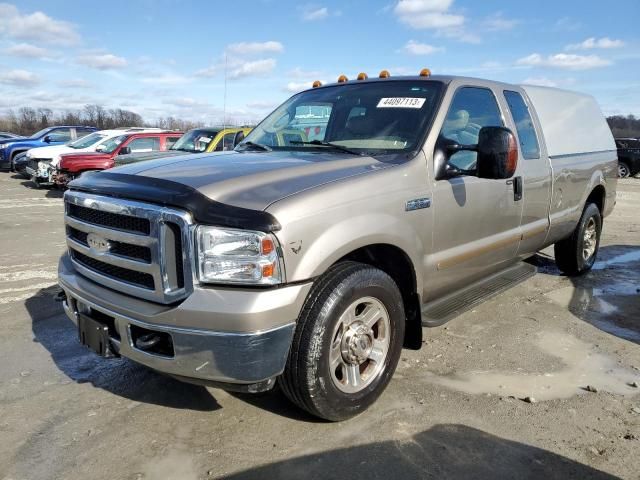
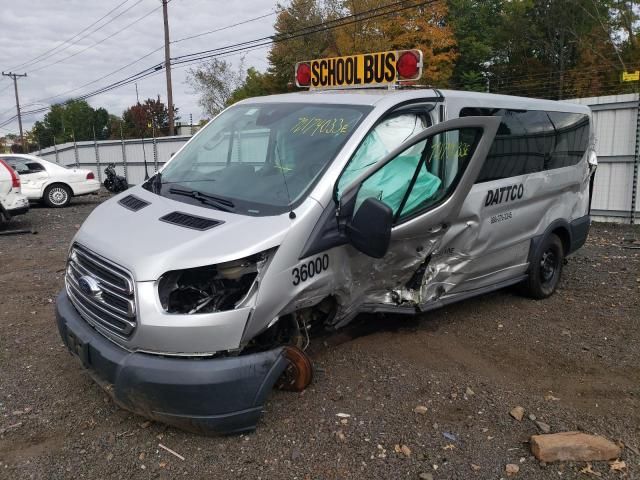
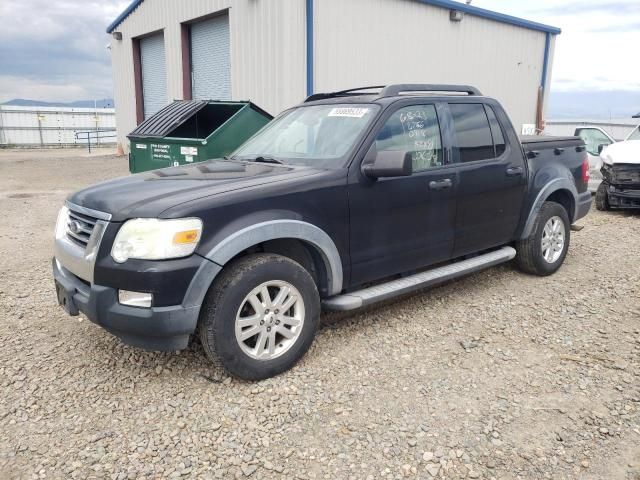
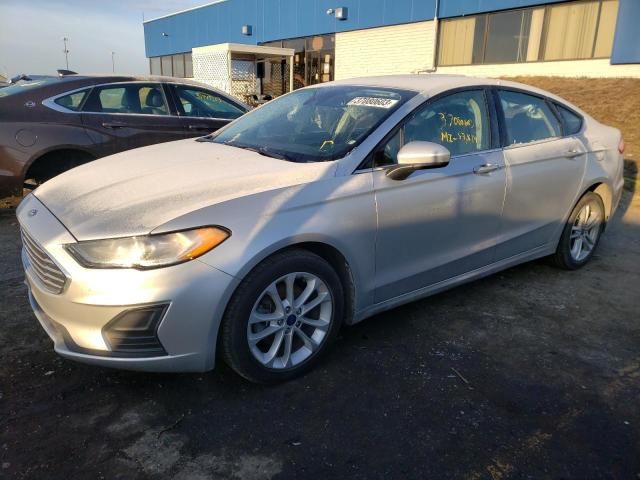
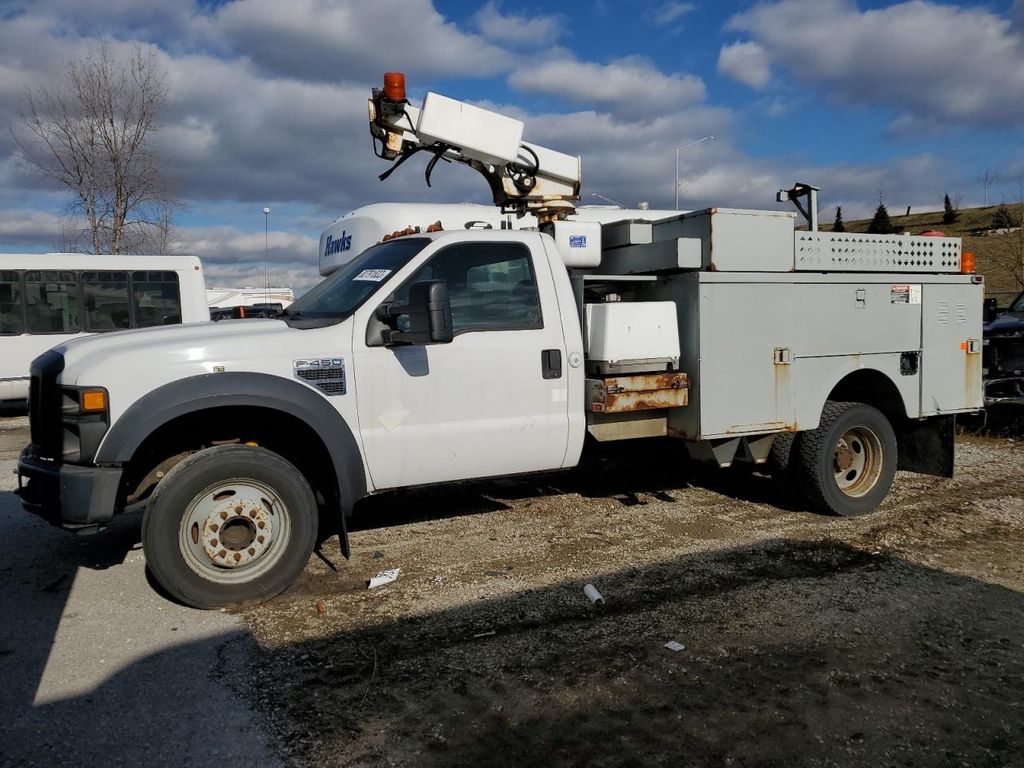
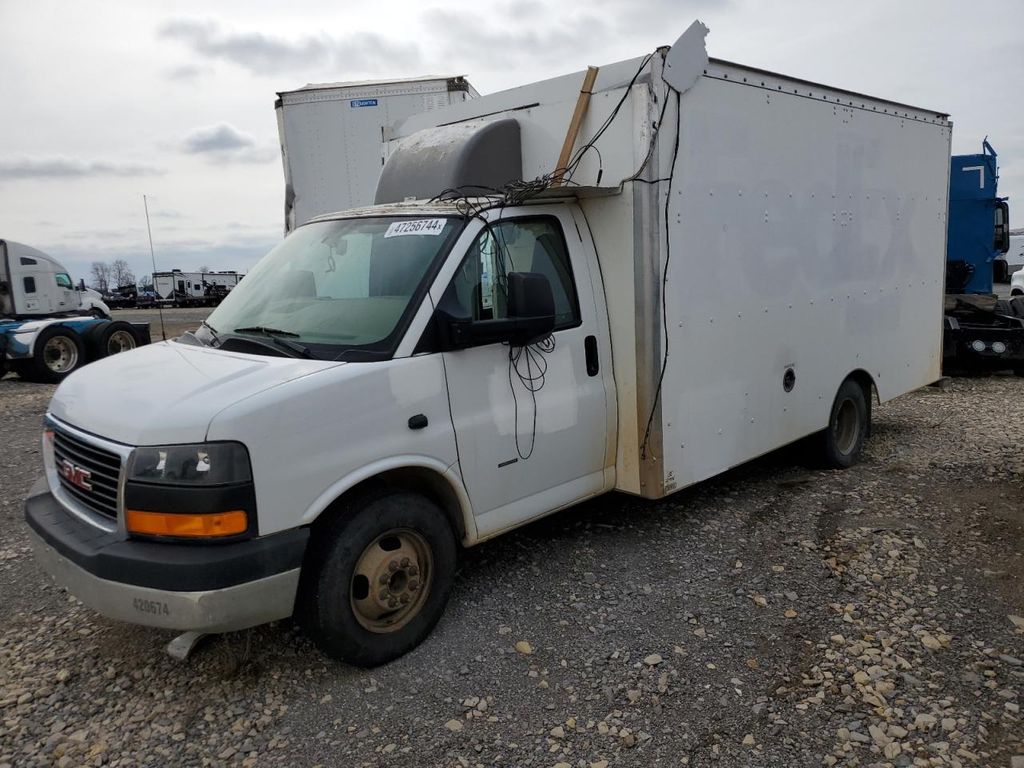
Photos
9 images
Sales History
1 records
Market report
Price analytics
Historical Records
Historical records may include service and maintenance records, title status (clean, junk, salvage), insurance records, number of owners, registration events and states, and other information.
You can find more information about historical records in BADVIN reports and see more examples here.
Available historical records for VIN 1FTYR1ZM7HKB10760
Latest reported mileage: 727 mi
Below you can see some examples of what these records could look like.
2022-11-07
2 years ago
27,232 mi
REBUILT TITLE ISSUED
2022-07-04
2 years ago
10,949 mi
SALVAGE TITLE/CERTIFICATE ISSUED
2020-07-31
4 years ago
41,559 mi
Damage reported: very minor damage
Damage to rear
Damage to rear
Sale Record
2017 FORD TRANSIT T-250
sold
| Year | 2017 |
| Title | Hidden text (Hidden text) |
| ODO | 6464 mi (Hidden text) |
| Damage | Hidden text |
| Estimated Retail Value | $1489 |
| Location | Kansas City, KS, 66111 |
| Date | ended 2 years ago |
| Sale Website Type | salvage or insurance auction |
sale information provided by user #373329


All photos above are REAL and display ACTUAL car. After you get the report you will see full resolution photos.
Tech Specs
| Body Style | CARGO VA |
| Color | WHITE |
| Transmission | AUTOMATIC |
| Engine | 3.7L 6 |
| Drive | Rear-wheel drive |
| Fuel Type | GAS |
Model Analytics & Market Report
We've analyzed more than 17,500 sales records of this model and here are some numbers.
The average price for new (MSRP) 2017 FORD TRANSIT CONNECT in 2017 was $33,715.
The average price for used 2017 FORD TRANSIT CONNECT nowadays in 2024 is $16,495 which is 49% from the original price.
Estimated mileage driven per year is 14,714 miles.
For this model we also have depreciation curve, photos, list of features and options, and other analytics.
Take a look at 2017 FORD TRANSIT CONNECT model page in BADVIN vehicles catalog.
Depreciation
The graph below is a depreciation curve for 2017 FORD TRANSIT CONNECT. It shows how much this model looses per year in price. This analytics is calculated using sales records from BADVIN database.
The table below shows average price for used 2017 FORD TRANSIT CONNECT in each year since the year of manufacturing, current year price and projected price in the future years.
You can scroll the table horizontally to see all columns.
| Year | Average Mileage | Average Price | % Left | % Lost | ||
|---|---|---|---|---|---|---|
| 2017 MSRP | 0 mi | $33,715 | — | — | 100% | 0% |
| 2018 | 29,428 mi | $37,248 | +$0 | +0% | 110.48% | -10.48% |
| 2019 | 44,142 mi | $30,495 | +$6,753 | +18.13% | 90.45% | 9.55% |
| 2020 | 58,856 mi | $25,984 | +$4,511 | +14.79% | 77.07% | 22.93% |
| 2021 | 73,570 mi | $21,998 | +$3,986 | +15.34% | 65.25% | 34.75% |
| → Visit 2017 FORD TRANSIT CONNECT depreciation page to see full data. | ||||||
Price vs Mileage
The graph below shows how mileage affects the price for 2017 FORD TRANSIT CONNECT. This data was calculated using sales records from BADVIN database.
The table below shows average price for used 2017 FORD TRANSIT CONNECT by mileage and number of sales.
You can scroll the table horizontally to see all columns.
| Mileage | Average Price | Sample Size |
|---|---|---|
| 10,000 mi | $25,719 | 14 sales |
| 20,000 mi | $25,950 | 31 sales |
| 25,000 mi | $24,998 | 20 sales |
| 30,000 mi | $23,899 | 31 sales |
| 35,000 mi | $24,777 | 48 sales |
| 40,000 mi | $23,593 | 49 sales |
| → Visit 2017 FORD TRANSIT CONNECT depreciation page to see full data. | ||
Get FULL ACCESS to the vehicle history report and see all blurred info.
⭐ Read 206+ reviews from our customers who used BADVIN to avoid buying junk vehicles.
Testimonials from our customers
I always rely on badvin to check out any used car before I buy. It gives such a complete history, including past accidents, service records, recalls and much more. Feel so much more confident as a used car shopper having this info.

Sofia Garcia
verified on Trustpilot
I import used luxury cars from US auctions to resell in Russia. The vehicle history reports from badVIN are essential for avoiding problem cars. For a BMW I was bidding on, it uncovered a salvage title from flood damage that other reports missed! That alone pays for the service.
Dmitry Volkov
verified on Trustpilot
Purchased a badvin report before buying a used Lexus RX 350. It revealed a minor accident the seller hadn't mentioned. I still bought the car but used the info to negotiate a lower price. Well worth the cost for the leverage it gave me!
Aiden Patel
verified on Trustpilot
I almost bought a 2019 Malibu that seemed like a great deal - low miles and price. But the badvin report showed it used to be a rental fleet vehicle, which the seller didn't disclose. Glad I found out before buying someone else's abused rental!
Benjamin Torres
verified on Trustpilot
Compare to other 2017 FORD TRANSIT CONNECT
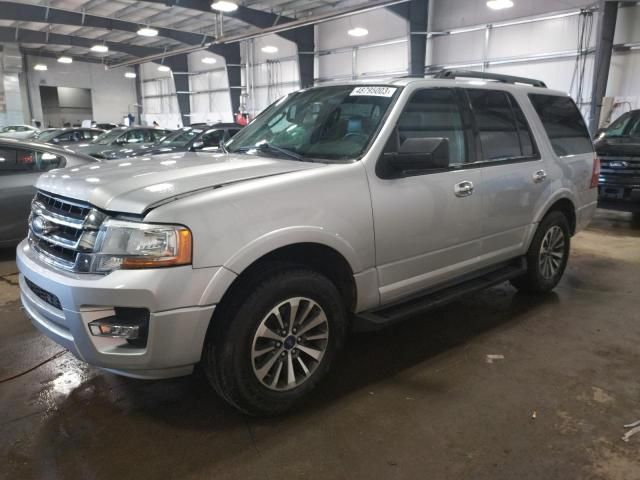
2016 FORD EXPEDITION
in 2 days, 156,676 mi
est retail value $19,226
buy now price $4,950
VIN 1FMJU1HT0GEF05428
2011 FORD F-150
in 14 hours, 121,577 mi
est retail value $17,293
buy now price $6,400
VIN 1FTFW1ET2BFB32596

2022 FORD EXPEDITION
a month ago, 18,756 mi
est retail value $60,085
buy now price $39,300
VIN 1FMJK1HT5NEA58324

Other vehicles sales records


Frequently asked questions
The number of previous owners, if documented, may provide insights into how multiple ownerships might have influenced the 2017 FORD vehicle’s condition and maintenance.
The exterior and interior condition of vehicles significantly affects their depreciation, as well-maintained vehicles generally retain more value.
Stolen or repossessed status, if recorded, can affect the 2017 FORD vehicle’s legal and financial status, impacting its marketability and insurability.
The duration each owner kept the 2017 FORD may provide insights into how the vehicle was valued and maintained over its lifetime, subject to record availability.
Transmission replacement history, if applicable, might be detailed in our reports, providing insights into major repairs and vehicle reliability, if available.
Mileage is considered a major factor in the depreciation of vehicles because it directly correlates with the amount of use and potential wear and tear the vehicle has undergone.
The expected depreciation of a vehicle after three years can vary, but generally, cars lose a significant portion of their value within the first few years.
The market value of a vehicle is calculated based on its historical depreciation trends, current condition, mileage, and market trends.


