
BADVIN vehicle history report for
2000 FORD RANGERVIN: 1FTYR10C6YTA44295
Get FULL ACCESS to the vehicle history report and see all blurred info.
⭐ Read 206+ reviews from our customers who used BADVIN to avoid buying junk vehicles.
Historical Records
events
Photos
18 images
Sales History
2 records
Sale Prices
1 records
Market report
Price analytics
Historical Records
Historical records may include service and maintenance records, title status (clean, junk, salvage), insurance records, number of owners, registration events and states, and other information.
You can find more information about historical records in BADVIN reports and see more examples here.
Available historical records for VIN 1FTYR10C6YTA44295
Latest reported mileage: 645 mi
Below you can see some examples of what these records could look like.
2022-08-27
2 years ago
124,908 mi
Accident reported: minor damage with another motor vehicle
Damage to rear
Damage to rear
2021-10-07
3 years ago
6,392 mi
New owner reported
REBUILT TITLE ISSUED
REBUILT TITLE ISSUED
2019-01-05
5 years ago
38,097 mi
Damage reported: very minor damage
Damage to rear
Damage to rear
Sale Record
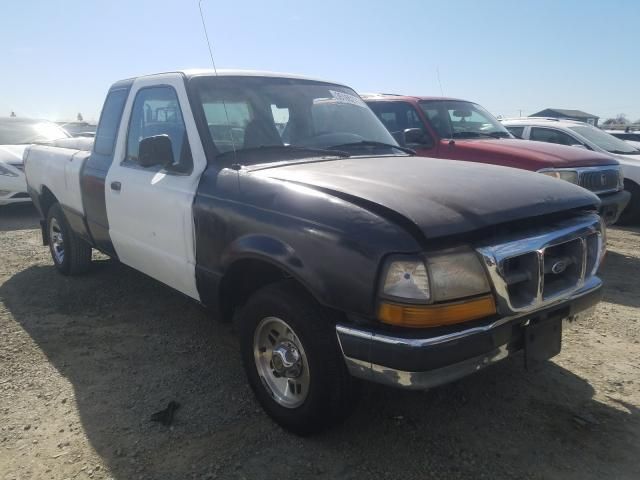
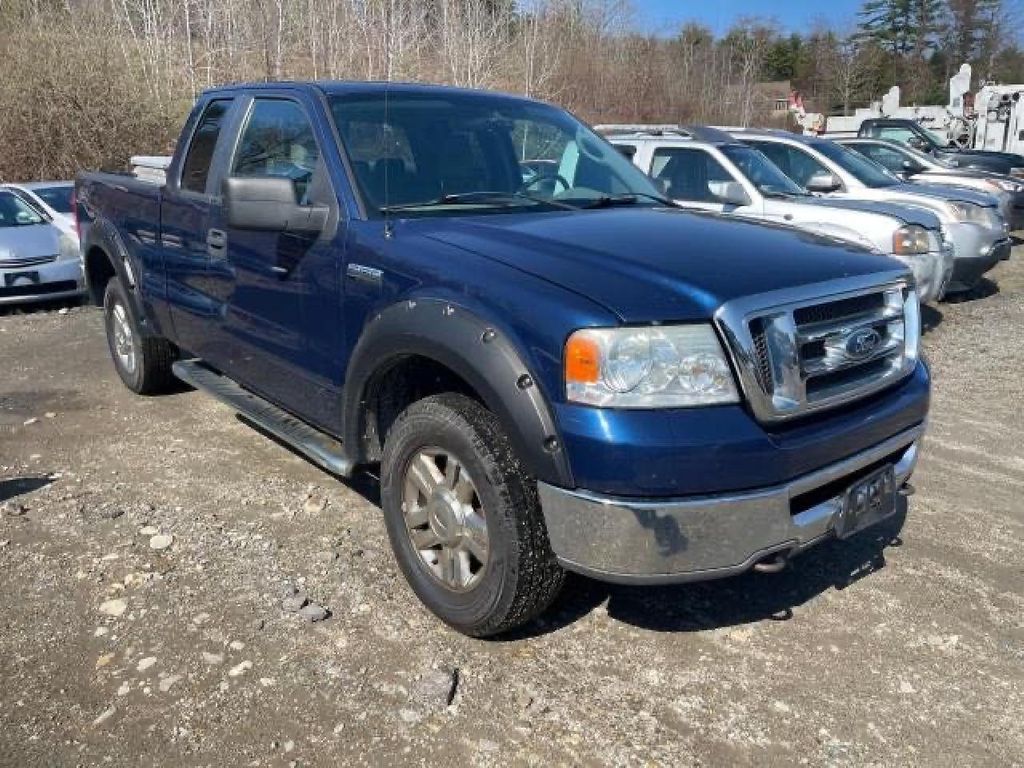
2000 FORD RANGER
sold
| Year | 2000 |
| Title | Hidden text (Hidden text) |
| ODO | 9555 mi (Hidden text) |
| Damage | Hidden text, Hidden text |
| Estimated Retail Value | $8891 |
| Estimated Repair Cost | $7277 (454%) |
| Location | Fredericksburg, VA, 22408 |
| Date | ended 4 years ago |
| Sale Website Type | salvage or insurance auction |
sale information provided by user #512716


All photos above are REAL and display ACTUAL car. After you get the report you will see full resolution photos.
Tech Specs
| Color | BLUE |
| Transmission | AUTOMATIC |
| Engine | 2.5L 4 |
| Drive | Rear-wheel drive |
| Fuel Type | GAS |
Model Analytics & Market Report
We've analyzed more than 7,000 sales records of this model and here are some numbers.
The average price for new (MSRP) 2000 FORD RANGER in 2000 was $38,035.
The average price for used 2000 FORD RANGER nowadays in 2024 is $6,500 which is 17% from the original price.
Estimated mileage driven per year is 7,704 miles.
For this model we also have depreciation curve, photos, list of features and options, and other analytics.
Take a look at 2000 FORD RANGER model page in BADVIN vehicles catalog.
Depreciation
The graph below is a depreciation curve for 2000 FORD RANGER. It shows how much this model looses per year in price. This analytics is calculated using sales records from BADVIN database.
The table below shows average price for used 2000 FORD RANGER in each year since the year of manufacturing, current year price and projected price in the future years.
You can scroll the table horizontally to see all columns.
| Year | Average Mileage | Average Price | % Left | % Lost | ||
|---|---|---|---|---|---|---|
| 2000 MSRP | 0 mi | $38,035 | — | — | 100% | 0% |
| 2000 | 7,704 mi | $55,746 | −$17,711 | −46.57% | 146.57% | -46.57% |
| 2001 | 15,408 mi | $37,992 | +$17,754 | +31.85% | 99.89% | 0.11% |
| 2002 | 23,112 mi | $35,039 | +$2,953 | +7.77% | 92.12% | 7.88% |
| 2003 | 30,816 mi | $32,500 | +$2,539 | +7.25% | 85.45% | 14.55% |
| 2004 | 38,520 mi | $29,990 | +$2,510 | +7.72% | 78.85% | 21.15% |
| → Visit 2000 FORD RANGER depreciation page to see full data. | ||||||
Price vs Mileage
The graph below shows how mileage affects the price for 2000 FORD RANGER. This data was calculated using sales records from BADVIN database.
The table below shows average price for used 2000 FORD RANGER by mileage and number of sales.
You can scroll the table horizontally to see all columns.
| Mileage | Average Price | Sample Size |
|---|---|---|
| 35,000 mi | $9,993 | 14 sales |
| 40,000 mi | $10,900 | 19 sales |
| 45,000 mi | $10,981 | 14 sales |
| 50,000 mi | $9,999 | 29 sales |
| 55,000 mi | $10,995 | 30 sales |
| 60,000 mi | $9,750 | 38 sales |
| → Visit 2000 FORD RANGER depreciation page to see full data. | ||
Get FULL ACCESS to the vehicle history report and see all blurred info.
⭐ Read 206+ reviews from our customers who used BADVIN to avoid buying junk vehicles.
Testimonials from our customers
I always rely on badvin to check out any used car before I buy. It gives such a complete history, including past accidents, service records, recalls and much more. Feel so much more confident as a used car shopper having this info.

Sofia Garcia
verified on Trustpilot
As a broke college kid I almost settled for a sketchy 2005 Altima cuz it was cheap. but splurged on the report from badvin 1st. soooo glad I did - turned out it had been totalled and rebuilt. spending a little saved me from wasting $1000s!
Sophie
verified on Trustpilot
I've tried a bunch of different vehicle history reports over the years and badvin.org has been the most comprehensive by far. Stuff like service records, ownership history, lien and repo info that I haven't found elsewhere. Def go-to resource when shopping for used vehicles now.
Levi Johnson
verified on Trustpilot
After a bad experience buying a used car that turned out to have major issues, I now use Bad VIN to thoroughly check every vehicle i consider. It costs a bit more than other services but the detailed records and photos of past sales are wotrh it for the added peace of mind.
Olivia Johnson
verified on Trustpilot
Compare to other 2000 FORD RANGER


Other vehicles sales records


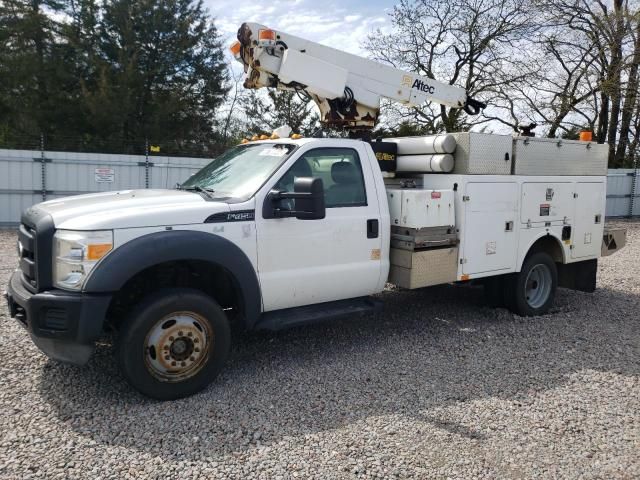
2012 FORD F450
15 days ago, 224,953 mi
est retail value $19,340
buy now price $1,600
VIN 1FDUF4HY2CED10705


Frequently asked questions
Aftermarket modifications can affect the depreciation of 2000 FORD RANGER either positively, by enhancing appeal to certain buyers, or negatively, by deterring those who prefer stock condition.
Dismantled status, if noted, shows the vehicle has been taken apart for parts or salvage, significantly impacting the 2000 FORD's value and functionality.
To possibly get a vehicle history report by VIN, you can enter the VIN on our website's search tool; the availability and detail of the report will depend on the data accessible for that specific VIN.
Registration information, if available, includes current and historical registration data, offering insights into the 2000 FORD RANGER's ownership timeline.
Rebuild records, if available, show the extent of reconstruction after significant damage, important for assessing the current condition of the 2000 FORD RANGER.
Some models may depreciate faster due to factors like lower demand, higher maintenance costs, or outdated technology compared to newer versions.


