
BADVIN vehicle history report for
2012 FORD F-150VIN: 1FTFW1E66CFB47629
Get FULL ACCESS to the vehicle history report and see all blurred info.
⭐ Read 206+ reviews from our customers who used BADVIN to avoid buying junk vehicles.
Historical Records
events
Photos
31 images
Sales History
3 records
Sale Prices
2 records
Market report
Price analytics
Historical Records
Historical records may include service and maintenance records, title status (clean, junk, salvage), insurance records, number of owners, registration events and states, and other information.
You can find more information about historical records in BADVIN reports and see more examples here.
Available historical records for VIN 1FTFW1E66CFB47629
Latest reported mileage: 177 mi
Below you can see some examples of what these records could look like.
2023-06-17
a year ago
44,265 mi
Passed emissions inspection
2022-03-23
2 years ago
17,913 mi
Odometer reading reported
2019-04-27
5 years ago
35,484 mi
Vehicle serviced
40,000 mile service performed
40,000 mile service performed
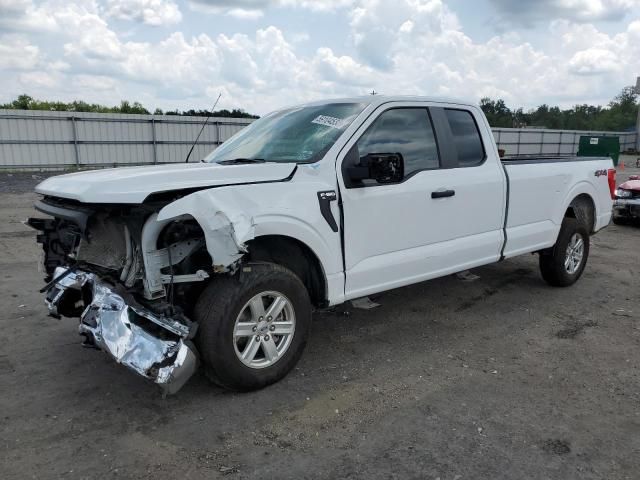
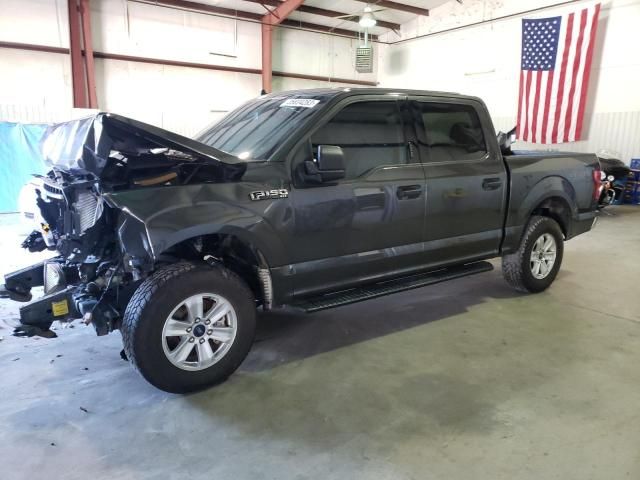
Sale Record
2012 FORD F150 SUPERCREW
sold
| Year | 2012 |
| Title | Hidden text (Hidden text) |
| ODO | — (Hidden text) |
| Damage | Hidden text, Hidden text |
| Estimated Retail Value | $4540 |
| Estimated Repair Cost | $1721 (810%) |
| Location | JACKSONVILLE NORTH, FL, 32099 |
| Date | ended 2 years ago |
| Sale Website Type | salvage or insurance auction |
sale information provided by user #139415


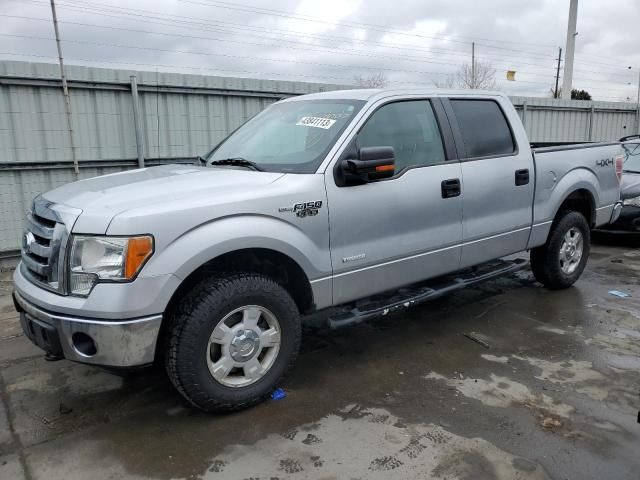
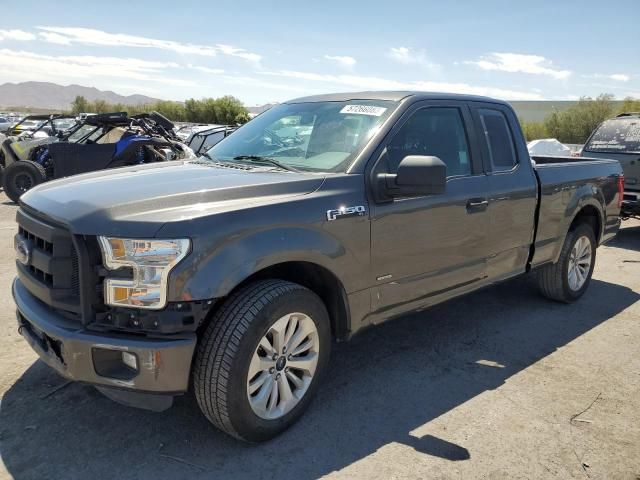
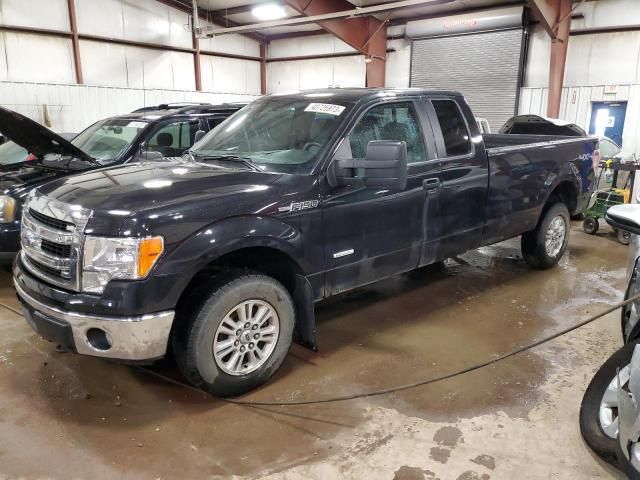
All photos above are REAL and display ACTUAL car. After you get the report you will see full resolution photos.
Tech Specs
| Body Style | CREW PIC |
| Color | WHITE |
| Transmission | AUTOMATIC |
| Engine | 6.2L 8 |
| Drive | 4x4 w/Rear Wheel Drv |
| Fuel Type | GAS |
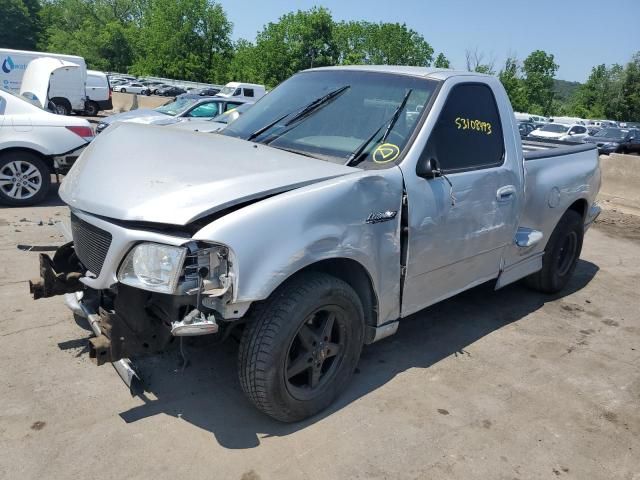
2012 Ford F150 SuperCrew Cab
| Year | 2012 |
| ODO | 3581 mi |
| Seller | Hidden text (Hidden text) |
| Location | Orlando, FL, 32808 |
| Date | appeared 2 years ago latest price $6212 |
| Sale Website Type | classifieds |
| Notes | |
| Hidden text | |
sale information provided by user #281382


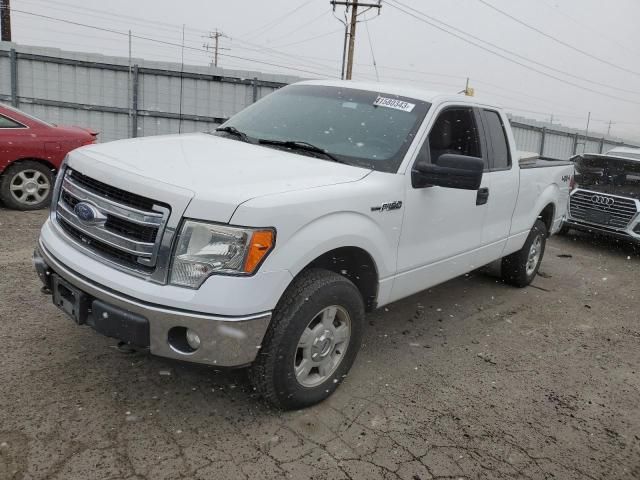
All photos above are REAL and display ACTUAL car. After you get the report you will see full resolution photos.
Tech Specs
| Body Style | Pickup |
| Color | white |
| Cylinders | 8 |
| Drive | 4WD |
| Fuel Type | Gasoline |
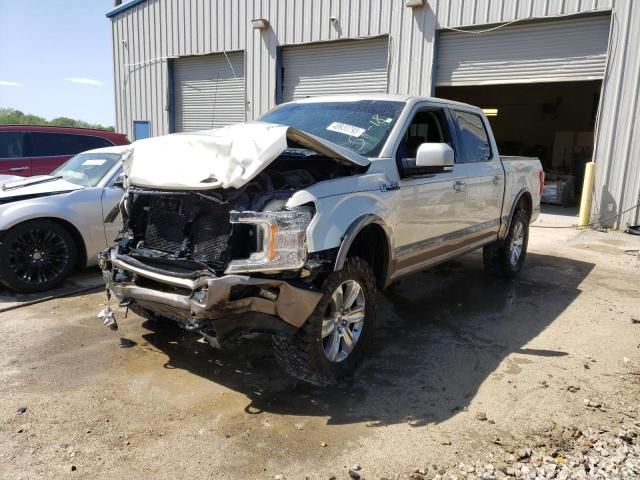
Sale Record
2012 FORD F150 SUPERCREW
sold
| Year | 2012 |
| Title | Hidden text (Hidden text) |
| ODO | 4241 mi (Hidden text) |
| Damage | Hidden text |
| Estimated Retail Value | $6571 |
| Estimated Repair Cost | $1635 (267%) |
| Seller | Hidden text |
| Location | TAMPA SOUTH, FL, 33601 |
| Date | ended 3 years ago |
| Sale Website Type | salvage or insurance auction |
sale information provided by user #384243


All photos above are REAL and display ACTUAL car. After you get the report you will see full resolution photos.
Tech Specs
| Body Style | CREW PIC |
| Color | WHITE |
| Transmission | AUTOMATIC |
| Engine | 6.2L 8 |
| Drive | 4x4 w/Rear Wheel Drv |
| Fuel Type | GAS |
Model Analytics & Market Report
We've analyzed more than 136,000 sales records of this model and here are some numbers.
The average price for new (MSRP) 2012 FORD F-150 in 2012 was $50,165.
The average price for used 2012 FORD F-150 nowadays in 2024 is $15,900 which is 32% from the original price.
Estimated mileage driven per year is 9,394 miles.
For this model we also have depreciation curve, photos, list of features and options, and other analytics.
Take a look at 2012 FORD F-150 model page in BADVIN vehicles catalog.
Depreciation
The graph below is a depreciation curve for 2012 FORD F-150. It shows how much this model looses per year in price. This analytics is calculated using sales records from BADVIN database.
The table below shows average price for used 2012 FORD F-150 in each year since the year of manufacturing, current year price and projected price in the future years.
You can scroll the table horizontally to see all columns.
| Year | Average Mileage | Average Price | % Left | % Lost | ||
|---|---|---|---|---|---|---|
| 2012 MSRP | 0 mi | $50,165 | — | — | 100% | 0% |
| 2012 | 9,394 mi | $57,250 | −$7,085 | −14.12% | 114.12% | -14.12% |
| 2013 | 18,788 mi | $52,995 | +$4,255 | +7.43% | 105.64% | -5.64% |
| 2014 | 28,182 mi | $45,995 | +$7,000 | +13.21% | 91.69% | 8.31% |
| 2015 | 37,576 mi | $41,404 | +$4,591 | +9.98% | 82.54% | 17.46% |
| 2016 | 46,970 mi | $33,798 | +$7,606 | +18.37% | 67.37% | 32.63% |
| → Visit 2012 FORD F-150 depreciation page to see full data. | ||||||
Price vs Mileage
The graph below shows how mileage affects the price for 2012 FORD F-150. This data was calculated using sales records from BADVIN database.
The table below shows average price for used 2012 FORD F-150 by mileage and number of sales.
You can scroll the table horizontally to see all columns.
| Mileage | Average Price | Sample Size |
|---|---|---|
| 30,000 mi | $19,993 | 10 sales |
| 35,000 mi | $24,995 | 19 sales |
| 40,000 mi | $21,897 | 18 sales |
| 45,000 mi | $19,799 | 19 sales |
| 50,000 mi | $19,695 | 36 sales |
| 55,000 mi | $20,895 | 27 sales |
| → Visit 2012 FORD F-150 depreciation page to see full data. | ||
Get FULL ACCESS to the vehicle history report and see all blurred info.
⭐ Read 206+ reviews from our customers who used BADVIN to avoid buying junk vehicles.
Testimonials from our customers
BadVin's vehicle history report is a must-have before buying any used vehicle. It's saved me from a few lemons over the years - cars that looked great on the surface but had hidden issues like accidents or title problems. Well worth the price.

Camila Santos
verified on Trustpilot
I've tried many vehicle reports but badvin's is by far the most comprehensive. It shows accident photos, past sales, repairs and so much more. I won't buy a car now without getting a report first. It's a must-have.
Alexander Hunt
verified on Trustpilot
Purchased a badvin report before buying a used Lexus RX 350. It revealed a minor accident the seller hadn't mentioned. I still bought the car but used the info to negotiate a lower price. Well worth the cost for the leverage it gave me!
Aiden Patel
verified on Trustpilot
Ich hätte fast einen 2017 Mercedes-Benz C300 gekauft, bis der Bad Vin-Bericht zeigte, dass er als durch Überschwemmung beschädigt gemeldet wurde. Die detaillierten Schadensaufzeichnungen haben mich vor einem großen Fehler bewahrt!
Sophia Müller
verified on Trustpilot
Compare to other 2012 FORD F-150


2011 FORD F-150
in 3 days, 121,577 mi
est retail value $17,293
buy now price $5,900
VIN 1FTFW1ET2BFB32596
2013 FORD F-150
8 days ago, 143,668 mi
est retail value $13,278
buy now price $4,300
VIN 1FTFX1EF4DKF32161

2007 FORD F-150
18 days ago, 156,027 mi
est retail value $10,785
buy now price $2,900
VIN 1FTPW14V67KB65462
2016 FORD F-150
3 months ago, 128,447 mi
est retail value $29,733
buy now price $12,000
VIN 1FTEX1CPXGKE16765
Other vehicles sales records


2009 DODGE RAM 1500
in 8 hours, 172,555 mi
est retail value $7,673
buy now price $1,700
VIN 1D3HV16P59J520711


2016 BUICK ENVISION
in 8 hours, 138,166 mi
est retail value $15,025
buy now price $2,650
VIN LRBFXESX3GD168097
2014 FORD F-150
in 8 hours, 53,653 mi
est retail value $20,812
buy now price $7,300
VIN 1FTVX1ET5EKD73136

2017 RAM 1500
in 8 hours, 129,632 mi
est retail value $15,257
buy now price $4,250
VIN 1C6RR7FGXHS837808
Frequently asked questions
VIN decoders are generally accurate in providing fuel type information for 2012 FORD vehicles as this is a standard detail encoded in the VIN.
Strategies to reduce the rate of depreciation include regular maintenance, keeping mileage low, avoiding significant modifications, and keeping up with all necessary repairs.
Fire damage, if reported, is detailed with specifics on affected areas and severity, important for assessing the repair quality and safety of the 2012 FORD.
To minimize depreciation costs, consider purchasing a model known for retaining its value or opting for a slightly used vehicle that has already undergone initial depreciation.
Aftermarket modifications can affect the depreciation of 2012 FORD F-150 either positively, by enhancing appeal to certain buyers, or negatively, by deterring those who prefer stock condition.
The parts content information on a window sticker shows the percentage of vehicle components sourced from specific countries, important for consumers interested in the origin of their vehicle's parts.
You can track the depreciation of your car by monitoring market trends, checking online valuation tools, and staying informed about new model releases.
A vehicle history report may provide detailed information about a vehicle's past, including ownership, service history, and any significant incidents like accidents or theft, depending on data availability.
Discrepancies between a window sticker and actual dealer pricing can occur due to additional dealer markup, optional add-ons not included in the sticker, or regional pricing differences.
The depreciation rate can be influenced by factors such as the vehicle's condition, mileage, market demand, and the pace of technological advancements in newer models.


