BADVIN vehicle history report for
2013 FORD F-150VIN: 1FTFW1CT8DKG05978
Get FULL ACCESS to the vehicle history report and see all blurred info.
⭐ Read 206+ reviews from our customers who used BADVIN to avoid buying junk vehicles.
Historical Records
events
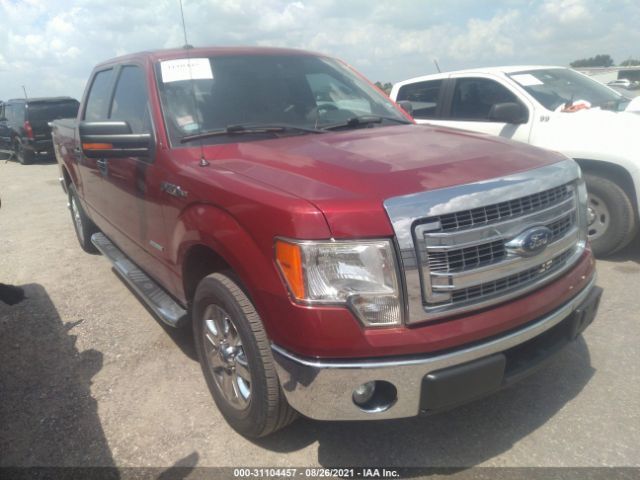
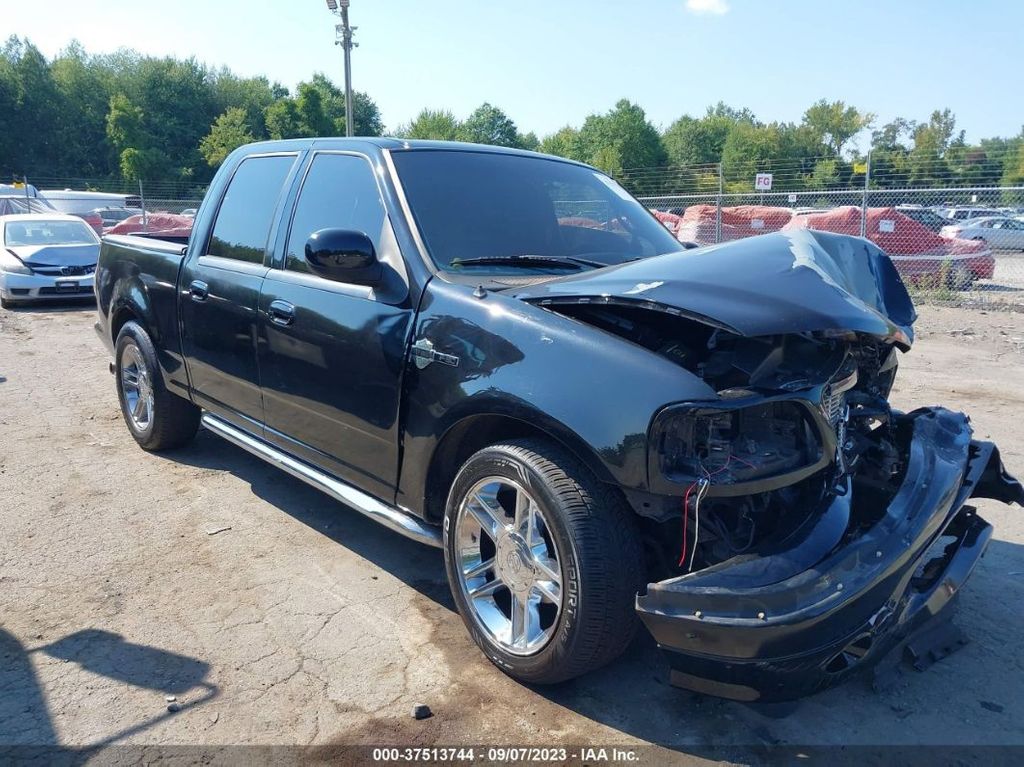
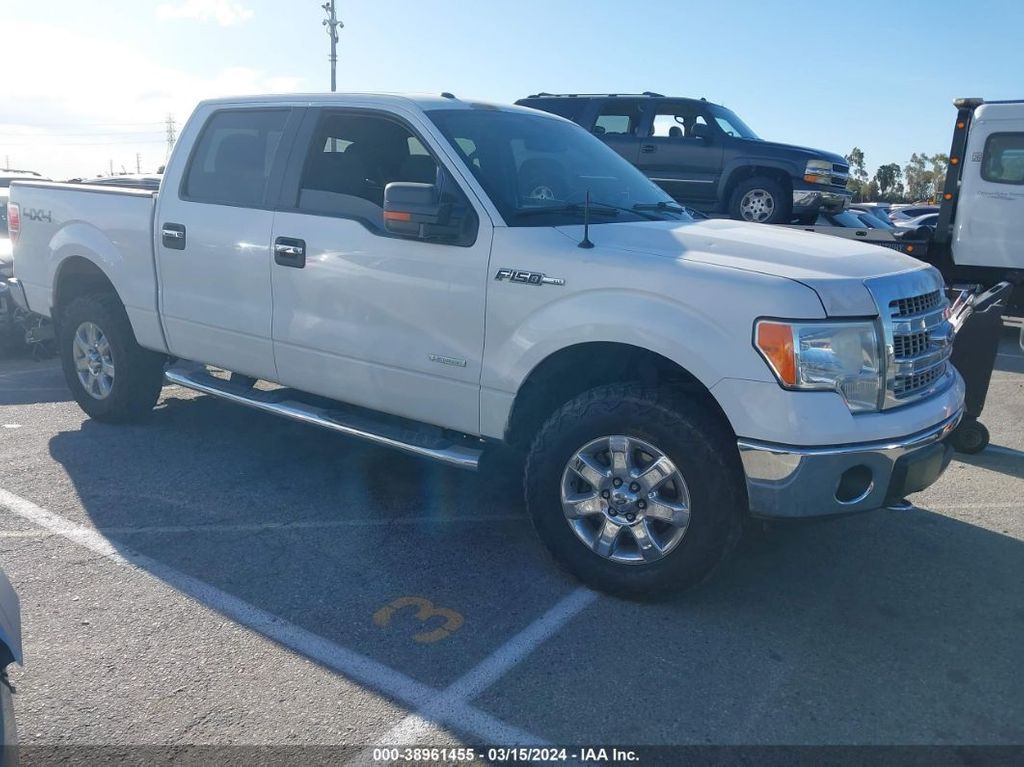
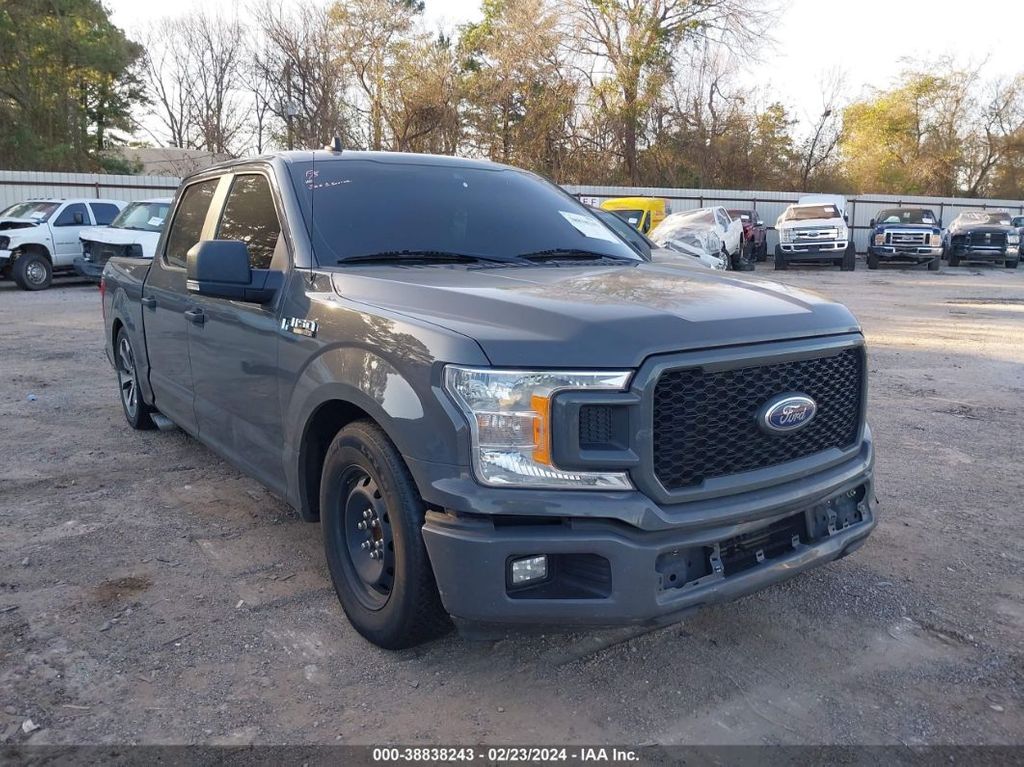
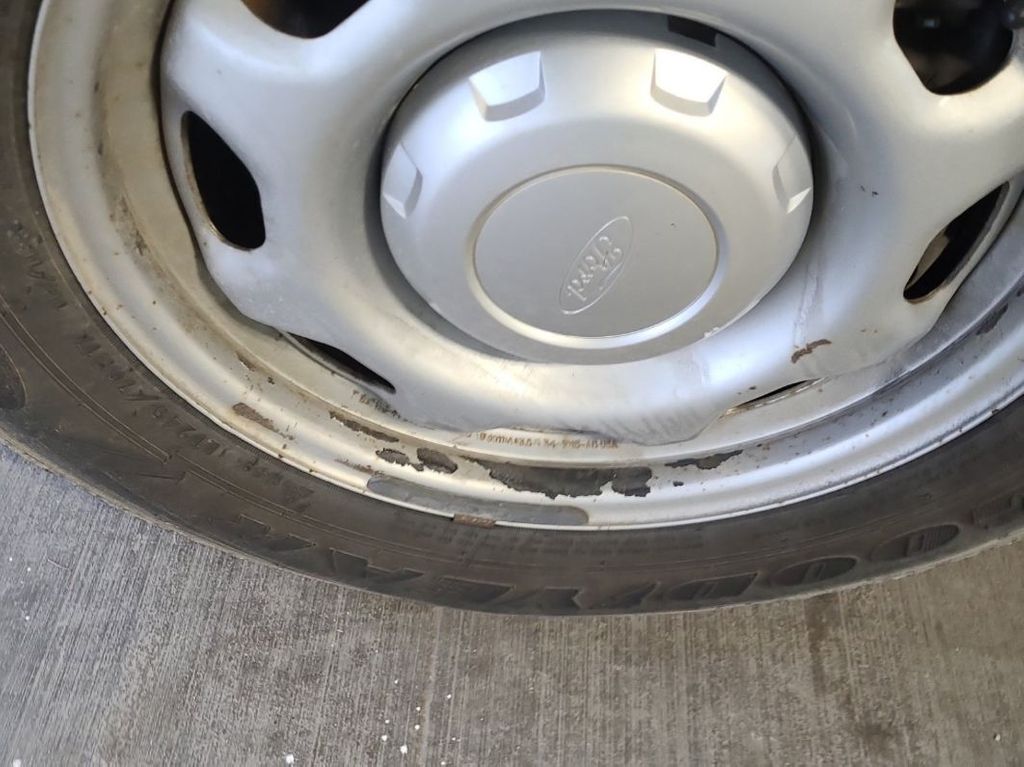
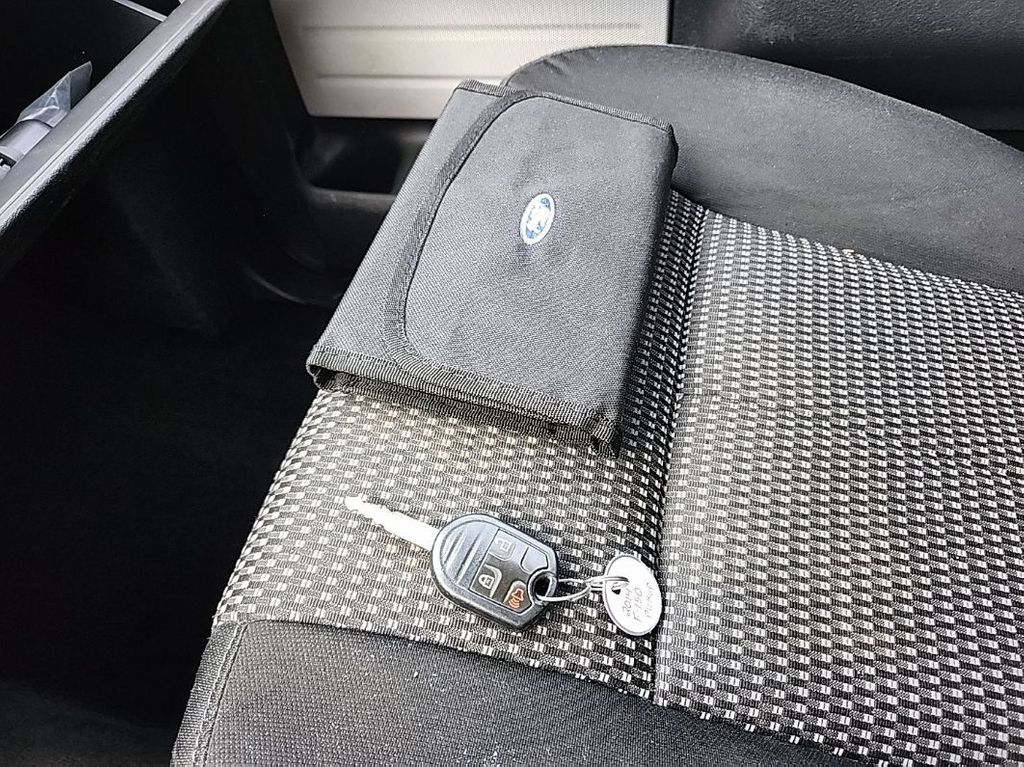
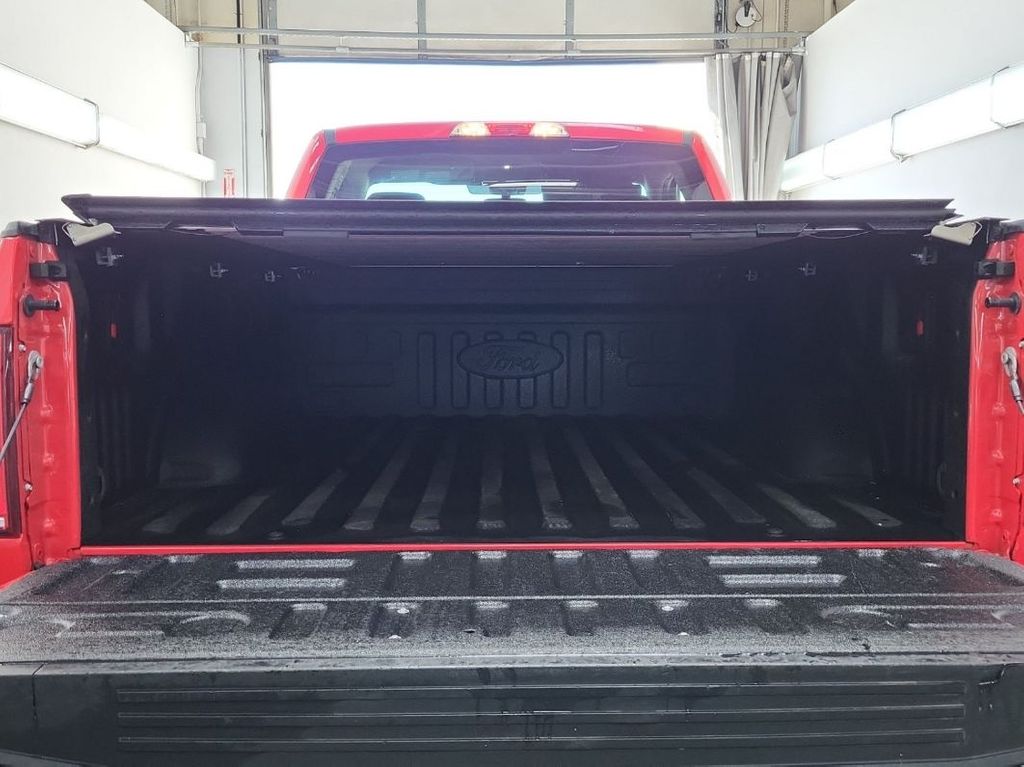
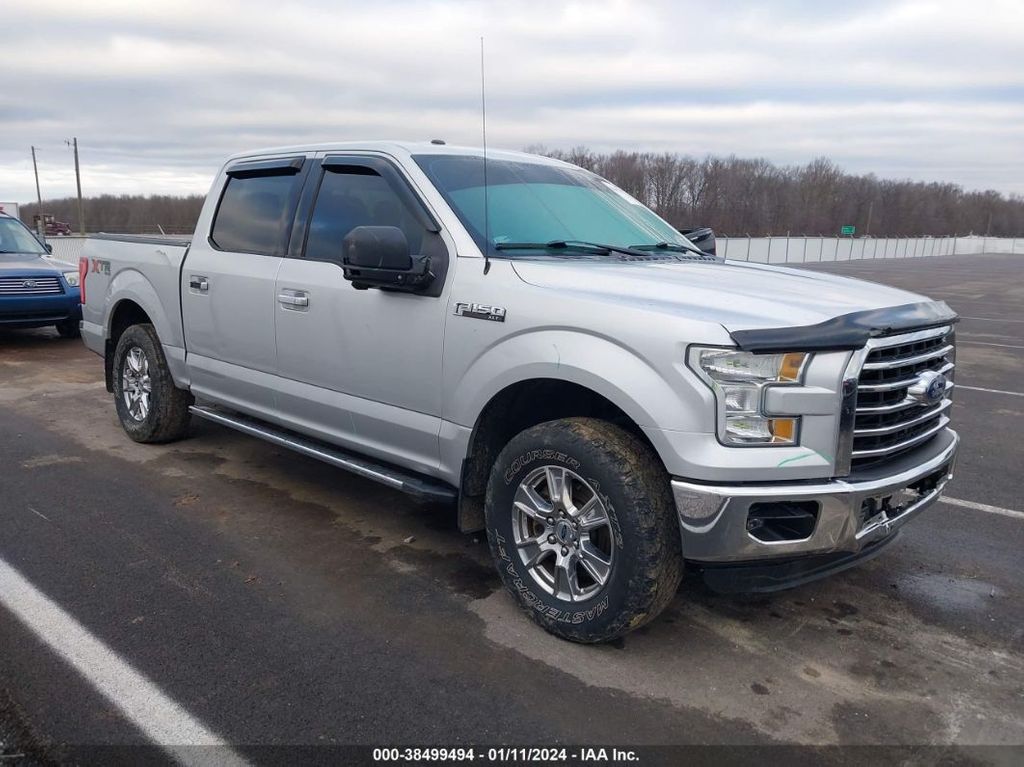
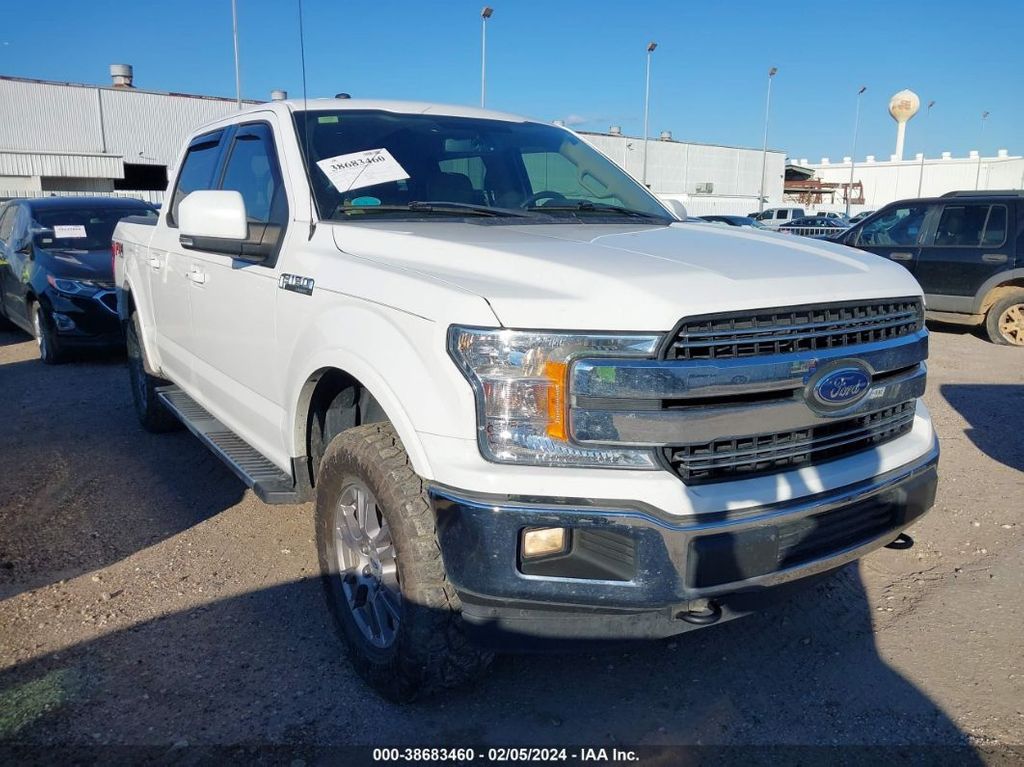
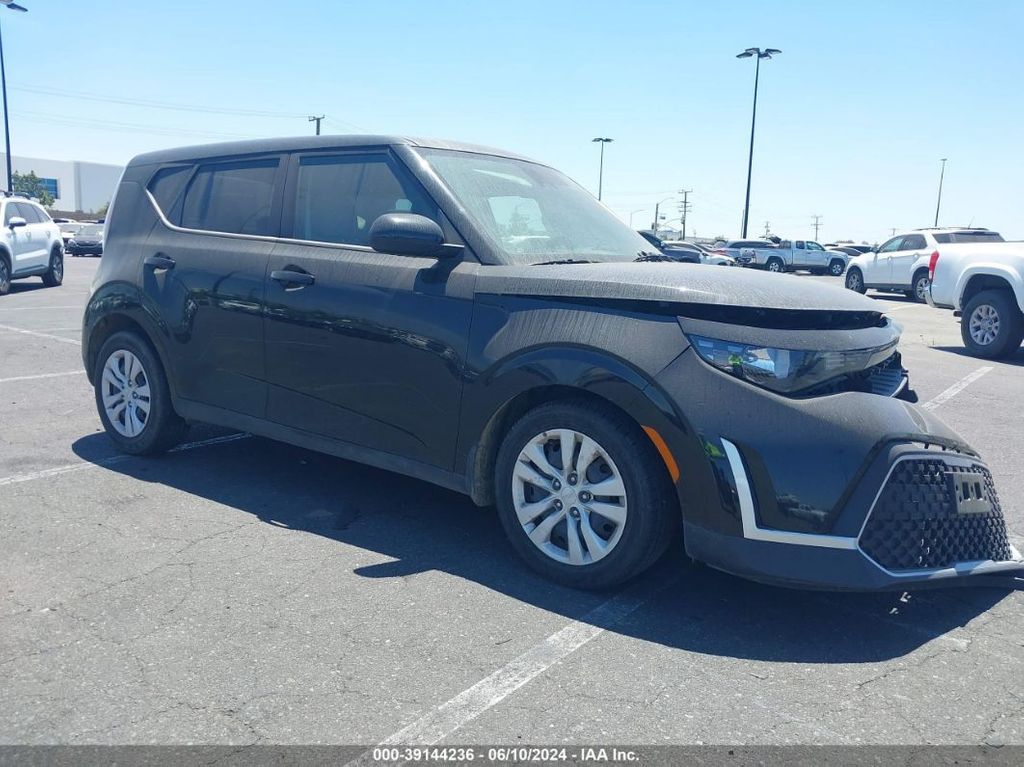
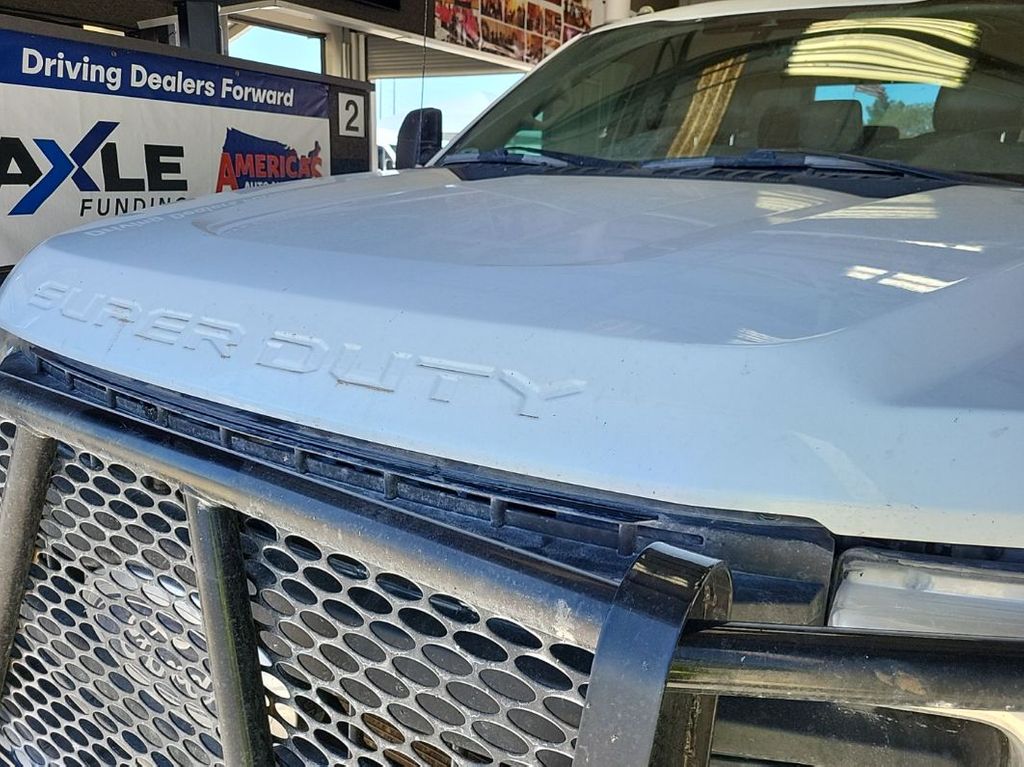
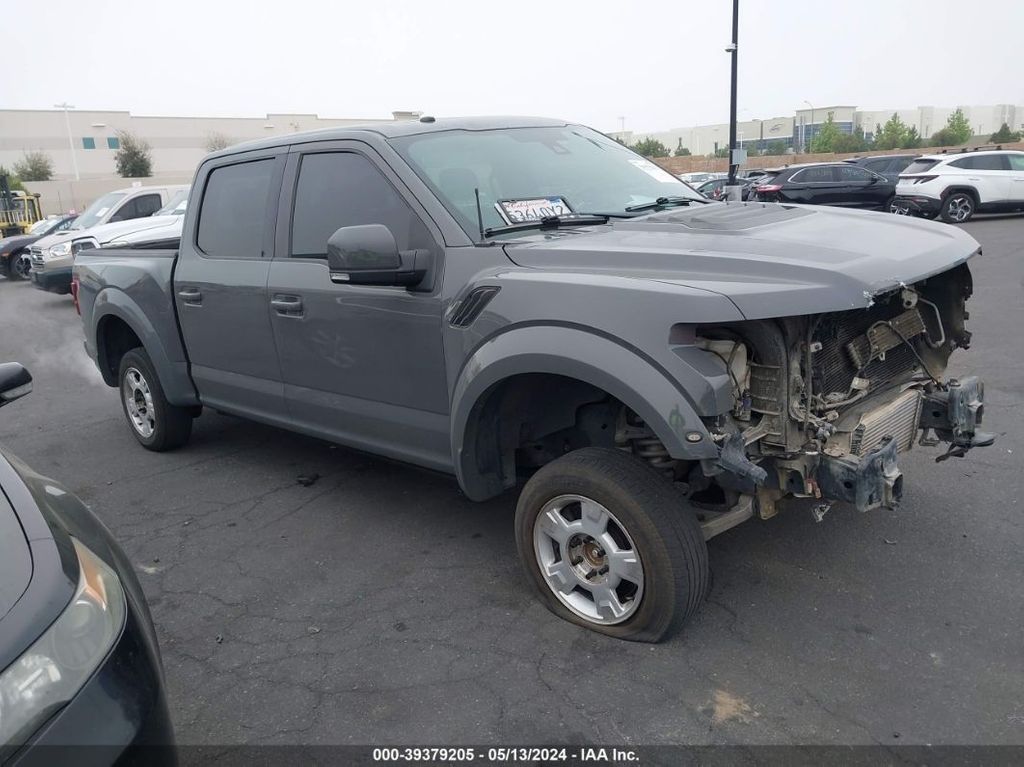
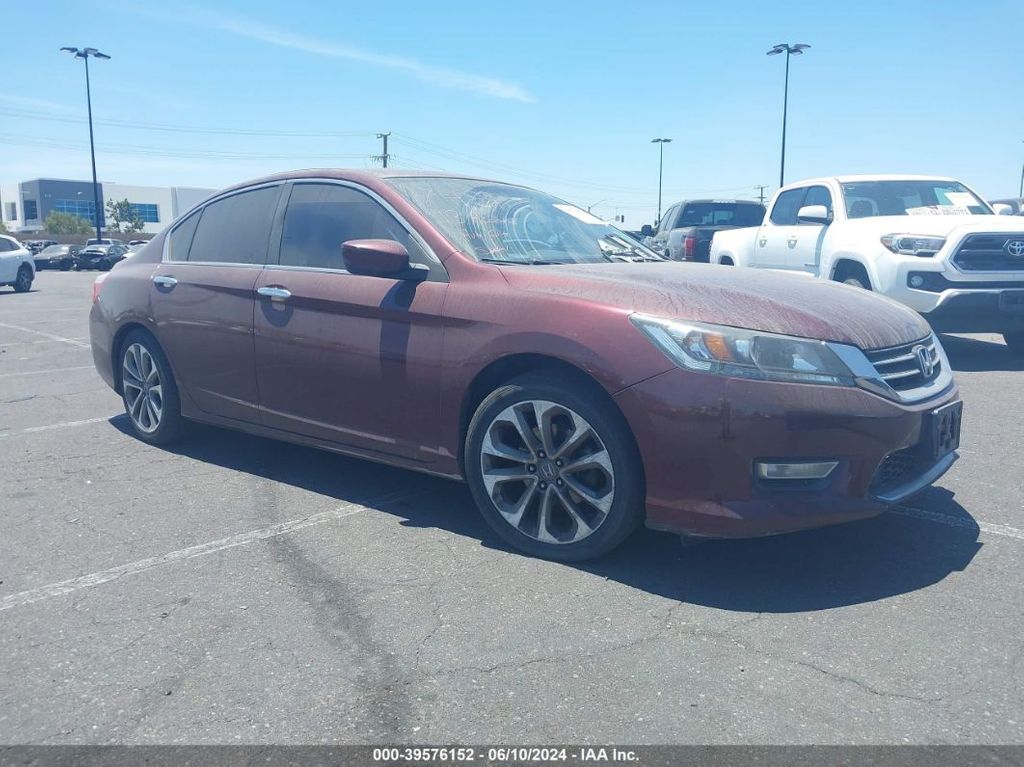
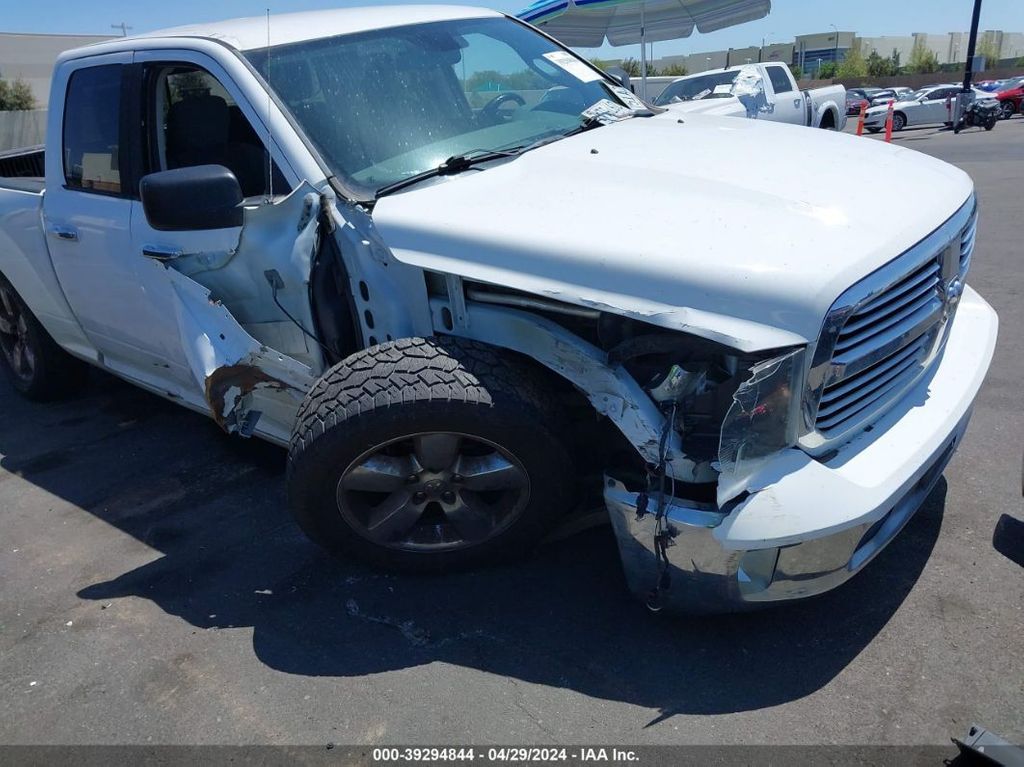
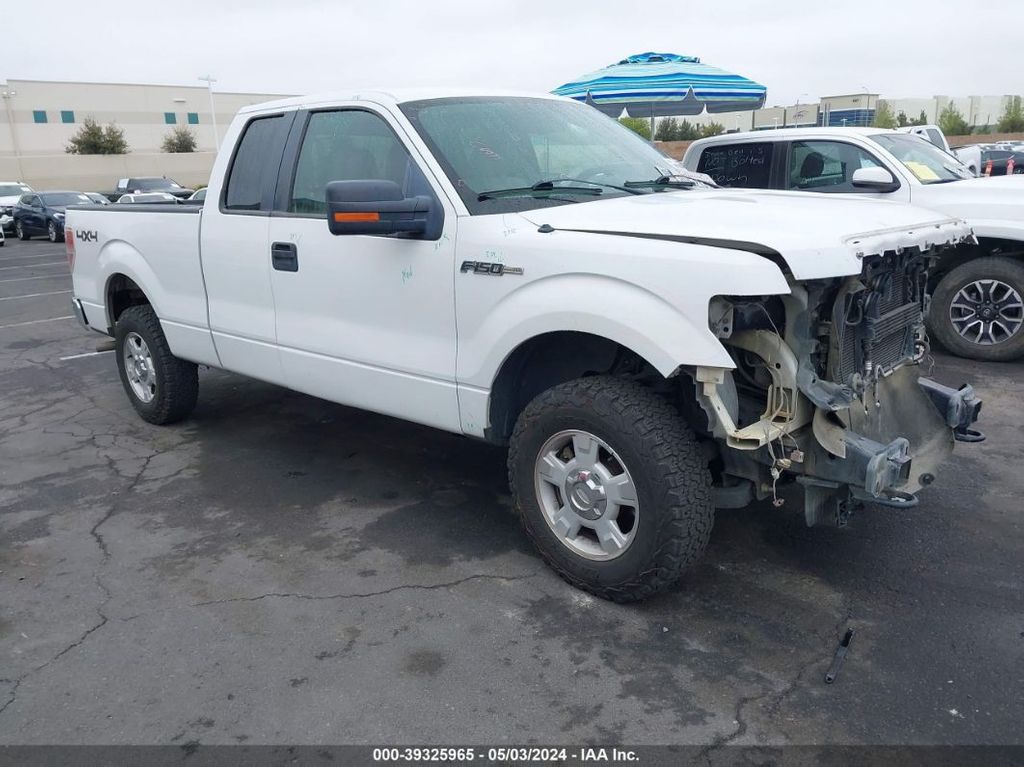
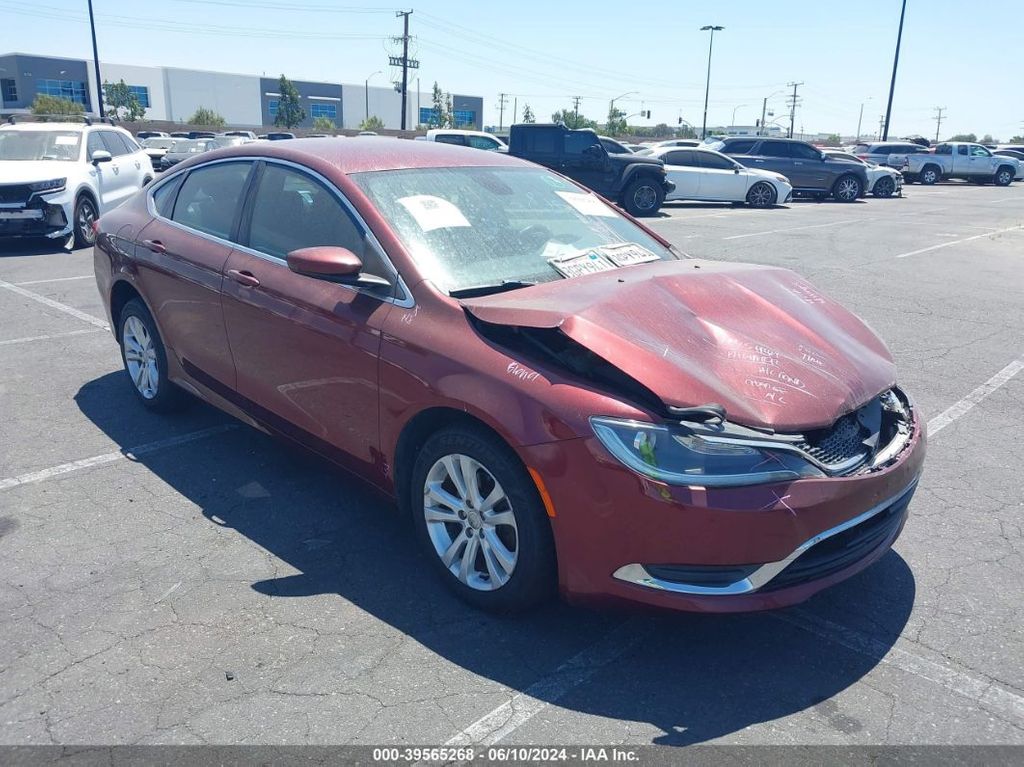
Photos
11 images
Sales History
1 records
Sale Prices
1 records
Market report
Price analytics
Historical Records
Historical records may include service and maintenance records, title status (clean, junk, salvage), insurance records, number of owners, registration events and states, and other information.
You can find more information about historical records in BADVIN reports and see more examples here.
Available historical records for VIN 1FTFW1CT8DKG05978
Latest reported mileage: 459 mi
Below you can see some examples of what these records could look like.
2022-11-16
2 years ago
120,054 mi
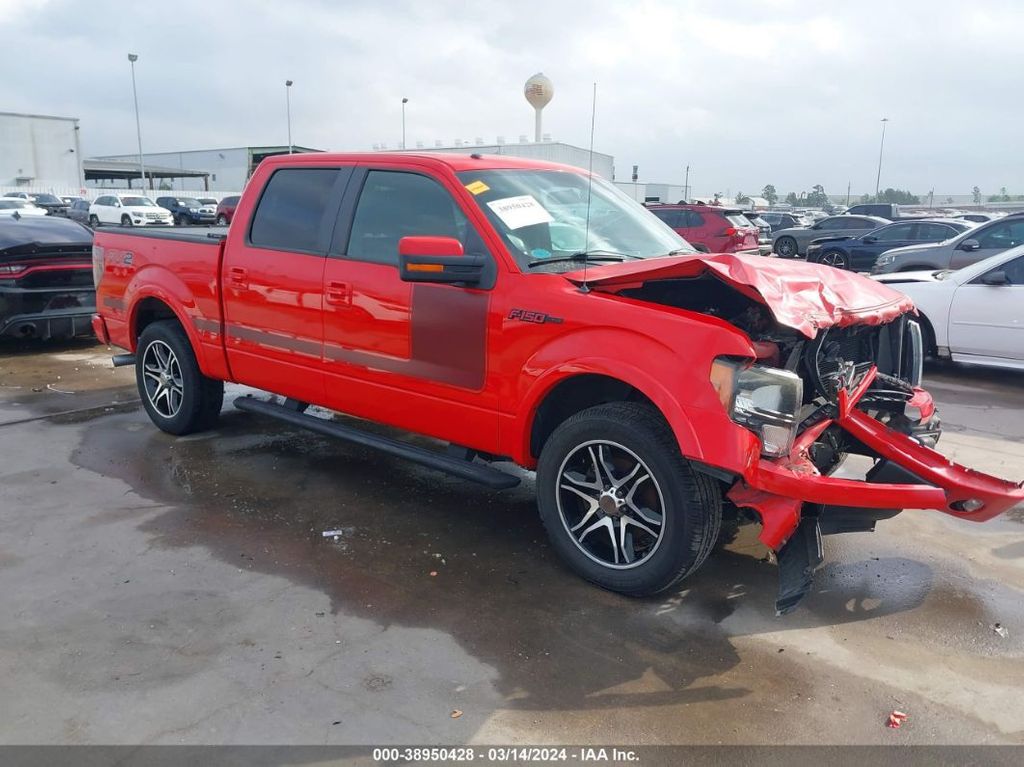
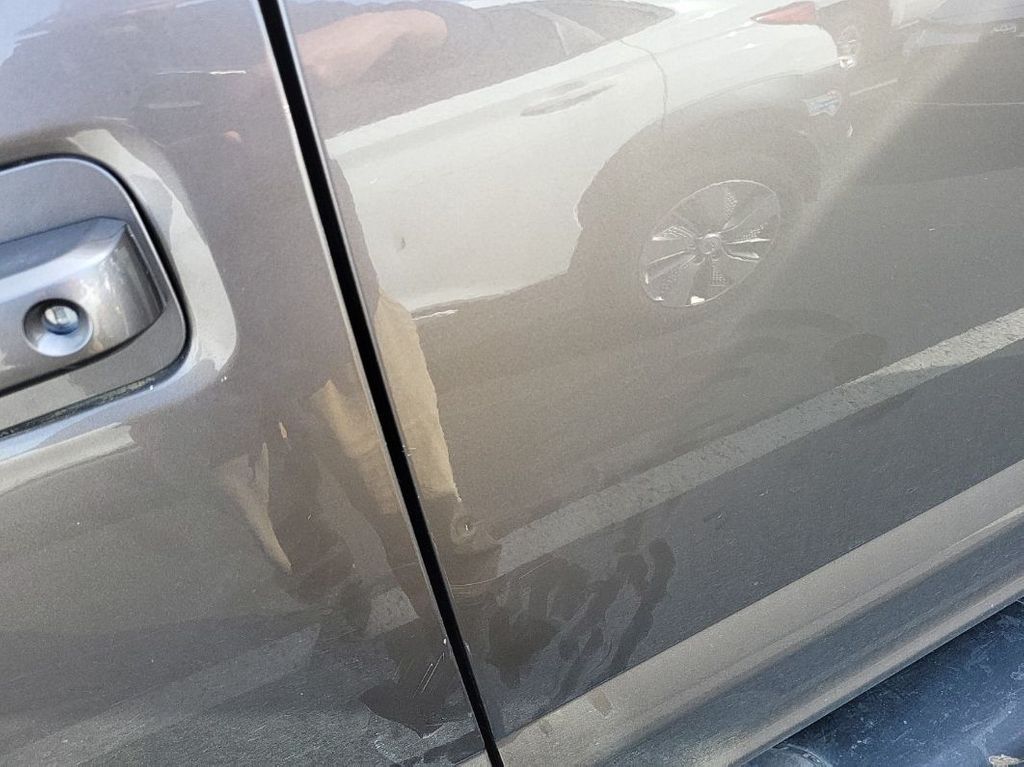
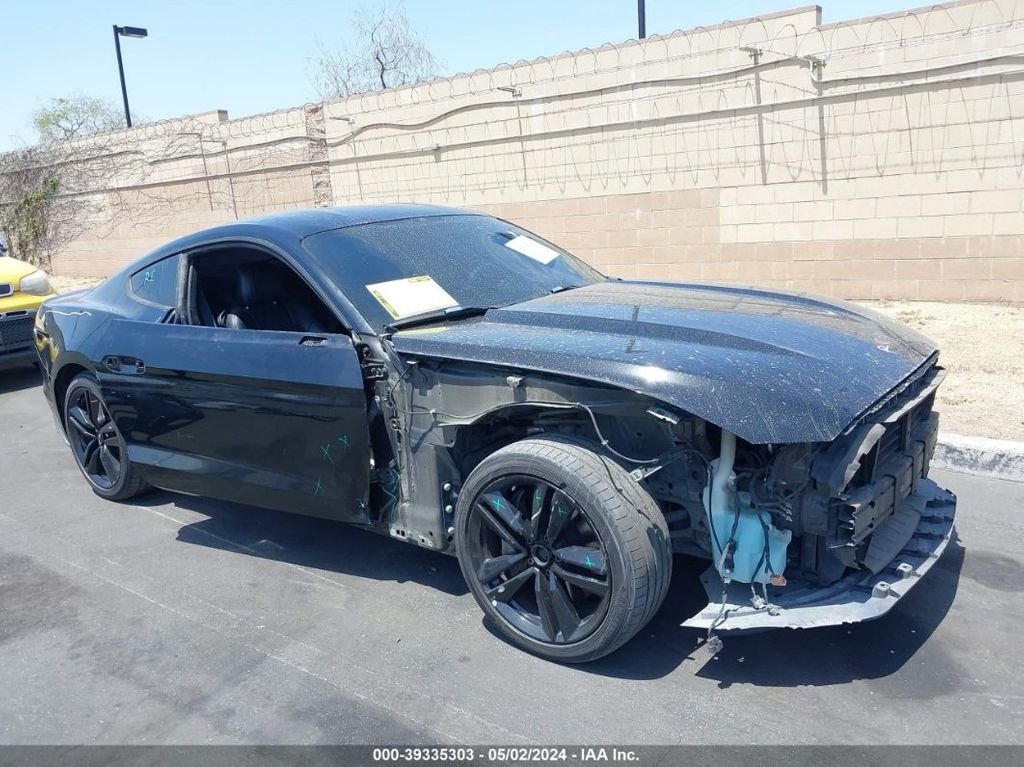
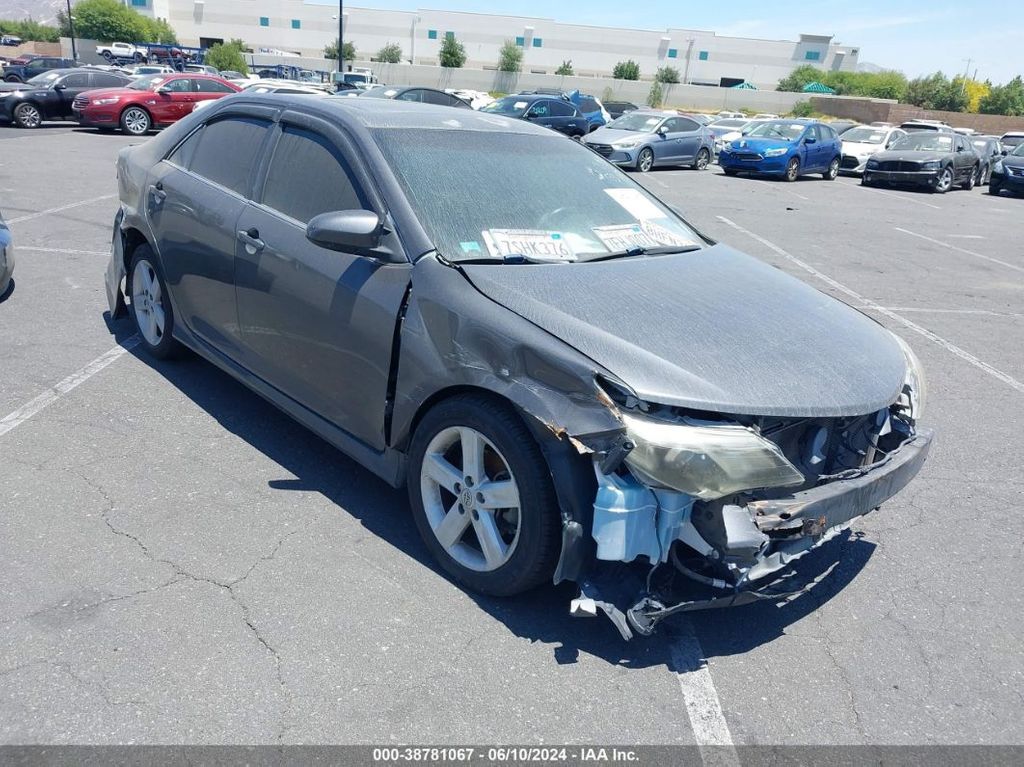
TOTAL LOSS VEHICLE
Collision damage reported
Collision damage reported
2021-09-29
3 years ago
22,559 mi
REBUILT TITLE ISSUED
2020-02-16
4 years ago
42,807 mi
SALVAGE TITLE/CERTIFICATE ISSUED
| Year | 2013 |
| Title | Hidden text |
| ODO | 9655 mi (Hidden text) |
| Loss | Hidden text |
| Damage | Hidden text |
| Estimated Retail Value | $7691 |
| Seller | Hidden text |
| Buy Now Price | $7970 |
| Location | Houston, TX, 77041 |
| Date | ended 2 years ago |
| Sale Website Type | salvage or insurance auction |
sale information provided by user #699288


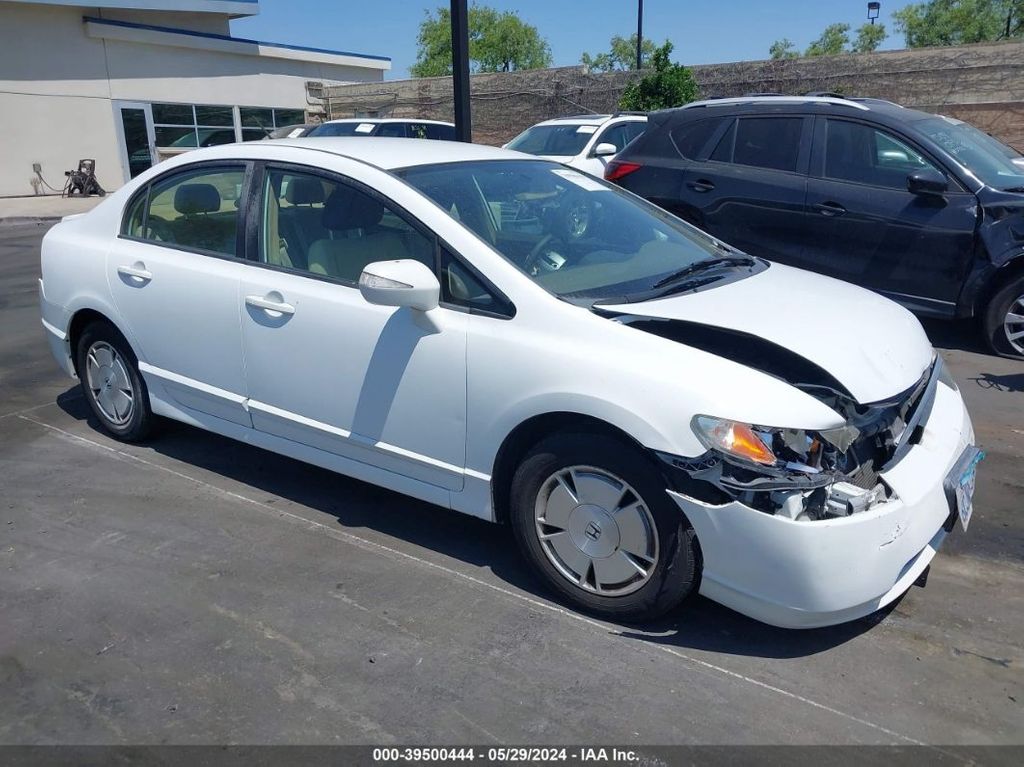
All photos above are REAL and display ACTUAL car. After you get the report you will see full resolution photos.
Tech Specs
| Engine | 3.5L V6 FI DOHC 24V NF4 |
| Cylinders | 6 Cylinders |
| Drive | Rear Wheel Drive |
| Fuel Type | Gasoline |
Model Analytics & Market Report
We've analyzed more than 278,700 sales records of this model and here are some numbers.
The average price for new (MSRP) 2013 FORD F-150 in 2013 was $50,165.
The average price for used 2013 FORD F-150 nowadays in 2024 is $17,000 which is 34% from the original price.
Estimated mileage driven per year is 9,394 miles.
For this model we also have depreciation curve, photos, list of features and options, and other analytics.
Take a look at 2013 FORD F-150 model page in BADVIN vehicles catalog.
Depreciation
The graph below is a depreciation curve for 2013 FORD F-150. It shows how much this model looses per year in price. This analytics is calculated using sales records from BADVIN database.
The table below shows average price for used 2013 FORD F-150 in each year since the year of manufacturing, current year price and projected price in the future years.
You can scroll the table horizontally to see all columns.
| Year | Average Mileage | Average Price | % Left | % Lost | ||
|---|---|---|---|---|---|---|
| 2013 MSRP | 0 mi | $50,165 | — | — | 100% | 0% |
| 2013 | 9,394 mi | $57,250 | −$7,085 | −14.12% | 114.12% | -14.12% |
| 2014 | 18,788 mi | $52,995 | +$4,255 | +7.43% | 105.64% | -5.64% |
| 2015 | 28,182 mi | $45,995 | +$7,000 | +13.21% | 91.69% | 8.31% |
| 2016 | 37,576 mi | $41,404 | +$4,591 | +9.98% | 82.54% | 17.46% |
| 2017 | 46,970 mi | $33,798 | +$7,606 | +18.37% | 67.37% | 32.63% |
| → Visit 2013 FORD F-150 depreciation page to see full data. | ||||||
Price vs Mileage
The graph below shows how mileage affects the price for 2013 FORD F-150. This data was calculated using sales records from BADVIN database.
The table below shows average price for used 2013 FORD F-150 by mileage and number of sales.
You can scroll the table horizontally to see all columns.
| Mileage | Average Price | Sample Size |
|---|---|---|
| 15,000 mi | $22,900 | 12 sales |
| 20,000 mi | $29,499 | 13 sales |
| 25,000 mi | $24,950 | 19 sales |
| 30,000 mi | $22,449 | 16 sales |
| 35,000 mi | $19,968 | 16 sales |
| 40,000 mi | $21,980 | 17 sales |
| → Visit 2013 FORD F-150 depreciation page to see full data. | ||
Get FULL ACCESS to the vehicle history report and see all blurred info.
⭐ Read 206+ reviews from our customers who used BADVIN to avoid buying junk vehicles.
Testimonials from our customers
BadVin's vehicle history report is a must-have before buying any used vehicle. It's saved me from a few lemons over the years - cars that looked great on the surface but had hidden issues like accidents or title problems. Well worth the price.

Camila Santos
verified on Trustpilot
I've tried many vehicle reports but badvin's is by far the most comprehensive. It shows accident photos, past sales, repairs and so much more. I won't buy a car now without getting a report first. It's a must-have.
Alexander Hunt
verified on Trustpilot
I always rely on badvin to check out any used car before I buy. It gives such a complete history, including past accidents, service records, recalls and much more. Feel so much more confident as a used car shopper having this info.
Sofia Garcia
verified on Trustpilot
Was shopping for a used Range Rover and found one that seemed suspiciously cheap. The badVIN report revealed it had been in a major front end collision, with photos showing the damage. Steered clear of that one and saved myself a ton of headaches!!
Ava Patel
verified on Trustpilot
Compare to other 2013 FORD F-150

2020 FORD F-150
a month ago, 80,892 mi
est retail value $27,420
buy now price $10,850
VIN 1FTEW1CP7LFA57445

2007 FORD F-150
a month ago, 190,577 mi
est retail value $8,306
buy now price $2,000
VIN 1FTPW12V97KD55260
2018 FORD F-150
a month ago, 84,125 mi
est retail value $30,339
buy now price $16,575
VIN 1FTEW1E58JFB62844
Other vehicles sales records

Frequently asked questions
Yes, the window sticker includes environmental ratings such as greenhouse gas scores and smog ratings, which reflect the vehicle's environmental impact.
Our reports might include a service history, from oil changes to major overhauls, which can help you gauge the upkeep and condition of the 2013 FORD F-150, depending on the records available.
Safety ratings on the Monroney label include crash test results from agencies like the NHTSA and IIHS, providing an assessment of the vehicle's safety.
While a VIN decoder generally does not provide dealership information, it can tell you the region where the vehicle was originally sold.
The economic climate can significantly affect the depreciation of vehicles, with higher demand and better economic conditions typically slowing depreciation rates.
Stolen or repossessed status, if recorded, can affect the 2013 FORD vehicle’s legal and financial status, impacting its marketability and insurability.
A CPO vehicle offers the reliability of a new car at a lower price, backed by a comprehensive warranty, making it a great option for those seeking value and peace of mind.
Technology plays a significant role in the depreciation of vehicles, as models with outdated tech depreciate faster due to lower consumer demand for older features.


