
BADVIN vehicle history report for
2017 FORD F-150VIN: 1FTEX1C81HKE23873
Get FULL ACCESS to the vehicle history report and see all blurred info.
⭐ Read 206+ reviews from our customers who used BADVIN to avoid buying junk vehicles.
Historical Records
events
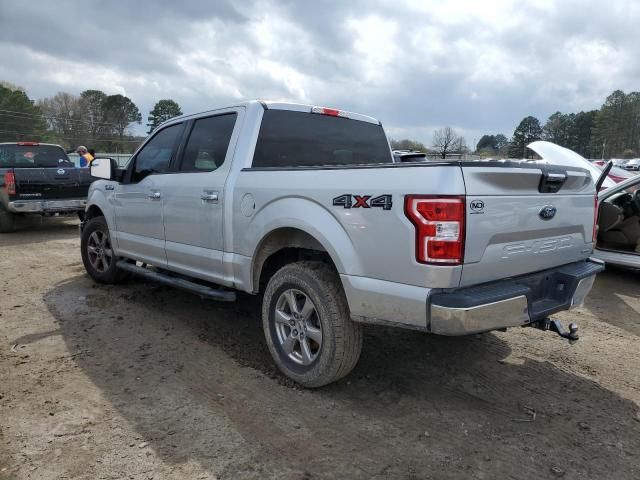
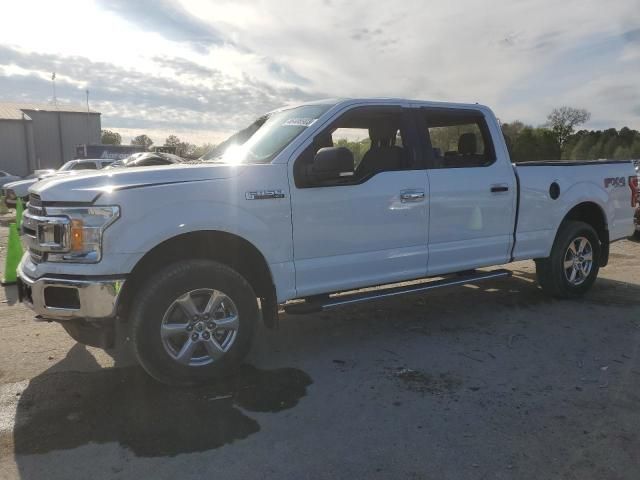
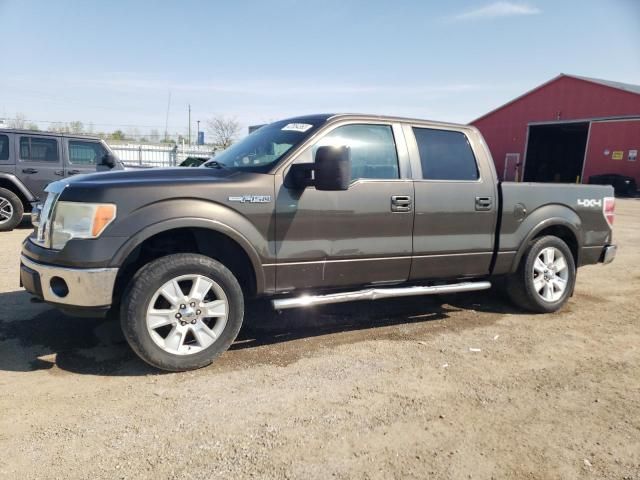
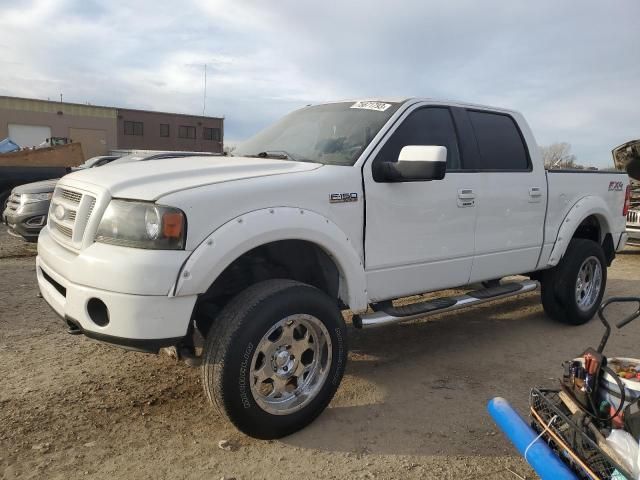
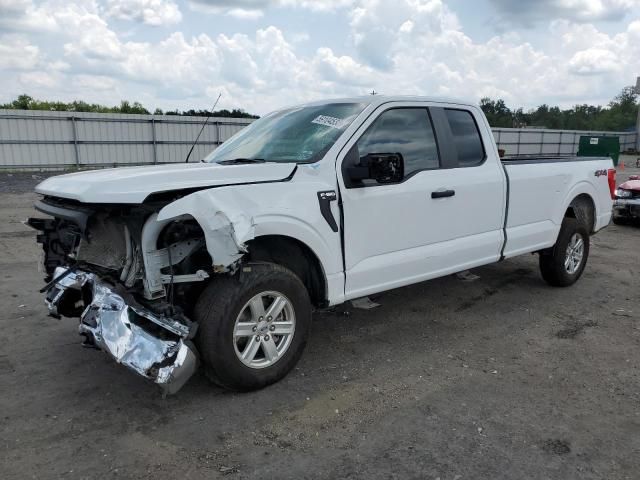
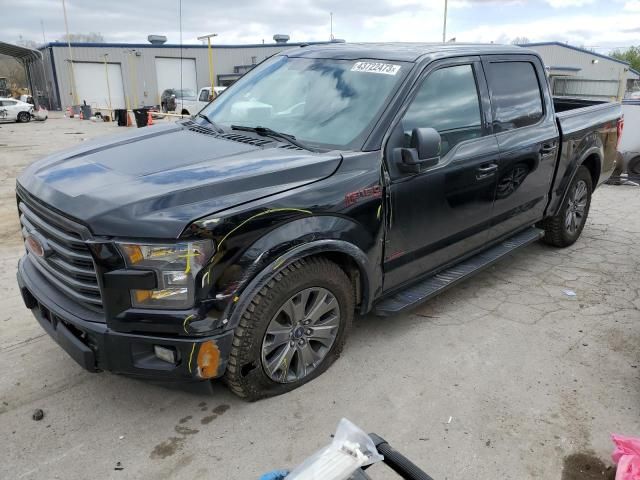
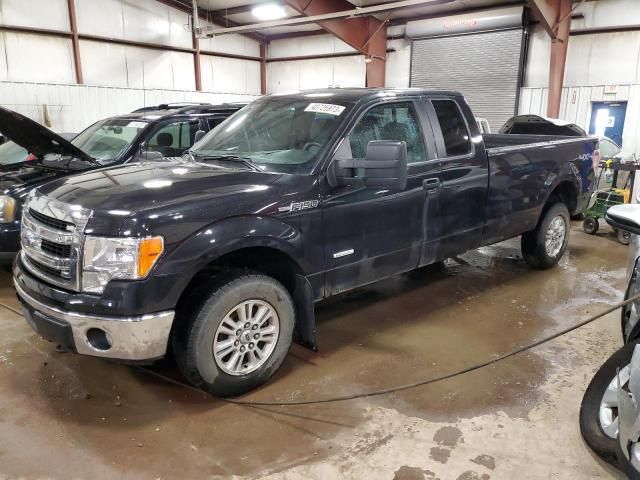
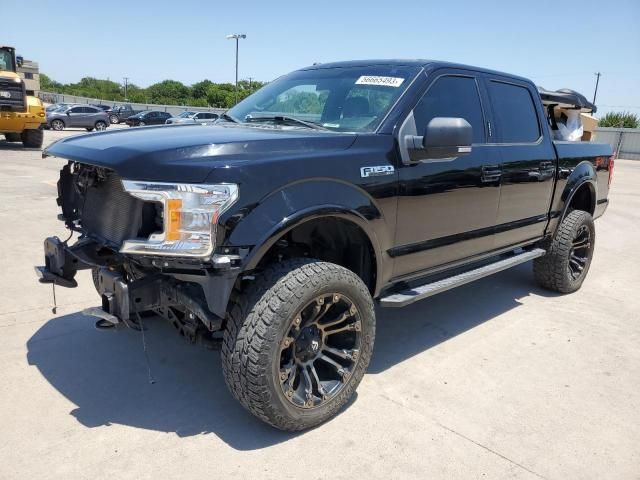
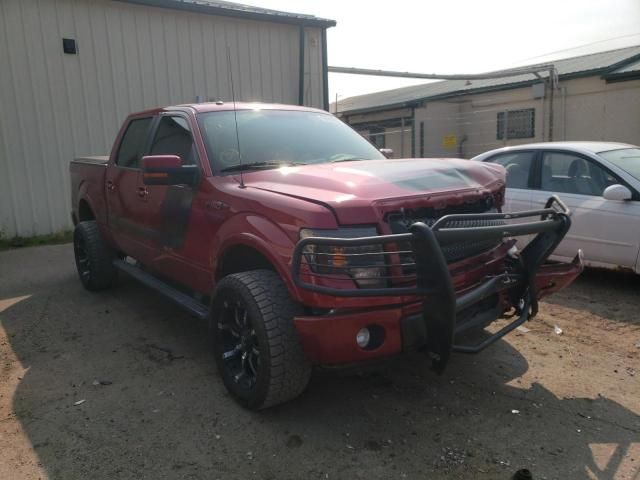
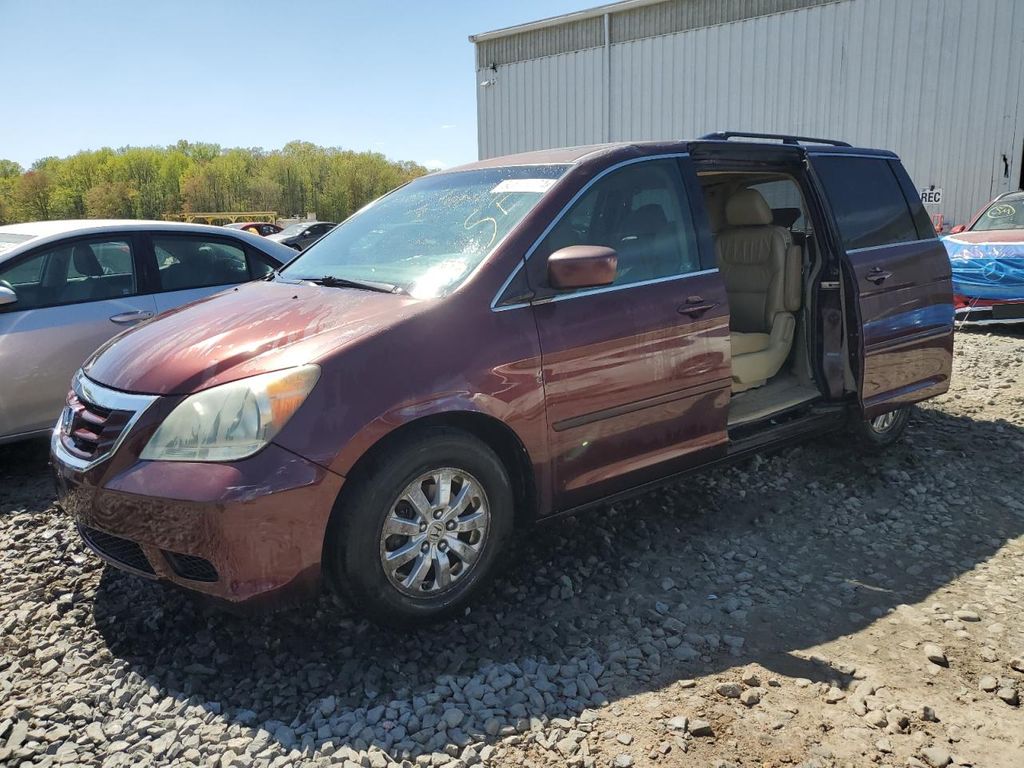
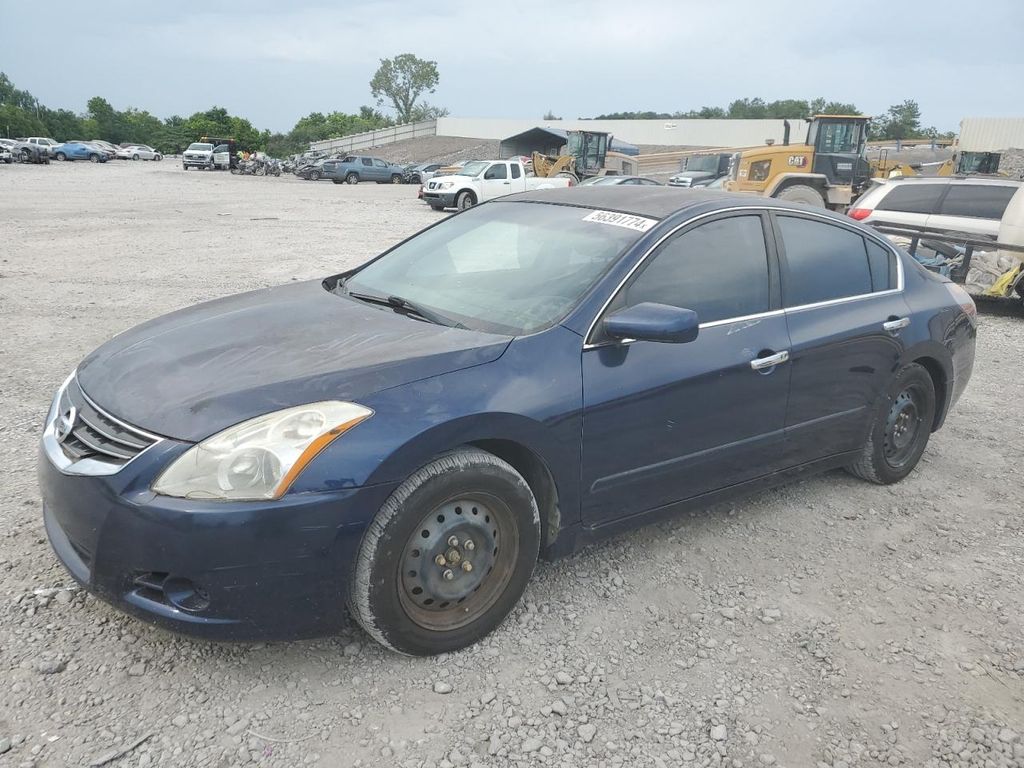
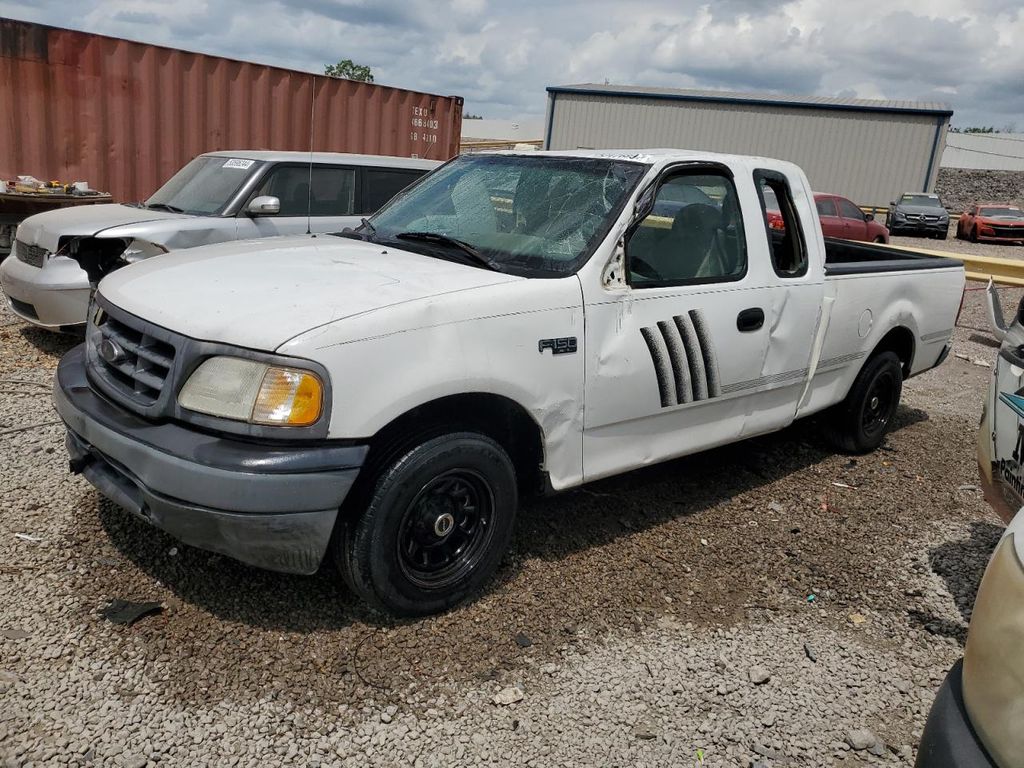
Photos
10 images
Sales History
1 records
Sale Prices
1 records
Market report
Price analytics
Historical Records
Historical records may include service and maintenance records, title status (clean, junk, salvage), insurance records, number of owners, registration events and states, and other information.
You can find more information about historical records in BADVIN reports and see more examples here.
Available historical records for VIN 1FTEX1C81HKE23873
Latest reported mileage: 433 mi
Below you can see some examples of what these records could look like.
2023-11-26
7 months ago
90,131 mi
Vehicle serviced
Outer tie rod(s) replaced
Alignment performed
Outer tie rod(s) replaced
Alignment performed
2021-10-30
3 years ago
11,414 mi
Duplicate title issued
REBUILT TITLE ISSUED
REBUILT TITLE ISSUED
2021-08-30
3 years ago
28,898 mi
Vehicle sold
MILEAGE INCONSISTENCY
MILEAGE INCONSISTENCY
Sale Record
2017 FORD F150 SUPER CAB
sold
| Year | 2017 |
| ODO | — |
| Location | Memphis, TN, 38114 |
| Date | ended 2 years ago |
| Sale Website Type | salvage or insurance auction |
sale information provided by user #449846


All photos above are REAL and display ACTUAL car. After you get the report you will see full resolution photos.
Tech Specs
Model Analytics & Market Report
We've analyzed more than 349,700 sales records of this model and here are some numbers.
The average price for new (MSRP) 2017 FORD F-150 in 2017 was $50,165.
The average price for used 2017 FORD F-150 nowadays in 2024 is $26,990 which is 54% from the original price.
Estimated mileage driven per year is 9,394 miles.
For this model we also have depreciation curve, photos, list of features and options, and other analytics.
Take a look at 2017 FORD F-150 model page in BADVIN vehicles catalog.
Depreciation
The graph below is a depreciation curve for 2017 FORD F-150. It shows how much this model looses per year in price. This analytics is calculated using sales records from BADVIN database.
The table below shows average price for used 2017 FORD F-150 in each year since the year of manufacturing, current year price and projected price in the future years.
You can scroll the table horizontally to see all columns.
| Year | Average Mileage | Average Price | % Left | % Lost | ||
|---|---|---|---|---|---|---|
| 2017 MSRP | 0 mi | $50,165 | — | — | 100% | 0% |
| 2017 | 9,394 mi | $57,250 | −$7,085 | −14.12% | 114.12% | -14.12% |
| 2018 | 18,788 mi | $52,995 | +$4,255 | +7.43% | 105.64% | -5.64% |
| 2019 | 28,182 mi | $45,995 | +$7,000 | +13.21% | 91.69% | 8.31% |
| 2020 | 37,576 mi | $41,404 | +$4,591 | +9.98% | 82.54% | 17.46% |
| 2021 | 46,970 mi | $33,798 | +$7,606 | +18.37% | 67.37% | 32.63% |
| → Visit 2017 FORD F-150 depreciation page to see full data. | ||||||
Price vs Mileage
The graph below shows how mileage affects the price for 2017 FORD F-150. This data was calculated using sales records from BADVIN database.
The table below shows average price for used 2017 FORD F-150 by mileage and number of sales.
You can scroll the table horizontally to see all columns.
| Mileage | Average Price | Sample Size |
|---|---|---|
| 10,000 mi | $41,923 | 10 sales |
| 20,000 mi | $34,995 | 33 sales |
| 25,000 mi | $34,000 | 37 sales |
| 30,000 mi | $30,000 | 50 sales |
| 35,000 mi | $32,300 | 73 sales |
| 40,000 mi | $32,278 | 88 sales |
| → Visit 2017 FORD F-150 depreciation page to see full data. | ||
Get FULL ACCESS to the vehicle history report and see all blurred info.
⭐ Read 206+ reviews from our customers who used BADVIN to avoid buying junk vehicles.
Testimonials from our customers
I almost bought a 2019 Malibu that seemed like a great deal - low miles and price. But the badvin report showed it used to be a rental fleet vehicle, which the seller didn't disclose. Glad I found out before buying someone else's abused rental!

Benjamin Torres
verified on Trustpilot
As a used car dealer, I rely on badvin.org for checking every vehicle I'm considering purchasing at auction. The comprehensive reports give me peace of mind and help me avoid problem cars. Photos of past sales have saved me from overpaying many times. Worth every penny!
Misha
verified on Trustpilot
BadVin's vehicle history report is a must-have before buying any used vehicle. It's saved me from a few lemons over the years - cars that looked great on the surface but had hidden issues like accidents or title problems. Well worth the price.
Camila Santos
verified on Trustpilot
Ich hätte fast einen 2017 Mercedes-Benz C300 gekauft, bis der Bad Vin-Bericht zeigte, dass er als durch Überschwemmung beschädigt gemeldet wurde. Die detaillierten Schadensaufzeichnungen haben mich vor einem großen Fehler bewahrt!
Sophia Müller
verified on Trustpilot
Compare to other 2017 FORD F-150
2018 FORD F-150
a month ago, 90,356 mi
est retail value $29,188
buy now price $8,500
VIN 1FTEW1EP5JFB37949
2009 FORD F-150
a month ago, 237,915 mi
est retail value $10,832
buy now price $800
VIN 1FTPW14VX9FA53761
2007 FORD F-150
in 10 days, 119,265 mi
est retail value $13,850
buy now price $5,800
VIN 1FTPW14V77KD22142

2014 FORD F-150
a month ago, 215,622 mi
est retail value $13,103
buy now price $2,900
VIN 1FTEX1CM9EFC59953
2017 FORD F-150
a month ago, 106,631 mi
est retail value $32,446
buy now price $9,900
VIN 1FTEW1EG7HFB99105
2014 FORD F-150
in 4 days, 53,653 mi
est retail value $20,812
buy now price $7,300
VIN 1FTVX1ET5EKD73136


2014 FORD F-150
a month ago, 124,203 mi
est retail value $18,334
buy now price $4,000
VIN 1FTFW1CT5EFB25908
Other vehicles sales records

2001 FORD F-150
in 15 hours, 281,199 mi
est retail value $3,664
buy now price $600
VIN 1FTZX17201NB38495
2006 NISSAN MAXIMA
in 15 hours, 257,517 mi
est retail value $4,386
buy now price $400
VIN 1N4BA41E56C830896

2022 HYUNDAI SANTA CRUZ
a month ago, 58,917 mi
est retail value $29,698
buy now price $12,500
VIN 5NTJBDAE5NH025391

2003 TOYOTA TACOMA
in 15 hours, 299,430 mi
est retail value $7,952
buy now price $1,775
VIN 5TEGN92N83Z292479
Frequently asked questions
Frame damage can indicate severe impacts and is critical to the structural integrity and safety of the 2017 FORD vehicle, if such damage is documented.
Safety recall reports, if available, detail the nature of the defect, risk severity, and recommended actions, ensuring the safety and reliability of the 2017 FORD vehicle.
Total loss is usually determined when the cost of repairing the vehicle exceeds a certain percentage of its value before the damage occurred, as decided by the insurance company, if such data is recorded.
Mileage verification may confirm the 2017 FORD F-150's odometer reading, helping to check for fraud or tampering which can affect its value and performance, if data is accurate and complete.
Depreciation directly affects the resale value of a 2017 FORD F-150, with faster depreciating vehicles typically having lower resale values over time.
Leasing history, if included, may detail the duration and terms under which the 2017 FORD F-150 was leased, which can influence its maintenance and condition, depending on the data provided.
A hazardous label, if applied, indicates significant safety risks, potentially from accidents or chemical exposure, critical for the safety evaluation of the 2017 FORD.


