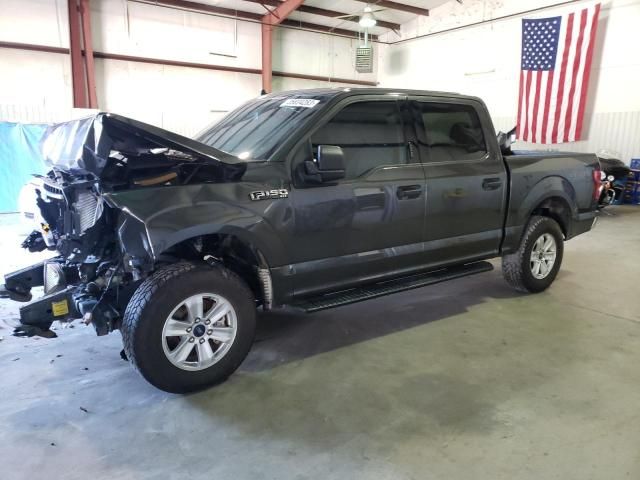
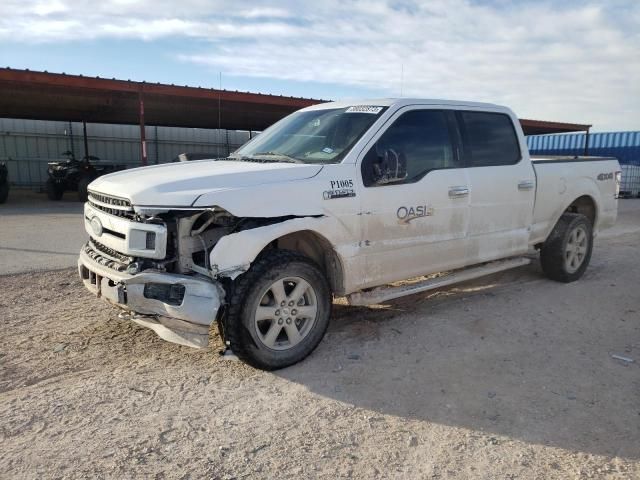
2019 FORD F-150VIN: 1FTEW1E54KFB18518
Historical Records
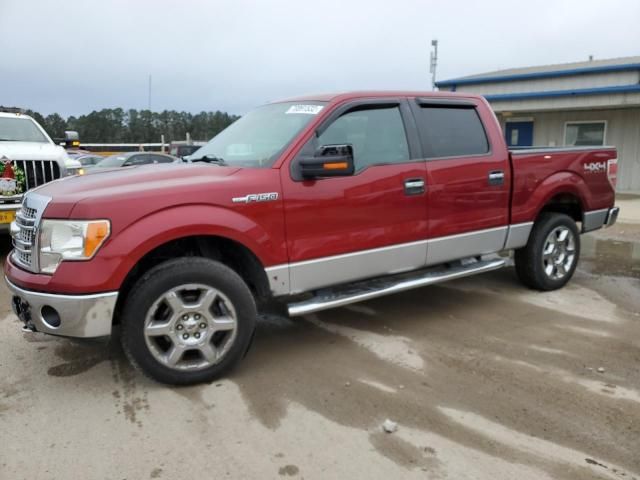
Collision damage reported
Damage to right rear
Damage to rear
REBUILT TITLE ISSUED
| Year | 2019 |
| Title | Hidden text (Hidden text) |
| ODO | 2464 mi (Hidden text) |
| Damage | Hidden text, Hidden text |
| Estimated Retail Value | $8872 |
| Estimated Repair Cost | $3354 (159%) |
| Seller | Hidden text |
| Location | Mobile, AL, 36695 |
| Date | ended a year ago |
| Sale Website Type | salvage or insurance auction |


| Color | WHITE |
| Transmission | AUTOMATIC |
| Engine | 5.0L 8 |
| Drive | 4x4 w/Rear Wheel Drv |
| Fuel Type | GAS |
Model Analytics & Market Report
Depreciation
| Year | Average Mileage | Average Price | % Left | % Lost | ||
|---|---|---|---|---|---|---|
| 2019 MSRP | 0 mi | $50,165 | — | — | 100% | 0% |
| 2019 | 9,394 mi | $57,250 | −$7,085 | −14.12% | 114.12% | -14.12% |
| 2020 | 18,788 mi | $52,995 | +$4,255 | +7.43% | 105.64% | -5.64% |
| 2021 | 28,182 mi | $45,995 | +$7,000 | +13.21% | 91.69% | 8.31% |
| 2022 | 37,576 mi | $41,404 | +$4,591 | +9.98% | 82.54% | 17.46% |
| 2023 | 46,970 mi | $33,798 | +$7,606 | +18.37% | 67.37% | 32.63% |
| → Visit 2019 FORD F-150 depreciation page to see full data. | ||||||
Price vs Mileage
| Mileage | Average Price | Sample Size |
|---|---|---|
| 5,000 mi | $39,968 | 12 sales |
| 10,000 mi | $37,998 | 17 sales |
| 15,000 mi | $43,500 | 45 sales |
| 20,000 mi | $35,688 | 72 sales |
| 25,000 mi | $38,985 | 88 sales |
| 30,000 mi | $35,692 | 152 sales |
| → Visit 2019 FORD F-150 depreciation page to see full data. | ||
VIN Decoder — 56 records
Anti-lock Braking System (ABS) means a portion of a service brake system that automatically controls the degree of rotational wheel slip during braking by: (1) Sensing the rate of angular rotation of the wheels; (2) Transmitting signals regarding the rate of wheel angular rotation to one or more controlling devices that interpret those signals and generate responsive controlling output signals; and (3) Transmitting those controlling signals to one or more modulator devices that adjust brake actuating forces in response to those signals.
An auto-reverse system enables power windows and sunroofs on motor vehicles to automatically reverse direction when such power windows and panels detect an obstruction. This feature can prevent children and others from being trapped, injured, or killed by the power windows and sunroofs.
ESC is a computerized technology that improves a vehicle's stability by detecting and reducing loss of traction (skidding). When ESC detects loss of steering control, it automatically applies the brakes to help steer the vehicle in the driver's intended direction. Braking is automatically applied to wheels individually, such as the outer front wheel to counter oversteer, or the inner rear wheel to counter understeer. Some ESC systems also reduce engine power until control is regained.
A TPMS is an electronic system designed to monitor the air pressure inside the pneumatic tires on various types of vehicles. TPMS can be divided into two different types - direct and indirect. Direct TPMS employ pressure sensors on each wheel, either internal or external. The sensors physically measure the tire pressure in each tire and report it to the vehicle's instrument cluster or a corresponding monitor. Indirect TPMS does not use physical pressure sensors but measure air pressures by monitoring individual wheel rotational speeds and other signals available outside of the tire itself.
When the traction control computer detects a driven wheel or wheels spinning significantly faster than another, it invokes an electronic control unit to apply brake friction to wheels spinning due to loss of traction. This braking action on slipping wheels will cause power transfer to the wheels with traction due to the mechanical action within the differential.
A backup camera, also known as a rearview video system, helps prevent back-over crashes and protects our most vulnerable people - children and senior citizens - by providing an image of the area behind the vehicle. A backup camera helps the driver see behind the vehicle while in reverse.
A CIB system is an automatic emergency braking system designed to detect an impending forward crash with another vehicle. CIB systems automatically apply the brakes in a crash imminent situation to slow or stop the vehicle, avoiding the crash or reducing its severity, if the driver does not brake in response to a forward collision alert.
A DBS system is an automatic emergency braking system designed to detect an impending forward crash with another vehicle. DBS systems automatically supplement the driver's braking in an effort to avoid a crash if the driver does not brake hard enough to avoid it.
An FCW system monitors a vehicle's speed, the speed of the vehicle in front of it, and the distance between the vehicles. If the vehicles get too close due to the speed of either vehicle, the FCW system will warn the driver of the rear vehicle of an impending crash so that the driver can apply the brakes or take evasive action, such as steering, to prevent a potential crash. FCW systems provide an audible, visual, or haptic warning, or any combination thereof, to alert the driver of an FCW-equipped vehicle of a potential collision.
An LDW system monitors lane markings and alerts the driver if their vehicle drifts out of their lane without a turn signal or any control input indicating the lane departure is intentional. An audio, visual or other alert warns the driver of the unintentional lane shift so the driver can steer the vehicle back into its lane.
An LKA system prevents a driver from unintentionally drifting out of the intended travel lane. LKA systems use information provided by Lane Departure Warning (LDW) system sensors to determine whether a vehicle is about to unintentionally move out of its lane of travel. If so, LKA activates and corrects the steering, brakes or accelerates one or more wheels, or does both, resulting in the vehicle returning to its intended lane of travel.
ADB is a type of front-lighting system that lets upper beam headlamps adapt their beam patterns to create shaded areas around oncoming and preceding vehicles to improve long-range visibility for the driver without causing discomfort, distraction, or glare to other road users.
DRL is an automotive lighting system on the front of a vehicle or bicycle, that automatically switches on when the vehicle is in drive, and emits white, yellow, or amber light to increase the conspicuity of the vehicle during daylight conditions.
A semi-automatic headlamp beam switching device provides automatic or manual control of beam switching at the option of the driver. When the control is automatic, the headlamps switch from the upper beam to the lower beam when illuminated by the headlamps on an approaching car and switch back to the upper beam when the road ahead is dark. When the control is manual, the driver may obtain either beam manually regardless of the condition of lights ahead of the vehicle.
Engine displacement (in cubic centimeters) is the volume swept by all the pistons inside the cylinders of a reciprocating engine in a single movement from top dead center to bottom dead center.
Engine displacement (in cubic inches) is the volume swept by all the pistons inside the cylinders of a reciprocating engine in a single movement from top dead center to bottom dead center.
Engine displacement (in liters) is the volume swept by all the pistons inside the cylinders of a reciprocating engine in a single movement from top dead center to bottom dead center.
Engine brake is the horsepower (hp) at the engine output shaft. Engine Brake (hp) From is the lower value of the range.
Engine configuration defines how engine cylinders are arranged. Common values are V6 for V-shaped arrangement, I4 or L4 for in-line arrangement.
Body Class presents the body type based on 49 CFR 565.12(b): "Body type means the general configuration or shape of a vehicle distinguished by such characteristics as the number of doors or windows, cargo-carrying features and the roofline (e.g., sedan, fastback, hatchback)." Definitions are not provided for individual body types in the regulation.
Gross vehicle weight rating (GVWR) is the maximum operating weight of a vehicle including the vehicle's chassis, body, engine, engine fluids, fuel, accessories, driver, passengers and cargo, but excluding that of the trailers. Per 49 CFR 565.15, Class 1 is further broken down to Class A-D; Class 2 is further broken down to Class E-H. This field captures the lower bound of GVWR range for the vehicle.
Cab type applies to both pickup truck and other medium- and heavy-duty trucks. The cab or cabin of a truck is the inside space in a truck where the driver is seated. For pickup trucks, the cab type is categorized by the combination number of doors and number of rows for seating. For medium- and heavy-duty trucks (MDHD), the cab type is categorized by the relative location of engine and cab.
For pickup trucks, there are four cab types.
- Regular: 2 door, 1 row of seats
- Extra/Super/Quad/Double/King/Extended: 2 doors, 2 rows of seats
- Crew/Super Crew/Crew Max: 4 doors, 2 rows of seats
- Mega: 4 doors, 2 rows of seats (with a bigger cabin than crew cab type)
For medium- and heavy-duty (MDHD) trucks, there are several categories as listed below.
- Cab Beside Engine
- CAE: Cab Above Engine
- CBE: Cab Behind Engine
- COE: Cab Over Engine or Flat Nose: Driver sits on top of the front axle and engine
- LCF: Low Cab Forward
- Conventional: Driver sits behind the engine
- Non-Tilt
- Tilt
Per 49 CFR 565, Model means a name that a manufacturer applies to a family of vehicles of the same type, make, line, series and body type.
If the model year (MY) is supplied when the VIN is decoded, such as from a crash report or a vehicle registration record, the MY value will be the supplied MY, even if the MY decoded from the VIN differs from the supplied MY. If the MY is not supplied when the VIN is decoded, the MY value will be decoded from the 10th character in the VIN.
This data element captures the city of the manufacturing plant where the manufacturer affixes the VIN.
This data element captures the name of the company that owns the manufacturing plant where the manufacturer affixes the VIN.
This data element captures the country of the manufacturing plant where the manufacturer affixes the VIN.
Testimonials from our customers