
BADVIN vehicle history report for
2016 FORD F-150VIN: 1FTEW1CP4GKE60229
Get FULL ACCESS to the vehicle history report and see all blurred info.
⭐ Read 206+ reviews from our customers who used BADVIN to avoid buying junk vehicles.
Historical Records
events
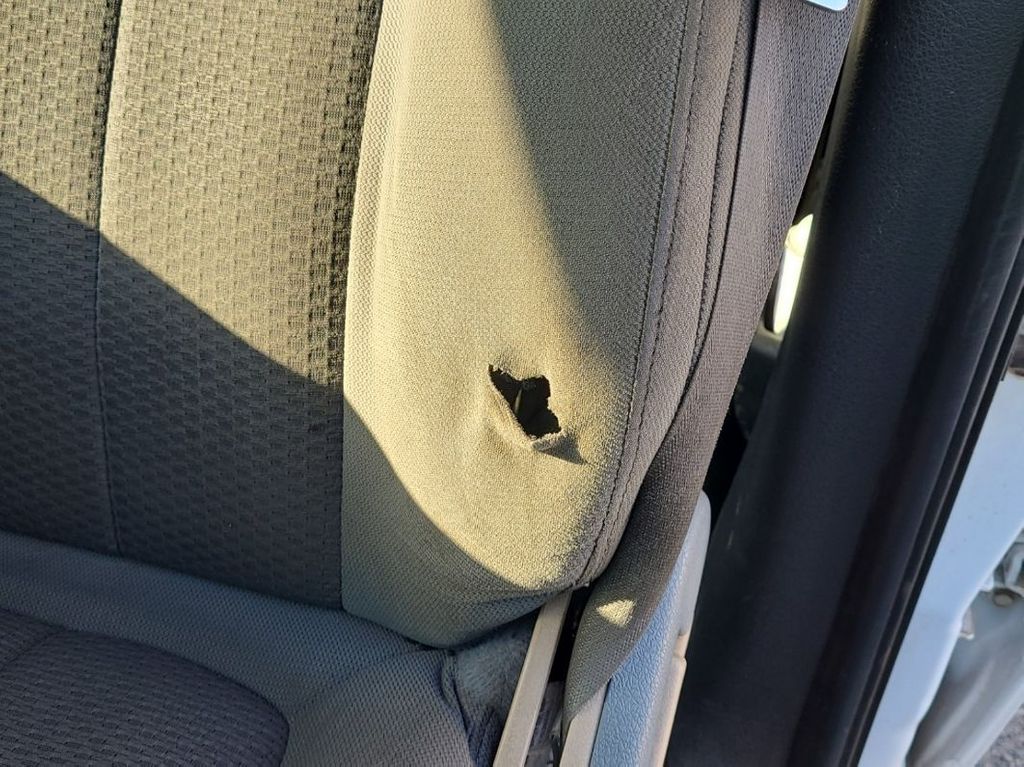
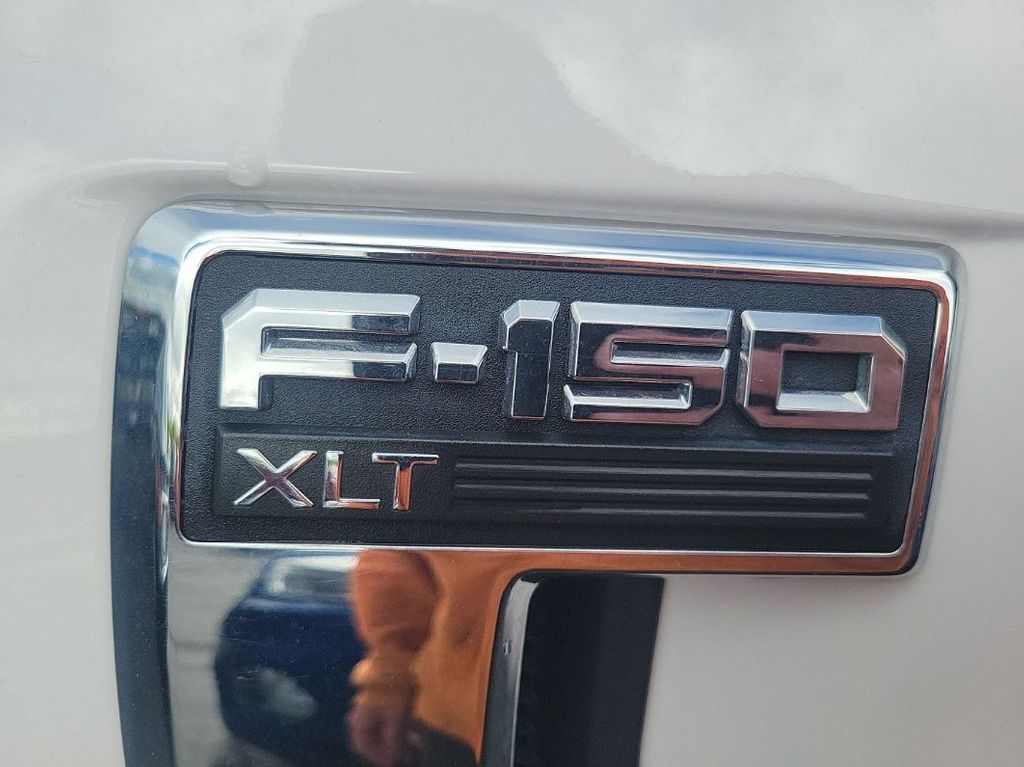
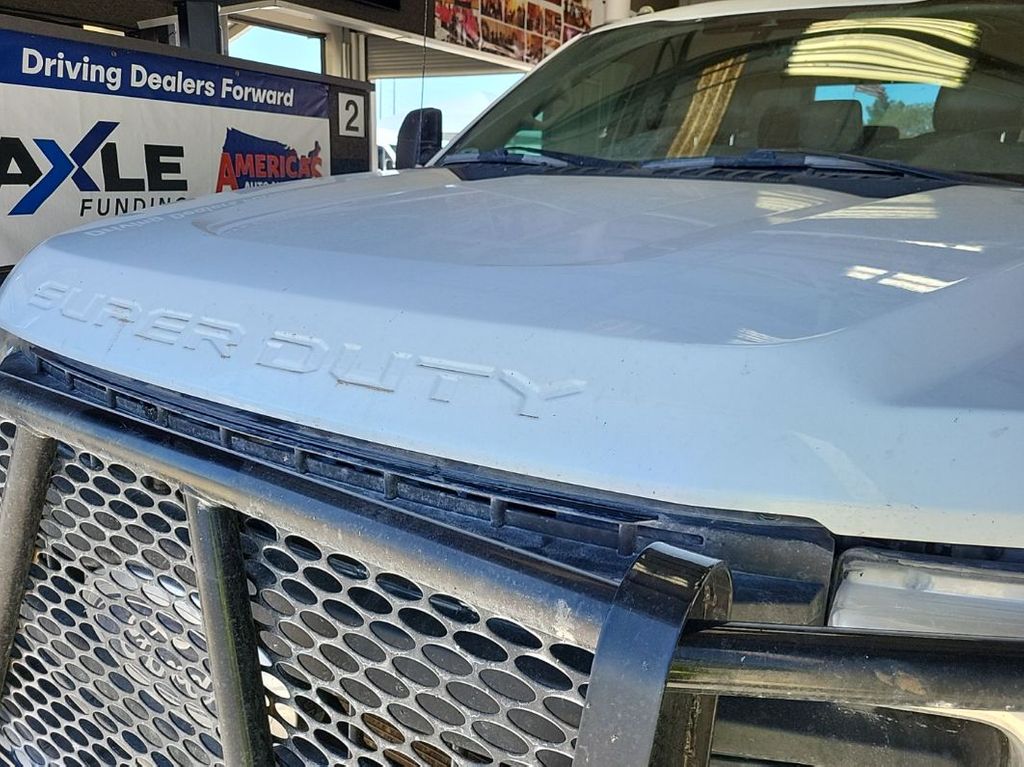
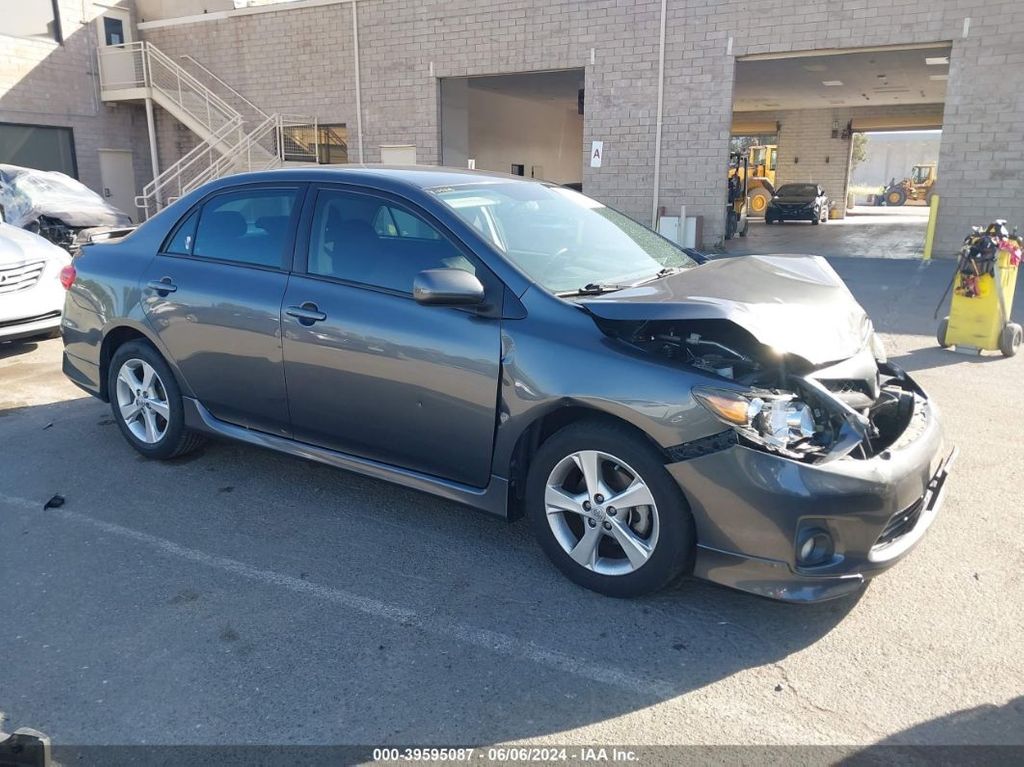
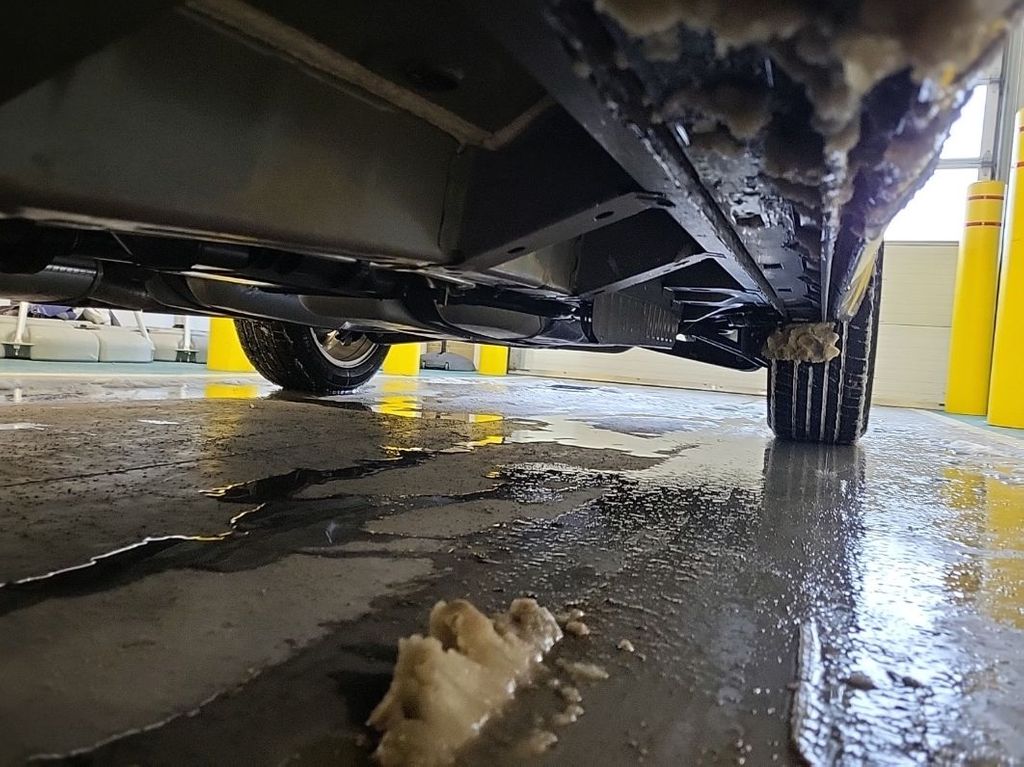
Photos
11 images
Sales History
1 records
Market report
Price analytics
Historical Records
Historical records may include service and maintenance records, title status (clean, junk, salvage), insurance records, number of owners, registration events and states, and other information.
You can find more information about historical records in BADVIN reports and see more examples here.
Available historical records for VIN 1FTEW1CP4GKE60229
Latest reported mileage: 312 mi
Below you can see some examples of what these records could look like.
2023-08-25
10 months ago
31,120 mi
REBUILT TITLE ISSUED
2022-02-26
2 years ago
9,128 mi
SALVAGE TITLE/CERTIFICATE ISSUED
2021-06-21
3 years ago
40,330 mi
NOT ACTUAL MILEAGE TITLE ISSUED
Titled or registered as lease vehicle
Titled or registered as lease vehicle
Sale Record
| Year | 2016 |
| ODO | 3408 mi (Hidden text) |
| Loss | Hidden text |
| Damage | Hidden text, Hidden text |
| Location | San Antonio-South, TX, 78201 |
| Date | ended unknown |
| Sale Website Type | salvage or insurance auction |
sale information provided by user #692783


All photos above are REAL and display ACTUAL car. After you get the report you will see full resolution photos.
Tech Specs
| Transmission | Automatic Transmission |
| Engine | 2.7L V6 FI DOHC 24V NF4, Turbo |
| Cylinders | 6 Cylinders |
| Drive | Rear Wheel Drive |
| Fuel Type | Gasoline |
Model Analytics & Market Report
We've analyzed more than 351,500 sales records of this model and here are some numbers.
The average price for new (MSRP) 2016 FORD F-150 in 2016 was $50,165.
The average price for used 2016 FORD F-150 nowadays in 2024 is $23,997 which is 48% from the original price.
Estimated mileage driven per year is 9,394 miles.
For this model we also have depreciation curve, photos, list of features and options, and other analytics.
Take a look at 2016 FORD F-150 model page in BADVIN vehicles catalog.
Depreciation
The graph below is a depreciation curve for 2016 FORD F-150. It shows how much this model looses per year in price. This analytics is calculated using sales records from BADVIN database.
The table below shows average price for used 2016 FORD F-150 in each year since the year of manufacturing, current year price and projected price in the future years.
You can scroll the table horizontally to see all columns.
| Year | Average Mileage | Average Price | % Left | % Lost | ||
|---|---|---|---|---|---|---|
| 2016 MSRP | 0 mi | $50,165 | — | — | 100% | 0% |
| 2016 | 9,394 mi | $57,250 | −$7,085 | −14.12% | 114.12% | -14.12% |
| 2017 | 18,788 mi | $52,995 | +$4,255 | +7.43% | 105.64% | -5.64% |
| 2018 | 28,182 mi | $45,995 | +$7,000 | +13.21% | 91.69% | 8.31% |
| 2019 | 37,576 mi | $41,404 | +$4,591 | +9.98% | 82.54% | 17.46% |
| 2020 | 46,970 mi | $33,798 | +$7,606 | +18.37% | 67.37% | 32.63% |
| → Visit 2016 FORD F-150 depreciation page to see full data. | ||||||
Price vs Mileage
The graph below shows how mileage affects the price for 2016 FORD F-150. This data was calculated using sales records from BADVIN database.
The table below shows average price for used 2016 FORD F-150 by mileage and number of sales.
You can scroll the table horizontally to see all columns.
| Mileage | Average Price | Sample Size |
|---|---|---|
| 15,000 mi | $33,995 | 19 sales |
| 20,000 mi | $30,492 | 18 sales |
| 25,000 mi | $25,994 | 23 sales |
| 30,000 mi | $31,248 | 20 sales |
| 35,000 mi | $29,248 | 56 sales |
| 40,000 mi | $27,974 | 76 sales |
| → Visit 2016 FORD F-150 depreciation page to see full data. | ||
Get FULL ACCESS to the vehicle history report and see all blurred info.
⭐ Read 206+ reviews from our customers who used BADVIN to avoid buying junk vehicles.
Testimonials from our customers
As a first time used car buyer, I was nervous about getting ripped off. The vehicle report from badvin gave me so much more confidence - it confirmed the car had a clean history and the mileage lined up. Such a relief to have that peace of mind.

Chloe Martin
verified on Trustpilot
Bad Vin's vehicle history report showed that the 2018 Audi A4 I was about to buy had been in a major accident that was not disclosed by the seller. The severity analysis helped me avoid a bad purchase. Great service!
Sophie Dubois
verified on Trustpilot
Report showed a car I was considering had a prior salvage title from a major accident, even though carfax listed it as clean. Messaged seller asking about it and they made shady excuses. Def avoided a scam thanks to badvin!
Mia Johnson
verified on Trustpilot
Was about to buy a used 2016 Camry but decided to get the badvin report first. Turns out the car had been in a serious crash and was declared a total loss by insurance, even tho carfax showed it as clean! Dodged a bullet on that one. ty badvin
Jessica Nguyen
verified on Trustpilot
Compare to other 2016 FORD F-150


Other vehicles sales records


Frequently asked questions
Yes, the Monroney label includes information about the vehicle’s manufacturing origin, specifying where the vehicle was assembled and the origin of its parts.
A VIN decoder can uncover discrepancies such as mismatches in reported and actual vehicle specifications, including year, model, and equipment, which can indicate potential fraud or errors in listings.
The pricing information on a Monroney label for 2016 FORD F-150 is very detailed, including the base price, cost of added options, destination charges, and any additional fees.
Yes, a VIN decoder can often determine if specific safety technologies are equipped on a 2016 FORD F-150 based on the trim and optional equipment codes within the VIN.
Our vehicle history reports may indicate if the 2016 FORD vehicle was previously used in commercial services like a taxi or rental car, which may affect its condition and value, if such usage is recorded.
When buying a car, consider models with strong resale histories, opt for popular color and feature options, and evaluate current market trends for the best value retention.


