
BADVIN vehicle history report for
2017 FORD F-150VIN: 1FTEW1CP3HKC03936
Get FULL ACCESS to the vehicle history report and see all blurred info.
⭐ Read 206+ reviews from our customers who used BADVIN to avoid buying junk vehicles.
Historical Records
events
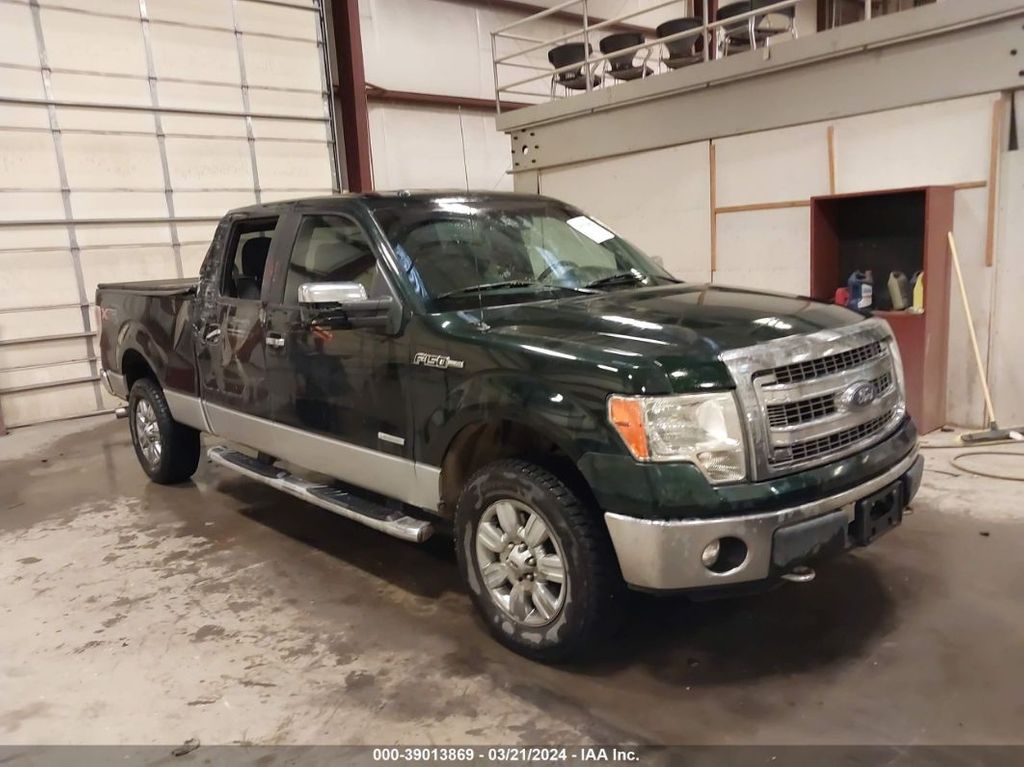
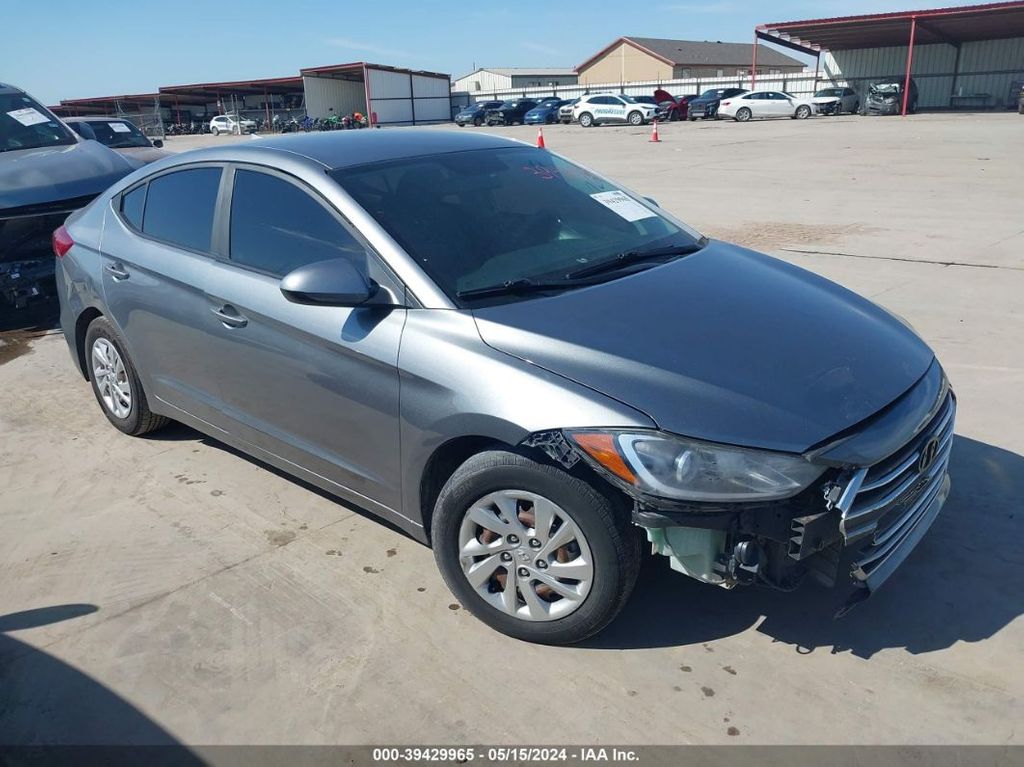
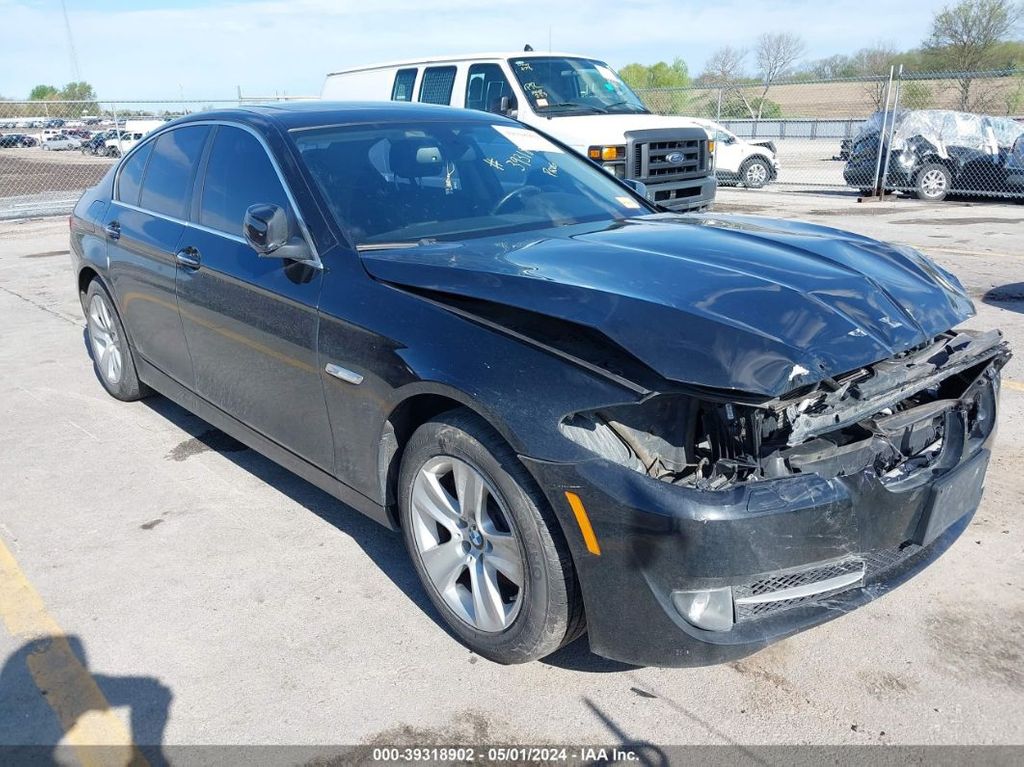
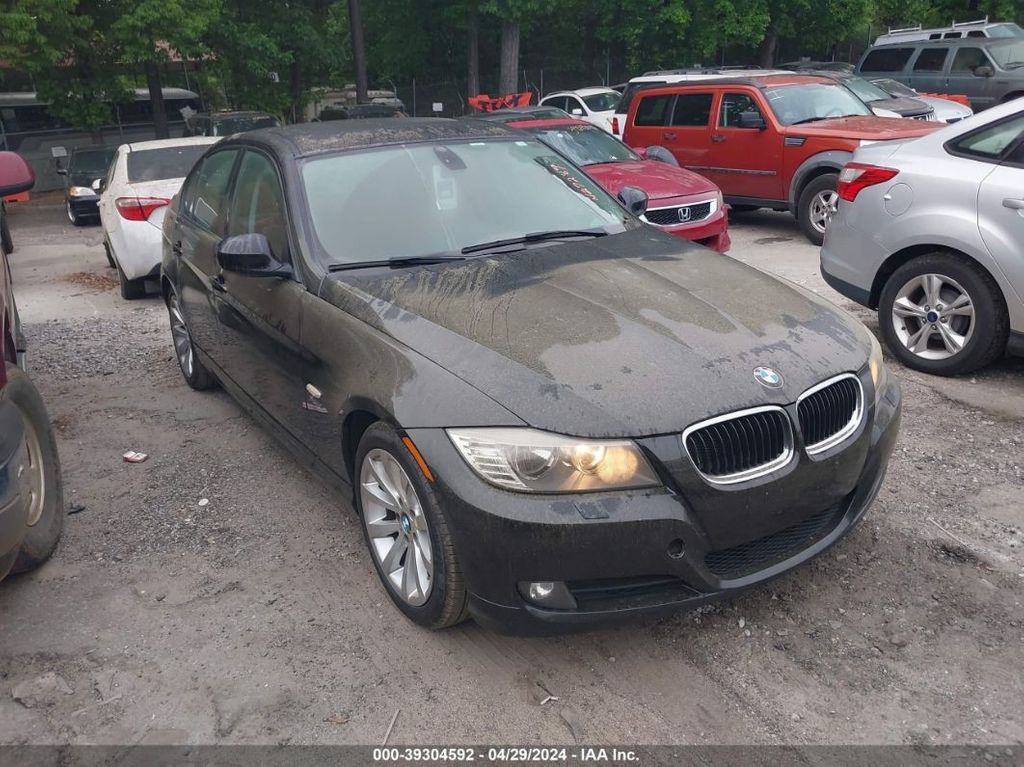
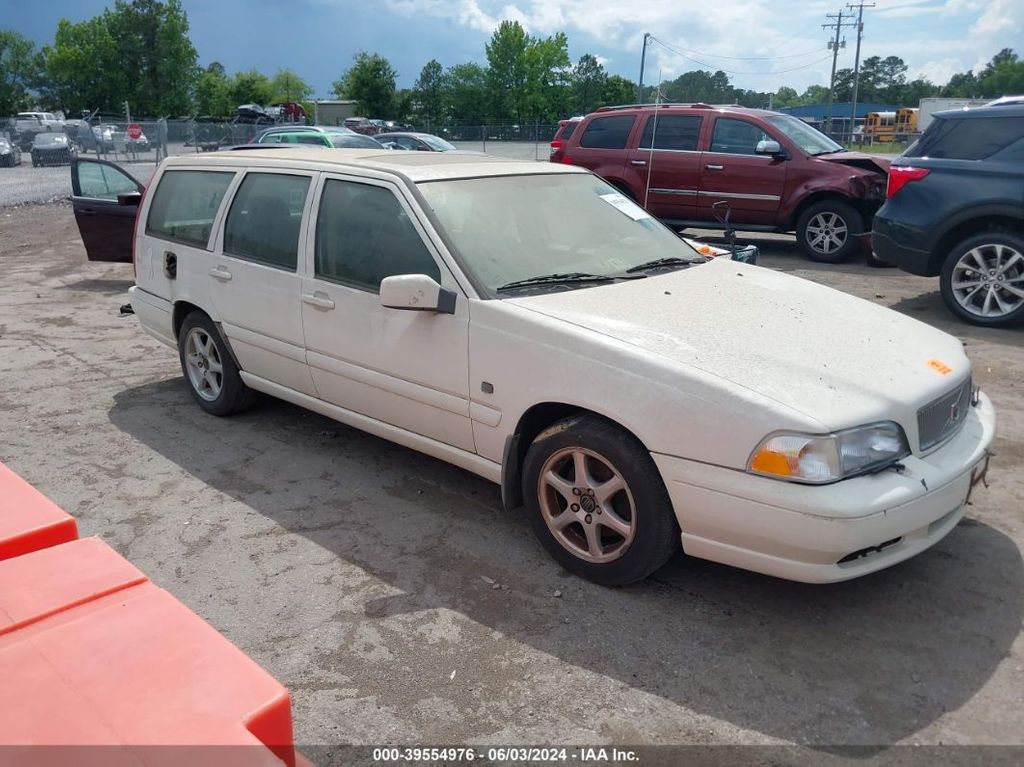
Photos
12 images
Sales History
1 records
Market report
Price analytics
Historical Records
Historical records may include service and maintenance records, title status (clean, junk, salvage), insurance records, number of owners, registration events and states, and other information.
You can find more information about historical records in BADVIN reports and see more examples here.
Available historical records for VIN 1FTEW1CP3HKC03936
Latest reported mileage: 209 mi
Below you can see some examples of what these records could look like.
2023-04-22
a year ago
46,271 mi
Damage reported: minor to moderate damage
Damage to right rear
Damage to rear
Damage to right rear
Damage to rear
2022-08-03
2 years ago
5,400 mi
Fire damage reported: minor damage
Vandalism damage reported
Damage to front
Vandalism damage reported
Damage to front
2021-04-23
3 years ago
42,812 mi
Passed emissions inspection
Sale Record
Has Keys:Hidden text
| Year | 2017 |
| Title | Hidden text |
| ODO | 5508 mi (Hidden text) |
| Loss | Hidden text |
| Damage | Hidden text |
| Location | Longview, TX, 75604 |
| Date | ended 54 years ago |
| Sale Website Type | salvage or insurance auction |
sale information provided by user #466307


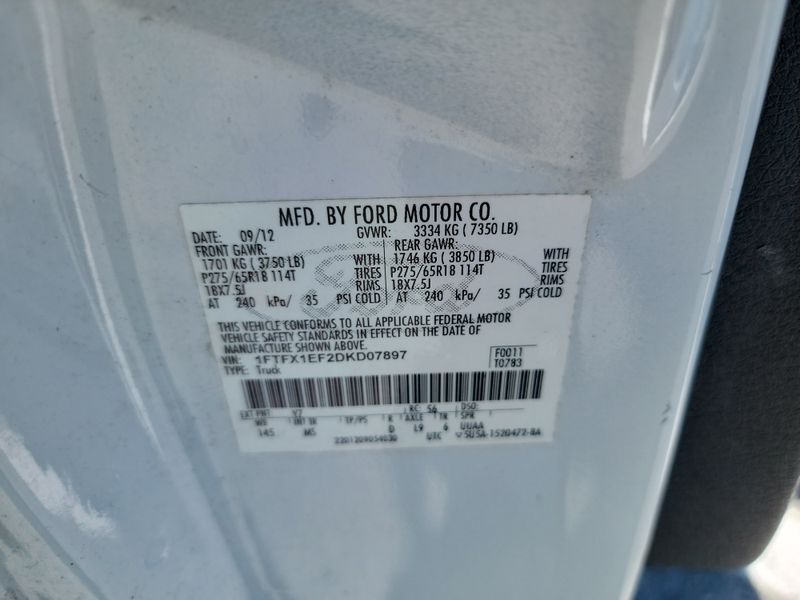
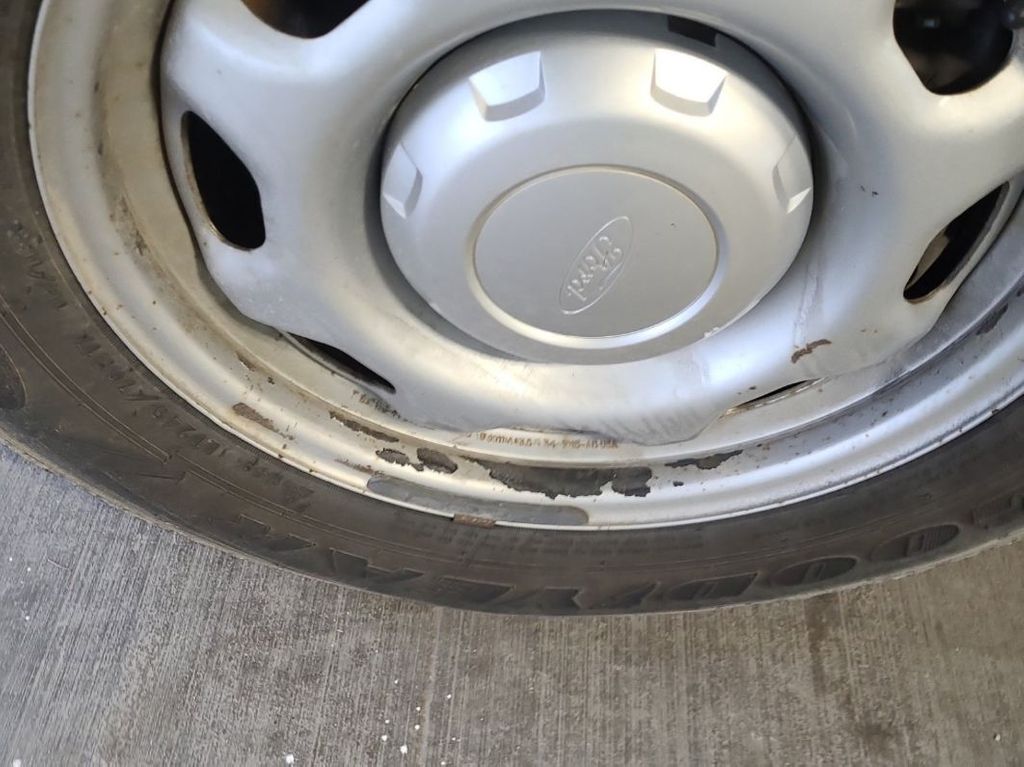
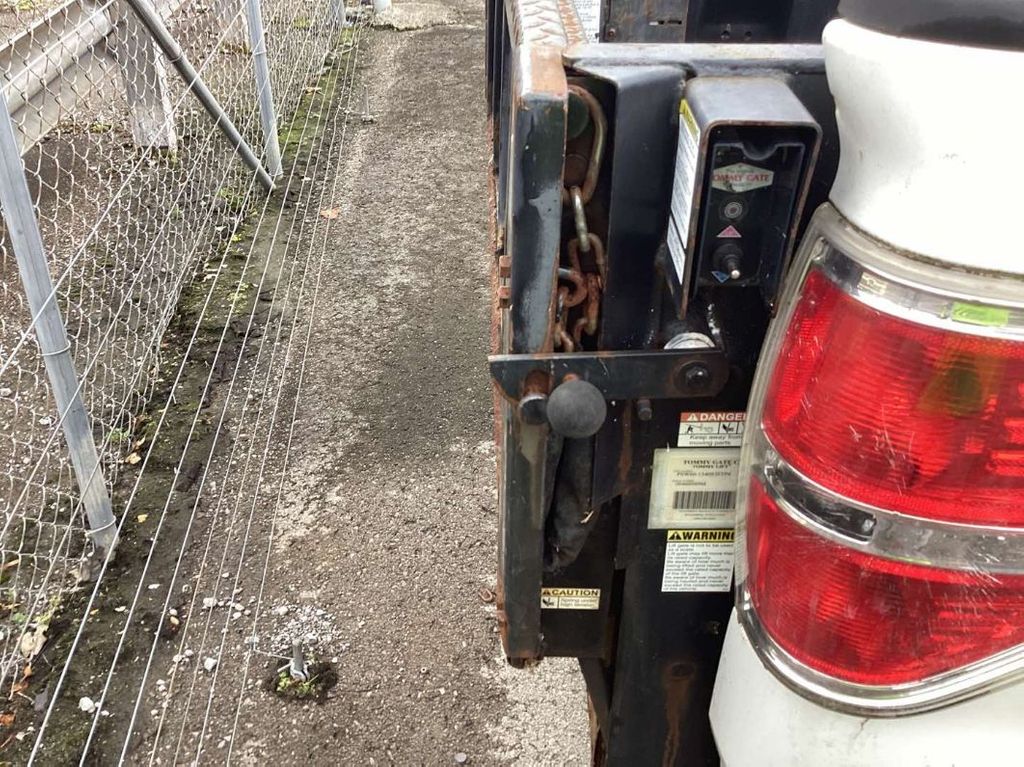
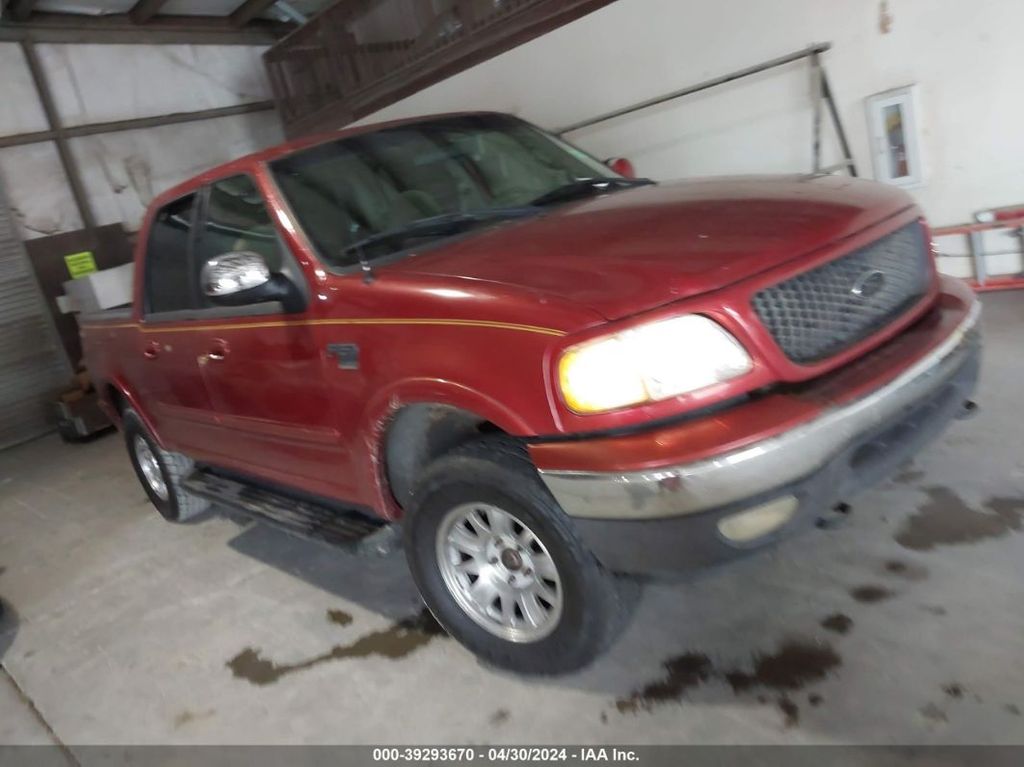
All photos above are REAL and display ACTUAL car. After you get the report you will see full resolution photos.
Tech Specs
| Body Style | CREW PICKUP |
| Engine | 2.7L V6 FI DOHC 24V NF4 |
| Cylinders | 6 Cylinders |
| Drive | Rear Wheel Drive |
| Fuel Type | Gasoline |
Model Analytics & Market Report
We've analyzed more than 349,700 sales records of this model and here are some numbers.
The average price for new (MSRP) 2017 FORD F-150 in 2017 was $50,165.
The average price for used 2017 FORD F-150 nowadays in 2024 is $26,990 which is 54% from the original price.
Estimated mileage driven per year is 9,394 miles.
For this model we also have depreciation curve, photos, list of features and options, and other analytics.
Take a look at 2017 FORD F-150 model page in BADVIN vehicles catalog.
Depreciation
The graph below is a depreciation curve for 2017 FORD F-150. It shows how much this model looses per year in price. This analytics is calculated using sales records from BADVIN database.
The table below shows average price for used 2017 FORD F-150 in each year since the year of manufacturing, current year price and projected price in the future years.
You can scroll the table horizontally to see all columns.
| Year | Average Mileage | Average Price | % Left | % Lost | ||
|---|---|---|---|---|---|---|
| 2017 MSRP | 0 mi | $50,165 | — | — | 100% | 0% |
| 2017 | 9,394 mi | $57,250 | −$7,085 | −14.12% | 114.12% | -14.12% |
| 2018 | 18,788 mi | $52,995 | +$4,255 | +7.43% | 105.64% | -5.64% |
| 2019 | 28,182 mi | $45,995 | +$7,000 | +13.21% | 91.69% | 8.31% |
| 2020 | 37,576 mi | $41,404 | +$4,591 | +9.98% | 82.54% | 17.46% |
| 2021 | 46,970 mi | $33,798 | +$7,606 | +18.37% | 67.37% | 32.63% |
| → Visit 2017 FORD F-150 depreciation page to see full data. | ||||||
Price vs Mileage
The graph below shows how mileage affects the price for 2017 FORD F-150. This data was calculated using sales records from BADVIN database.
The table below shows average price for used 2017 FORD F-150 by mileage and number of sales.
You can scroll the table horizontally to see all columns.
| Mileage | Average Price | Sample Size |
|---|---|---|
| 10,000 mi | $41,923 | 10 sales |
| 20,000 mi | $34,995 | 33 sales |
| 25,000 mi | $34,000 | 37 sales |
| 30,000 mi | $30,000 | 50 sales |
| 35,000 mi | $32,300 | 73 sales |
| 40,000 mi | $32,278 | 88 sales |
| → Visit 2017 FORD F-150 depreciation page to see full data. | ||
Get FULL ACCESS to the vehicle history report and see all blurred info.
⭐ Read 206+ reviews from our customers who used BADVIN to avoid buying junk vehicles.
Testimonials from our customers
As a first time used car buyer, I was nervous about getting ripped off. The vehicle report from badvin gave me so much more confidence - it confirmed the car had a clean history and the mileage lined up. Such a relief to have that peace of mind.

Chloe Martin
verified on Trustpilot
Ich hätte fast einen 2017 Mercedes-Benz C300 gekauft, bis der Bad Vin-Bericht zeigte, dass er als durch Überschwemmung beschädigt gemeldet wurde. Die detaillierten Schadensaufzeichnungen haben mich vor einem großen Fehler bewahrt!
Sophia Müller
verified on Trustpilot
I almost bought a used Honda but luckily checked the BadVin report first. Turned out it had a salvage title from flood damage that the seller didn't disclose. Phew, dodged a huge issue!
Emily Turner
verified on Trustpilot
I've tried many vehicle reports but badvin's is by far the most comprehensive. It shows accident photos, past sales, repairs and so much more. I won't buy a car now without getting a report first. It's a must-have.
Alexander Hunt
verified on Trustpilot
Compare to other 2017 FORD F-150


Other vehicles sales records
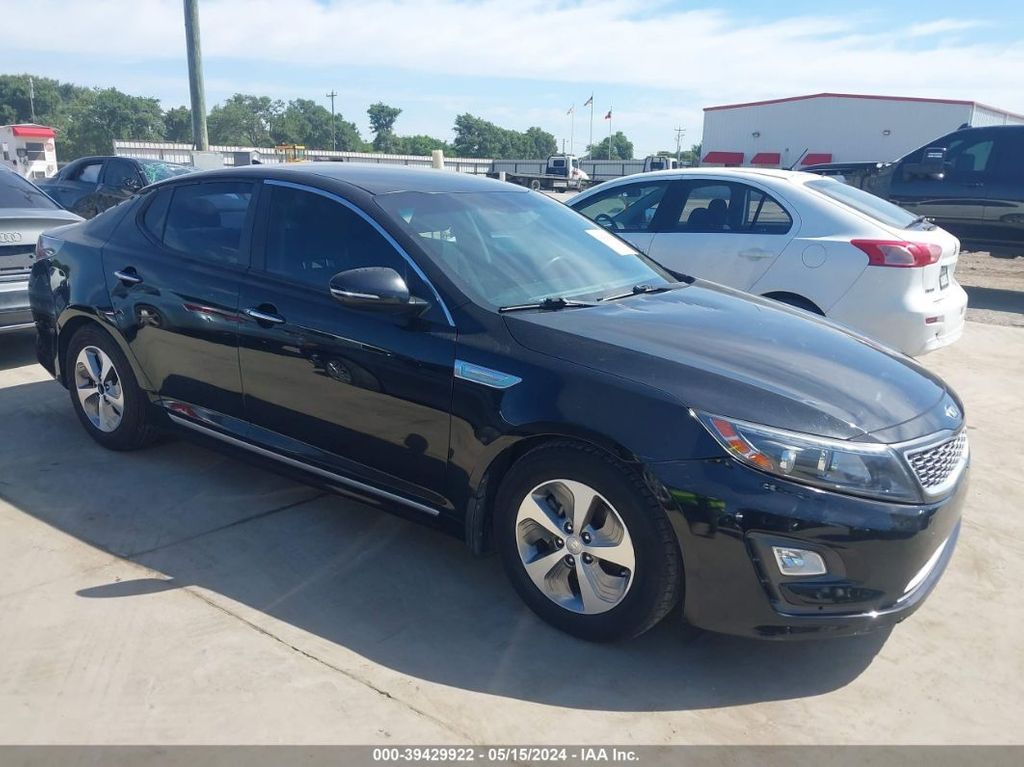
2014 KIA OPTIMA
in 11 days, 142,590 mi
est retail value $6,750
buy now price $1,950
VIN KNAGM4AD1E5063353


2017 HYUNDAI ELANTRA
in 11 days, 129,356 mi
est retail value $9,275
buy now price $2,150
VIN KMHD74LF4HU409901


Frequently asked questions
A potential buyer can use a VIN decoder to verify the features of a used car by confirming the model, trim level, and installed options, ensuring the features match those advertised.
A VIN decoder is generally reliable for confirming the transmission type, as this information is encoded within the VIN by most manufacturers.
Repossession records, if included, indicate if the 2017 FORD vehicle has been taken back by a lender due to payment defaults, which might affect its condition and value.
Saltwater damage, if documented, is specifically noted due to its corrosive impact on the 2017 FORD vehicle's mechanical and electrical systems.
An insurance check can reveal past claims, typically related to accident damage, which might indicate underlying issues not apparent in a physical inspection, if such information is available.
Yes, the fuel type of a vehicle is listed on the window sticker, providing important information for buyers about whether the car operates on gasoline, diesel, electricity, or hybrid technology.
Discrepancies between a window sticker and actual dealer pricing can occur due to additional dealer markup, optional add-ons not included in the sticker, or regional pricing differences.
Details of airbag deployment may be documented in our reports, providing insights on any incidents that led to the airbags being activated in the 2017 FORD vehicle, if reported.


