
BADVIN vehicle history report for
1996 FORD RANGERVIN: 1FTCR15U9TPA82407
Get FULL ACCESS to the vehicle history report and see all blurred info.
⭐ Read 205+ reviews from our customers who used BADVIN to avoid buying junk vehicles.
Historical Records
events
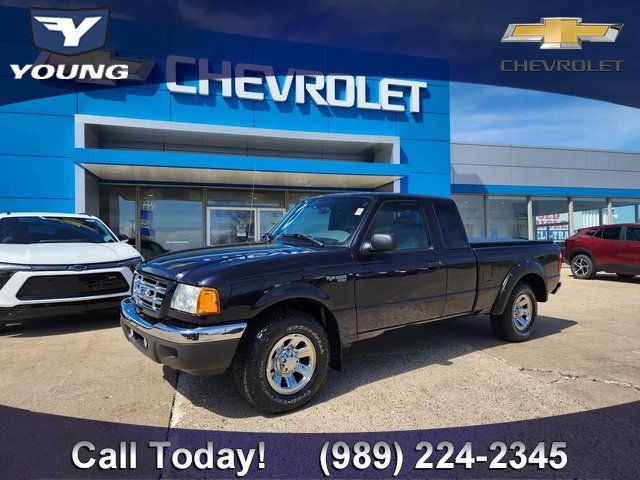
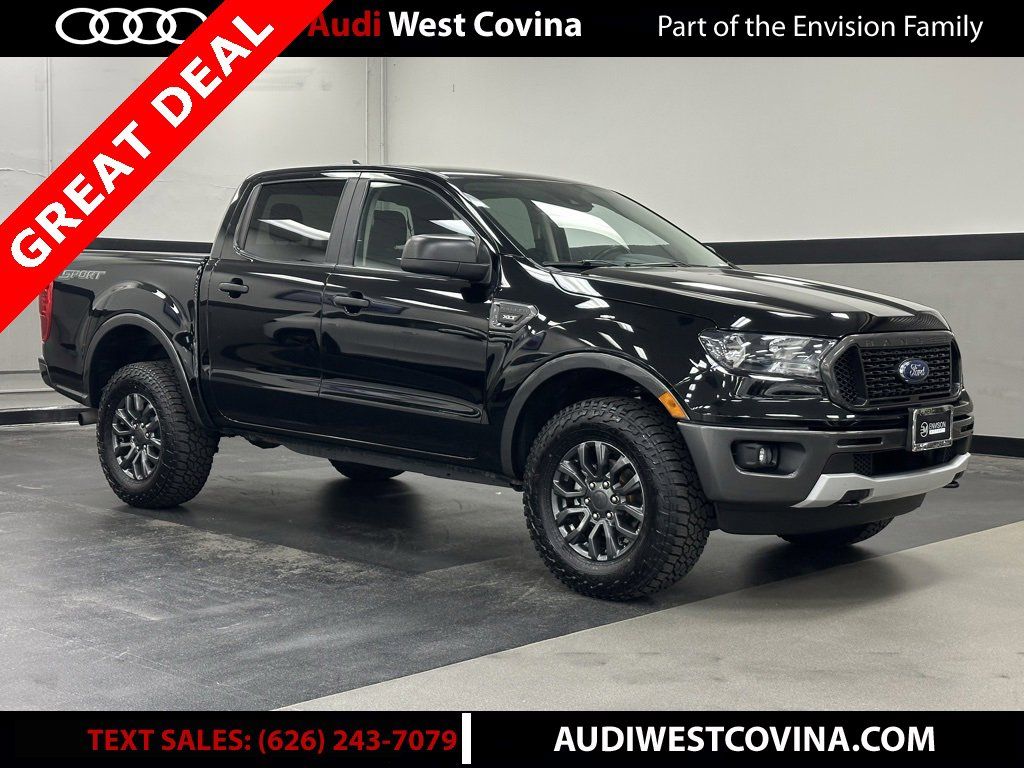
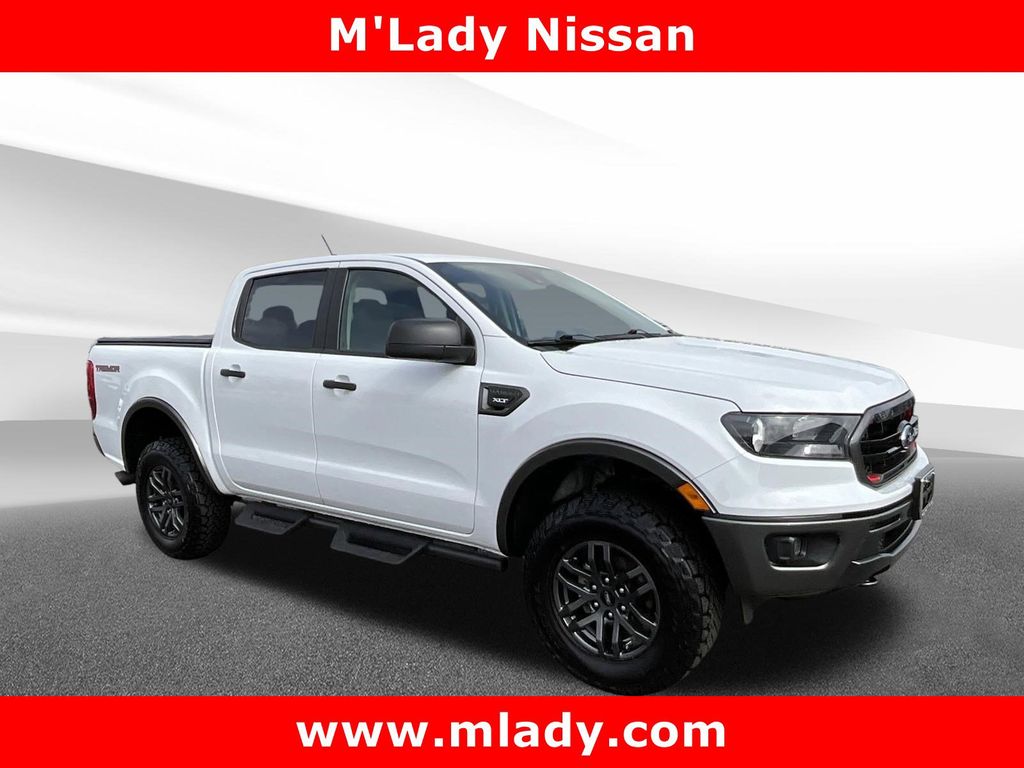
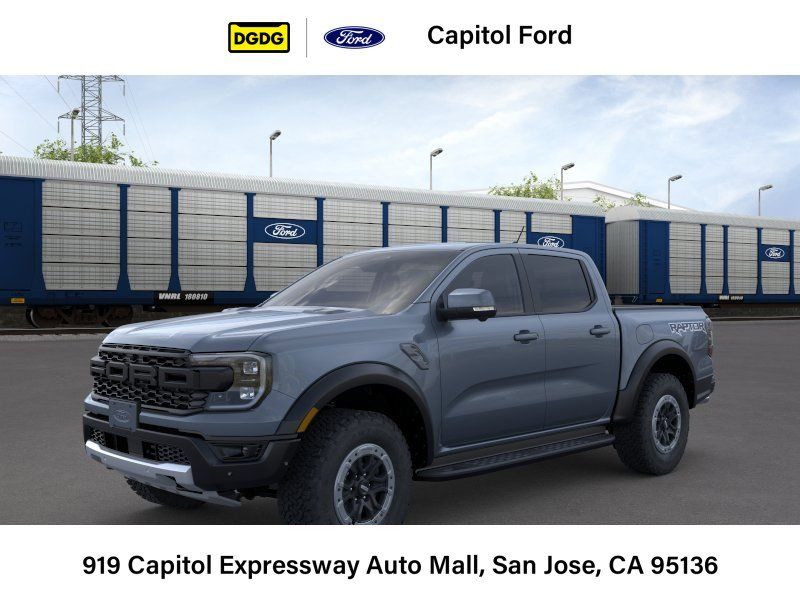
Photos
12 images
Sales History
1 records
Sale Prices
1 records
Market report
Price analytics
Historical Records
Historical records may include service and maintenance records, title status (clean, junk, salvage), insurance records, number of owners, registration events and states, and other information.
You can find more information about historical records in BADVIN reports and see more examples here.
Available historical records for VIN 1FTCR15U9TPA82407
Latest reported mileage: 901 mi
Below you can see some examples of what these records could look like.
2022-12-24
a year ago
41,178 mi
Odometer reading reported
2021-11-15
3 years ago
10,097 mi
Damage reported: very minor damage
Damage to rear
Damage to rear
2019-05-17
5 years ago
45,701 mi
Passed emissions inspection
1996 Ford Ranger 4x4 SuperCab
| Year | 1996 |
| ODO | 4660 mi |
| Seller | Hidden text (Hidden text) |
| Location | Chicago, IL, 60618 |
| Date | appeared 15 days ago latest price $7517 sale post disappeared 2022-08-27 |
| Price History | |
| Sale Website Type | classifieds |
sale information provided by user #109445


All photos above are REAL and display ACTUAL car. After you get the report you will see full resolution photos.
Tech Specs
| Color | Burgundy Exterior |
| Drive | 4 wheel drive |
Model Analytics & Market Report
We've analyzed more than 1,800 sales records of this model and here are some numbers.
The average price for new (MSRP) 1996 FORD RANGER in 1996 was $38,035.
The average price for used 1996 FORD RANGER nowadays in 2024 is $5,750 which is 15% from the original price.
Estimated mileage driven per year is 7,704 miles.
For this model we also have depreciation curve, photos, list of features and options, and other analytics.
Take a look at 1996 FORD RANGER model page in BADVIN vehicles catalog.
Depreciation
The graph below is a depreciation curve for 1996 FORD RANGER. It shows how much this model looses per year in price. This analytics is calculated using sales records from BADVIN database.
The table below shows average price for used 1996 FORD RANGER in each year since the year of manufacturing, current year price and projected price in the future years.
You can scroll the table horizontally to see all columns.
| Year | Average Mileage | Average Price | % Left | % Lost | ||
|---|---|---|---|---|---|---|
| 1996 MSRP | 0 mi | $38,035 | — | — | 100% | 0% |
| 1996 | 7,704 mi | $55,746 | −$17,711 | −46.57% | 146.57% | -46.57% |
| 1997 | 15,408 mi | $37,992 | +$17,754 | +31.85% | 99.89% | 0.11% |
| 1998 | 23,112 mi | $35,039 | +$2,953 | +7.77% | 92.12% | 7.88% |
| 1999 | 30,816 mi | $32,500 | +$2,539 | +7.25% | 85.45% | 14.55% |
| 2000 | 38,520 mi | $29,990 | +$2,510 | +7.72% | 78.85% | 21.15% |
| → Visit 1996 FORD RANGER depreciation page to see full data. | ||||||
Price vs Mileage
The graph below shows how mileage affects the price for 1996 FORD RANGER. This data was calculated using sales records from BADVIN database.
The table below shows average price for used 1996 FORD RANGER by mileage and number of sales.
You can scroll the table horizontally to see all columns.
| Mileage | Average Price | Sample Size |
|---|---|---|
| 50,000 mi | $7,995 | 10 sales |
| 60,000 mi | $5,996 | 30 sales |
| 65,000 mi | $6,493 | 14 sales |
| 70,000 mi | $5,995 | 24 sales |
| 75,000 mi | $5,000 | 20 sales |
| 80,000 mi | $7,648 | 14 sales |
| → Visit 1996 FORD RANGER depreciation page to see full data. | ||
Get FULL ACCESS to the vehicle history report and see all blurred info.
⭐ Read 205+ reviews from our customers who used BADVIN to avoid buying junk vehicles.
Testimonials from our customers
Was shopping for a used Range Rover and found one that seemed suspiciously cheap. The badVIN report revealed it had been in a major front end collision, with photos showing the damage. Steered clear of that one and saved myself a ton of headaches!!

Ava Patel
verified on Trustpilot
As a broke college kid I almost settled for a sketchy 2005 Altima cuz it was cheap. but splurged on the report from badvin 1st. soooo glad I did - turned out it had been totalled and rebuilt. spending a little saved me from wasting $1000s!
Sophie
verified on Trustpilot
I've tried a bunch of different vehicle history reports over the years and badvin.org has been the most comprehensive by far. Stuff like service records, ownership history, lien and repo info that I haven't found elsewhere. Def go-to resource when shopping for used vehicles now.
Levi Johnson
verified on Trustpilot
I almost bought a 2019 Malibu that seemed like a great deal - low miles and price. But the badvin report showed it used to be a rental fleet vehicle, which the seller didn't disclose. Glad I found out before buying someone else's abused rental!
Benjamin Torres
verified on Trustpilot
Compare to other 1996 FORD RANGER


Other vehicles sales records


Frequently asked questions
A flood or lemon title, if reported, indicates significant past issues, which are detailed in our reports to inform potential buyers of the risks associated with such vehicles.
Yes, the window sticker of a 1996 FORD RANGER provides the EPA fuel efficiency ratings, showing expected mpg in city and highway conditions.
Total loss is usually determined when the cost of repairing the vehicle exceeds a certain percentage of its value before the damage occurred, as decided by the insurance company, if such data is recorded.
Yes, a VIN decoder can often determine if specific safety technologies are equipped on a 1996 FORD RANGER based on the trim and optional equipment codes within the VIN.
The expected depreciation of a vehicle after three years can vary, but generally, cars lose a significant portion of their value within the first few years.
The Monroney label of a 1996 FORD RANGER lists advanced technology features, such as navigation systems, driver assistance technologies, and connectivity features, along with their descriptions.
A VIN decoder can reveal engine details such as the engine size, configuration, and fuel type, which are encoded in specific characters of the VIN.


