
BADVIN vehicle history report for
2011 FORD F-350VIN: 1FT8W3BTXBEB64484
Get FULL ACCESS to the vehicle history report and see all blurred info.
⭐ Read 206+ reviews from our customers who used BADVIN to avoid buying junk vehicles.
Historical Records
events
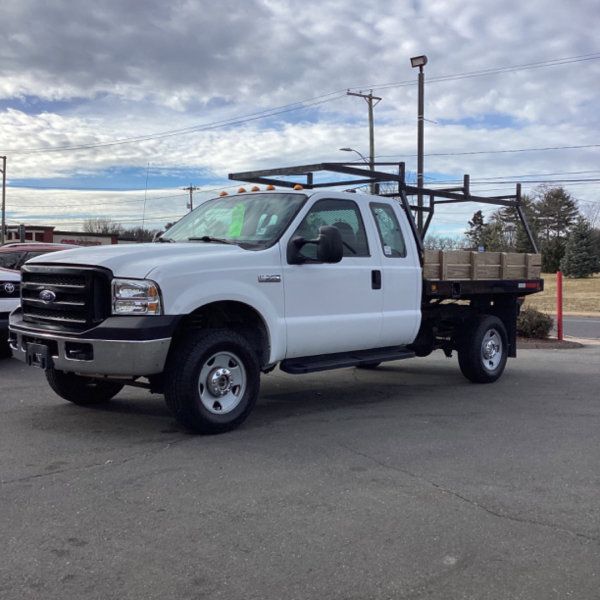
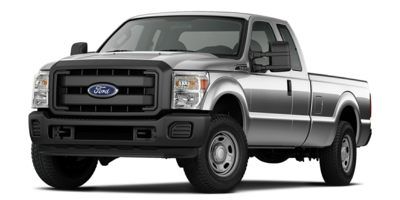
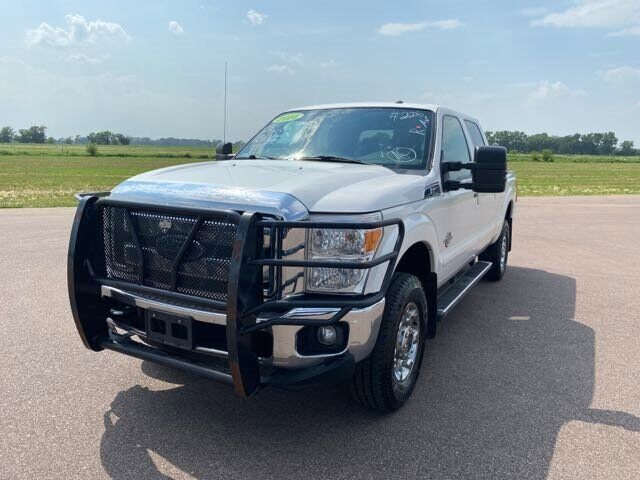
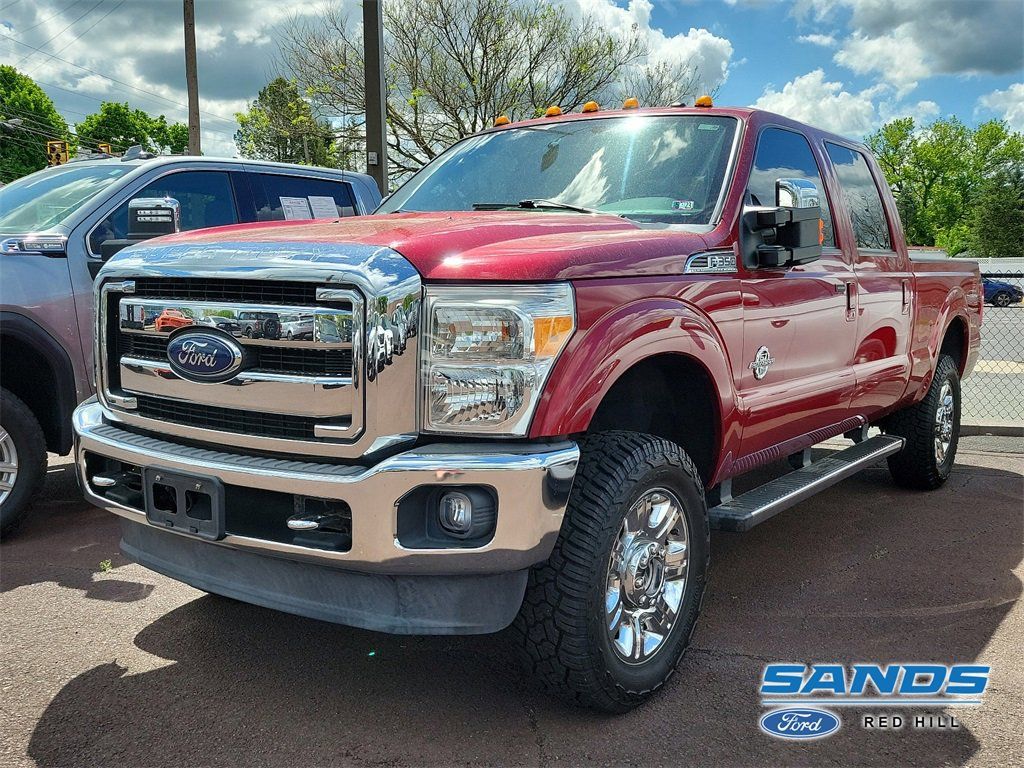
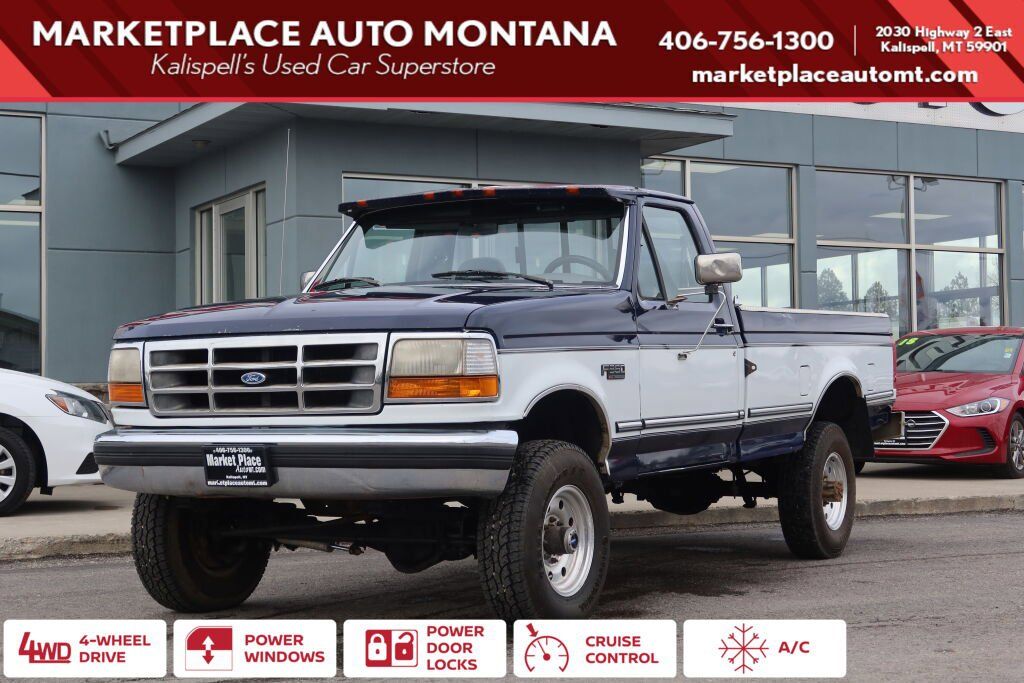
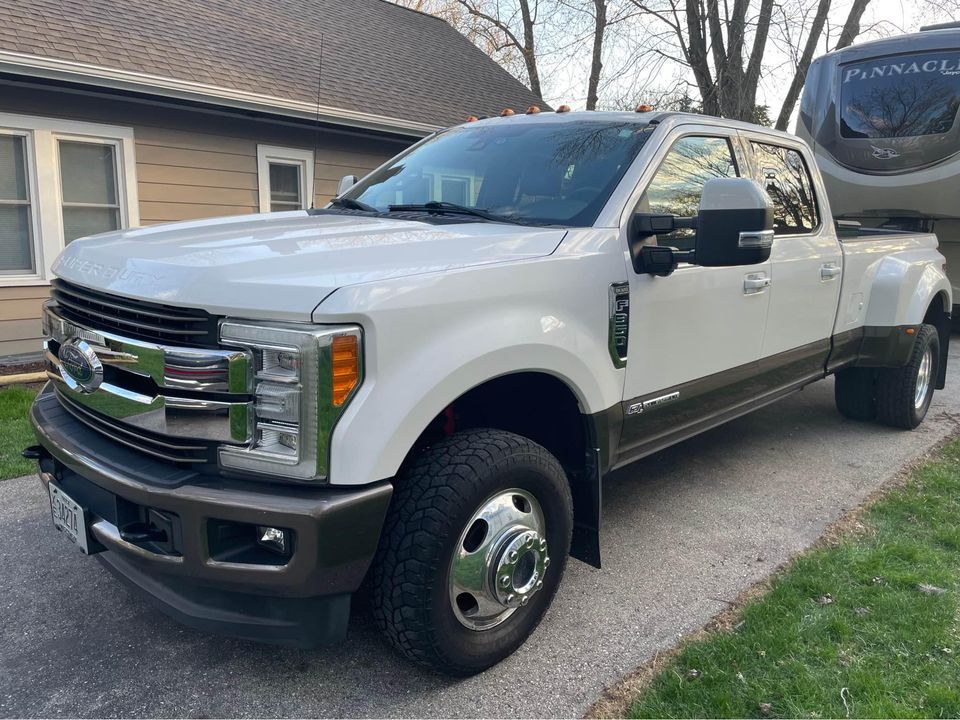
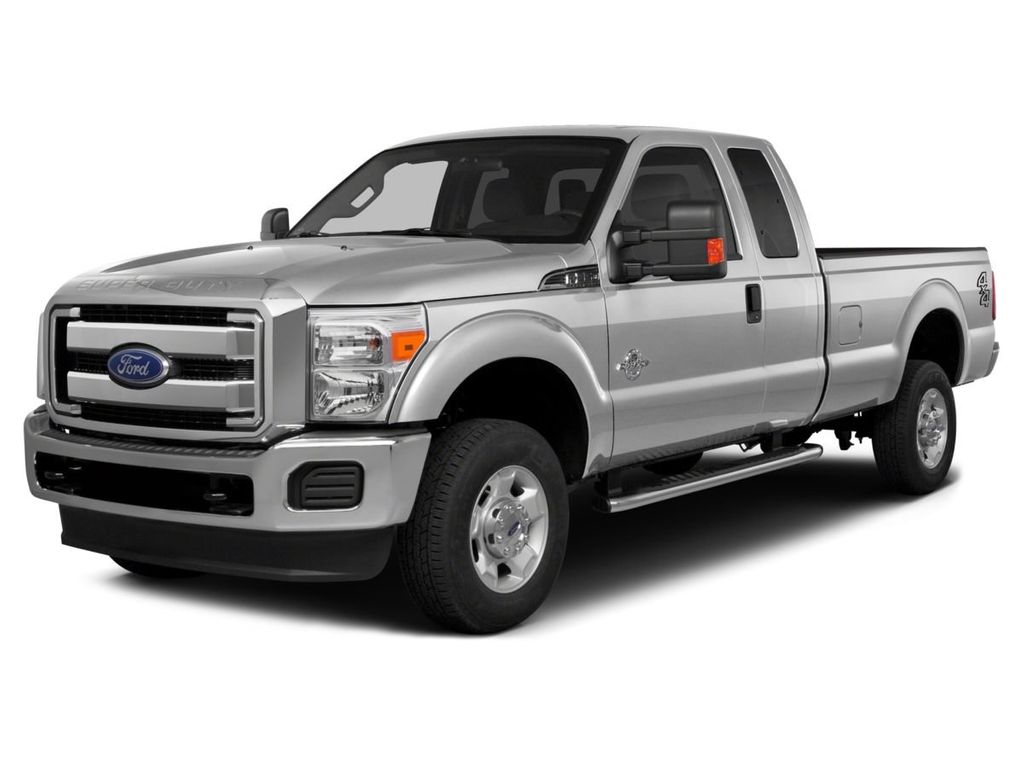
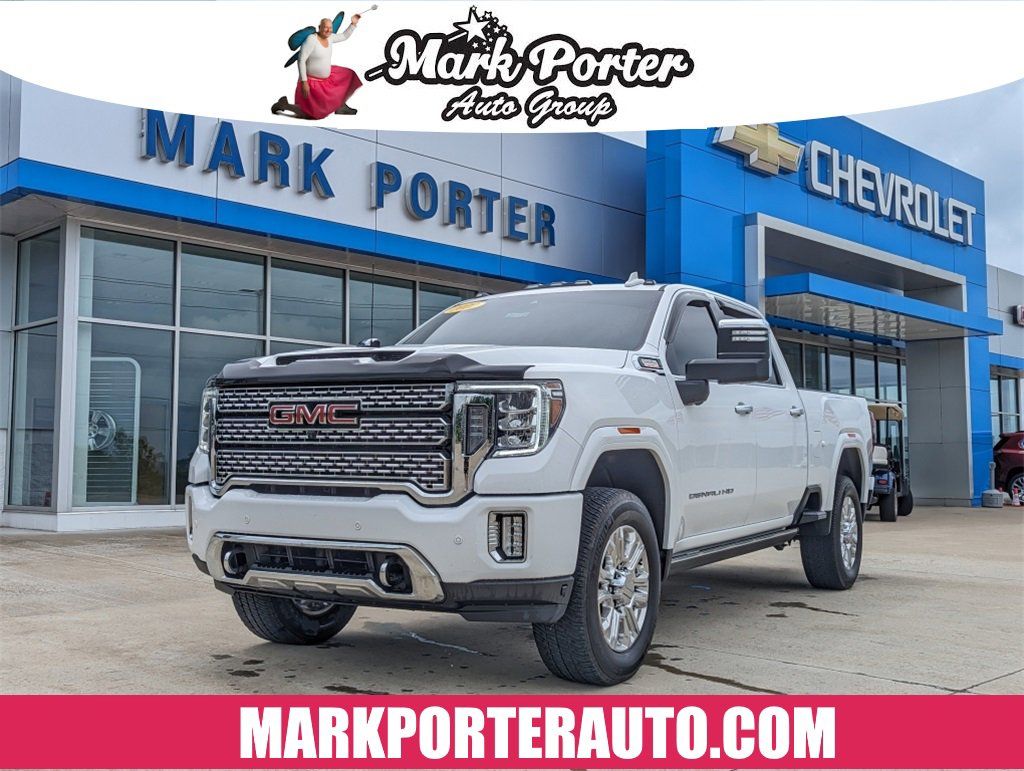
Photos
12 images
Sales History
1 records
Sale Prices
1 records
Market report
Price analytics
Historical Records
Historical records may include service and maintenance records, title status (clean, junk, salvage), insurance records, number of owners, registration events and states, and other information.
You can find more information about historical records in BADVIN reports and see more examples here.
Available historical records for VIN 1FT8W3BTXBEB64484
Latest reported mileage: 418 mi
Below you can see some examples of what these records could look like.
2023-06-16
a year ago
100,405 mi
Fire damage reported: minor damage
Vandalism damage reported
Damage to front
Vandalism damage reported
Damage to front
2022-05-05
2 years ago
13,451 mi
Vehicle serviced
40,000 mile service performed
40,000 mile service performed
2019-08-26
5 years ago
27,819 mi
Damage reported
Damage to front
Damage to front
2011 Ford F350 XLT
| Year | 2011 |
| ODO | 9834 mi |
| Seller | Hidden text (Hidden text) |
| Location | Hollis, NH, 03049 |
| Date | appeared 3 years ago latest price $7567 sale post disappeared 2021-10-09 |
| Price History | |
| Sale Website Type | classifieds |
| Notes | |
| Hidden text | |
sale information provided by user #798693


All photos above are REAL and display ACTUAL car. After you get the report you will see full resolution photos.
Tech Specs
| Color | Black Exterior |
| Transmission | 6-Speed Automatic Transmission |
| Drive | All Wheel Drive |
Standard Features
All these features are based on a model in general. This specific vehicle may differ.
- 4WD
- Hidden text
- Backup camera
- Hidden text
- Hill start assist control
- Hidden text
- Anti-Theft System
- Hidden text
- FX4 Off-Road
- Hidden text
- ABS (4-Wheel)
- Hidden text
- Bed Liner
- Hidden text
- Keyless Entry
- Hidden text
- Power Seat
- Hidden text
- Turbo Diesel
- Hidden text
- Tilt &Amp; Telescoping Wheel
- Hidden text
- V8
- 1662
- Appearance Pkg
- 6023
- Automatic
- Hidden text
- Camper Pkg
- Hidden text
- Hill Descent Control
- Hidden text
- Power Door Locks
- Hidden text
- Running Boards
- Hidden text
- Traction Control
Model Analytics & Market Report
We've analyzed more than 24,400 sales records of this model and here are some numbers.
The average price for new (MSRP) 2011 FORD F-350 in 2011 was $62,870.
The average price for used 2011 FORD F-350 nowadays in 2024 is $24,996 which is 40% from the original price.
Estimated mileage driven per year is 10,775 miles.
For this model we also have depreciation curve, photos, list of features and options, and other analytics.
Take a look at 2011 FORD F-350 model page in BADVIN vehicles catalog.
Depreciation
The graph below is a depreciation curve for 2011 FORD F-350. It shows how much this model looses per year in price. This analytics is calculated using sales records from BADVIN database.
The table below shows average price for used 2011 FORD F-350 in each year since the year of manufacturing, current year price and projected price in the future years.
You can scroll the table horizontally to see all columns.
| Year | Average Mileage | Average Price | % Left | % Lost | ||
|---|---|---|---|---|---|---|
| 2011 MSRP | 0 mi | $62,870 | — | — | 100% | 0% |
| 2011 | 10,775 mi | $87,992 | −$25,122 | −39.96% | 139.96% | -39.96% |
| 2012 | 21,550 mi | $78,995 | +$8,997 | +10.22% | 125.65% | -25.65% |
| 2013 | 32,325 mi | $67,500 | +$11,495 | +14.55% | 107.36% | -7.36% |
| 2014 | 43,100 mi | $60,000 | +$7,500 | +11.11% | 95.44% | 4.56% |
| 2015 | 53,875 mi | $56,579 | +$3,421 | +5.7% | 89.99% | 10.01% |
| → Visit 2011 FORD F-350 depreciation page to see full data. | ||||||
Price vs Mileage
The graph below shows how mileage affects the price for 2011 FORD F-350. This data was calculated using sales records from BADVIN database.
The table below shows average price for used 2011 FORD F-350 by mileage and number of sales.
You can scroll the table horizontally to see all columns.
| Mileage | Average Price | Sample Size |
|---|---|---|
| 10,000 mi | $33,685 | 25 sales |
| 20,000 mi | $47,980 | 13 sales |
| 25,000 mi | $33,999 | 42 sales |
| 30,000 mi | $34,995 | 31 sales |
| 35,000 mi | $29,984 | 33 sales |
| 40,000 mi | $34,995 | 45 sales |
| → Visit 2011 FORD F-350 depreciation page to see full data. | ||
Get FULL ACCESS to the vehicle history report and see all blurred info.
⭐ Read 206+ reviews from our customers who used BADVIN to avoid buying junk vehicles.
Testimonials from our customers
I import used luxury cars from US auctions to resell in Russia. The vehicle history reports from badVIN are essential for avoiding problem cars. For a BMW I was bidding on, it uncovered a salvage title from flood damage that other reports missed! That alone pays for the service.

Dmitry Volkov
verified on Trustpilot
Bad Vin's vehicle history report showed that the 2018 Audi A4 I was about to buy had been in a major accident that was not disclosed by the seller. The severity analysis helped me avoid a bad purchase. Great service!
Sophie Dubois
verified on Trustpilot
As a car dealer importing vehicles from the US to Mexico, I rely on badvin for comprehensive history reports before bidding at auctions. Their info has helped me avoid several salvage vehicles and is more thorough than carfax. A must-have service!
Javier Ramirez
verified on Trustpilot
After a bad experience buying a used car that turned out to have major issues, I now use Bad VIN to thoroughly check every vehicle i consider. It costs a bit more than other services but the detailed records and photos of past sales are wotrh it for the added peace of mind.
Olivia Johnson
verified on Trustpilot
Compare to other 2011 FORD F-350


Other vehicles sales records


Frequently asked questions
A vehicle history report may provide detailed information about a vehicle's past, including ownership, service history, and any significant incidents like accidents or theft, depending on data availability.
A VIN decoder translates the 17-character Vehicle Identification Number into understandable information about the vehicle's specifications and history.
Economic downturns can lead to decreased demand and lower resale values for vehicles, as buyers may defer purchasing vehicles or opt for less expensive alternatives.
The market value of a vehicle is calculated based on its historical depreciation trends, current condition, mileage, and market trends.
Refurbished status, if recorded, is detailed with information on parts replaced and upgrades made, affecting the resale value and reliability of the 2011 FORD.
Depreciation, which reflects the decline in a 2011 FORD vehicle's value over time due to factors like age, mileage, and condition, may directly impact its resale value, based on recorded information.
Crashed status, if reported, details past accidents and collisions, essential for evaluating the operational history and current state of the 2011 FORD.
The parts content information on a window sticker shows the percentage of vehicle components sourced from specific countries, important for consumers interested in the origin of their vehicle's parts.
The exterior and interior condition of vehicles significantly affects their depreciation, as well-maintained vehicles generally retain more value.
Hail damage, if noted, is detailed with specifics on the impact to the body and glass, which can affect the aesthetic and structural integrity of the 2011 FORD.


