
BADVIN vehicle history report for
2010 FORD EXPLORERVIN: 1FMEU3BE9AUF03374
Get FULL ACCESS to the vehicle history report and see all blurred info.
⭐ Read 206+ reviews from our customers who used BADVIN to avoid buying junk vehicles.
Historical Records
events
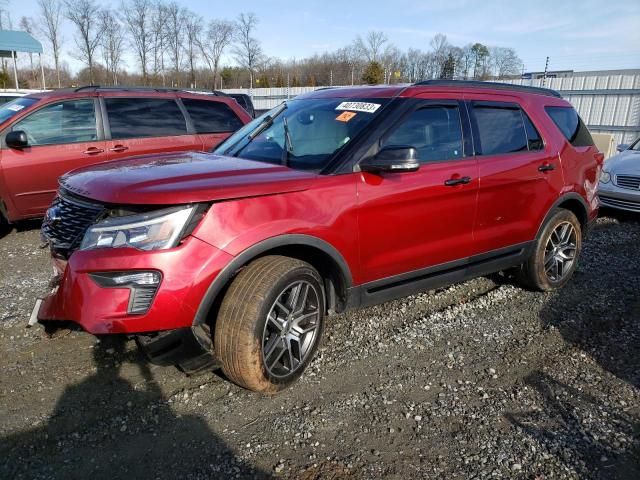
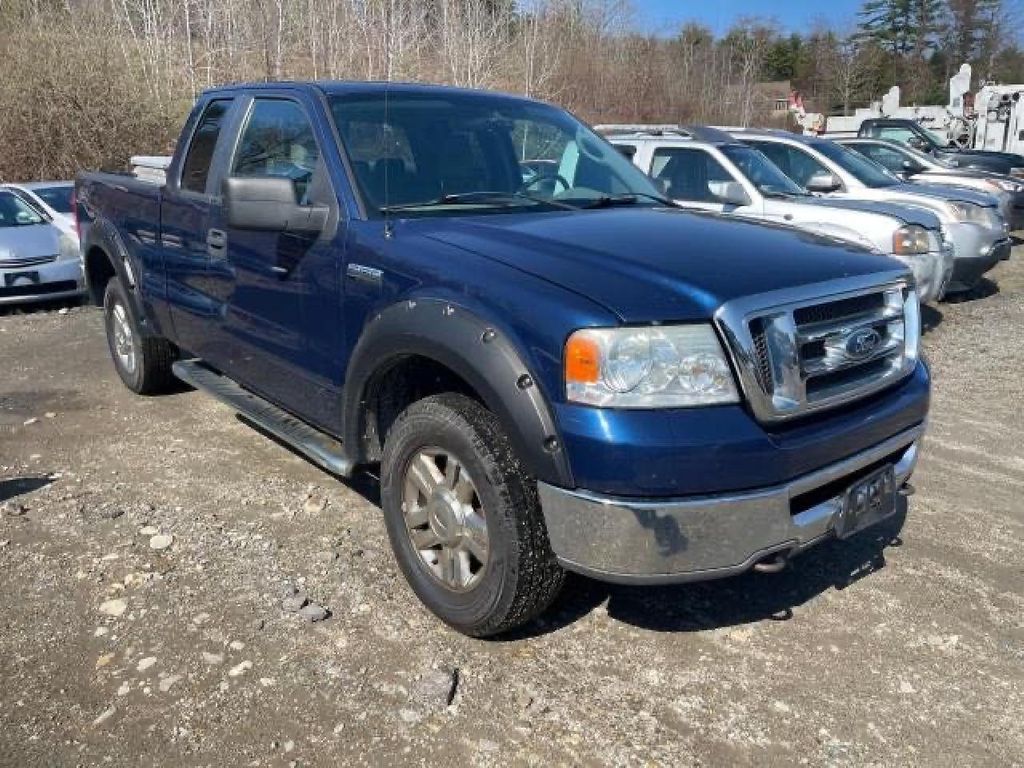
Photos
10 images
Sales History
1 records
Sale Prices
1 records
Market report
Price analytics
Historical Records
Historical records may include service and maintenance records, title status (clean, junk, salvage), insurance records, number of owners, registration events and states, and other information.
You can find more information about historical records in BADVIN reports and see more examples here.
Available historical records for VIN 1FMEU3BE9AUF03374
Latest reported mileage: 961 mi
Below you can see some examples of what these records could look like.
2023-07-09
a year ago
73,316 mi
Odometer reading reported
2021-10-01
3 years ago
18,223 mi
New owner reported
REBUILT TITLE ISSUED
REBUILT TITLE ISSUED
2020-09-04
4 years ago
32,840 mi
Duplicate title issued
REBUILT TITLE ISSUED
REBUILT TITLE ISSUED
Sale Record
2010 FORD EXPLORER SPORT TRAC XLT
sold
| Year | 2010 |
| Title | Hidden text (Hidden text) |
| ODO | — (Hidden text) |
| Damage | Hidden text, Hidden text |
| Estimated Retail Value | $4423 |
| Estimated Repair Cost | $2730 (960%) |
| Seller | Hidden text |
| Location | JACKSONVILLE NORTH, FL, 32099 |
| Date | ended 2 years ago |
| Sale Website Type | salvage or insurance auction |
sale information provided by user #468563


All photos above are REAL and display ACTUAL car. After you get the report you will see full resolution photos.
Tech Specs
| Color | GRAY |
| Transmission | AUTOMATIC |
| Engine | 4.0L 6 |
| Drive | Rear-wheel drive |
| Fuel Type | GAS |
Model Analytics & Market Report
We've analyzed more than 19,300 sales records of this model and here are some numbers.
The average price for new (MSRP) 2010 FORD EXPLORER in 2010 was $43,180.
The average price for used 2010 FORD EXPLORER nowadays in 2024 is $9,786 which is 23% from the original price.
Estimated mileage driven per year is 10,414 miles.
For this model we also have depreciation curve, photos, list of features and options, and other analytics.
Take a look at 2010 FORD EXPLORER model page in BADVIN vehicles catalog.
Depreciation
The graph below is a depreciation curve for 2010 FORD EXPLORER. It shows how much this model looses per year in price. This analytics is calculated using sales records from BADVIN database.
The table below shows average price for used 2010 FORD EXPLORER in each year since the year of manufacturing, current year price and projected price in the future years.
You can scroll the table horizontally to see all columns.
| Year | Average Mileage | Average Price | % Left | % Lost | ||
|---|---|---|---|---|---|---|
| 2010 MSRP | 0 mi | $43,180 | — | — | 100% | 0% |
| 2010 | 10,414 mi | $46,166 | −$2,986 | −6.92% | 106.92% | -6.92% |
| 2011 | 20,828 mi | $38,000 | +$8,166 | +17.69% | 88% | 12% |
| 2012 | 31,242 mi | $34,383 | +$3,617 | +9.52% | 79.63% | 20.37% |
| 2013 | 41,656 mi | $30,995 | +$3,388 | +9.85% | 71.78% | 28.22% |
| 2014 | 52,070 mi | $28,998 | +$1,997 | +6.44% | 67.16% | 32.84% |
| → Visit 2010 FORD EXPLORER depreciation page to see full data. | ||||||
Price vs Mileage
The graph below shows how mileage affects the price for 2010 FORD EXPLORER. This data was calculated using sales records from BADVIN database.
The table below shows average price for used 2010 FORD EXPLORER by mileage and number of sales.
You can scroll the table horizontally to see all columns.
| Mileage | Average Price | Sample Size |
|---|---|---|
| 25,000 mi | $17,595 | 11 sales |
| 40,000 mi | $15,975 | 21 sales |
| 45,000 mi | $17,975 | 48 sales |
| 50,000 mi | $19,289 | 35 sales |
| 55,000 mi | $14,990 | 162 sales |
| 60,000 mi | $19,990 | 109 sales |
| → Visit 2010 FORD EXPLORER depreciation page to see full data. | ||
Get FULL ACCESS to the vehicle history report and see all blurred info.
⭐ Read 206+ reviews from our customers who used BADVIN to avoid buying junk vehicles.
Testimonials from our customers
As a first time used car buyer, I was nervous about getting ripped off. The vehicle report from badvin gave me so much more confidence - it confirmed the car had a clean history and the mileage lined up. Such a relief to have that peace of mind.

Chloe Martin
verified on Trustpilot
As a used car dealer, I rely on badvin.org for checking every vehicle I'm considering purchasing at auction. The comprehensive reports give me peace of mind and help me avoid problem cars. Photos of past sales have saved me from overpaying many times. Worth every penny!
Misha
verified on Trustpilot
I've tried a bunch of different vehicle history reports over the years and badvin.org has been the most comprehensive by far. Stuff like service records, ownership history, lien and repo info that I haven't found elsewhere. Def go-to resource when shopping for used vehicles now.
Levi Johnson
verified on Trustpilot
I've tried many vehicle reports but badvin's is by far the most comprehensive. It shows accident photos, past sales, repairs and so much more. I won't buy a car now without getting a report first. It's a must-have.
Alexander Hunt
verified on Trustpilot
Compare to other 2010 FORD EXPLORER


2013 FORD EXPLORER
a month ago, 128,734 mi
est retail value $16,050
buy now price $3,000
VIN 1FM5K8F8XDGB92290

2014 FORD EXPLORER
19 days ago, 157,674 mi
est retail value $10,900
buy now price $2,000
VIN 1FM5K7D83EGB33029


2016 FORD EXPLORER
a month ago, 64,874 mi
est retail value $20,514
buy now price $4,500
VIN 1FM5K8F80GGC09117


2019 FORD EXPLORER
a month ago, 91,869 mi
est retail value $26,473
buy now price $7,400
VIN 1FM5K8D88KGA77820
2018 FORD EXPLORER
a month ago, 77,632 mi
est retail value $29,240
buy now price $3,750
VIN 1FM5K8GT6JGA85350


Other vehicles sales records

2012 FORD F450
14 days ago, 224,953 mi
est retail value $19,340
buy now price $1,600
VIN 1FDUF4HY2CED10705


Frequently asked questions
Technology plays a significant role in the depreciation of vehicles, as models with outdated tech depreciate faster due to lower consumer demand for older features.
Discrepancies between a window sticker and actual dealer pricing can occur due to additional dealer markup, optional add-ons not included in the sticker, or regional pricing differences.
The window sticker details the destination charges for a 2010 FORD EXPLORER, which are the fees associated with delivering the vehicle from the manufacturer to the dealership.
Our vehicle history reports may indicate if the 2010 FORD vehicle was previously used in commercial services like a taxi or rental car, which may affect its condition and value, if such usage is recorded.
The Monroney label can indirectly reflect the resale value of 2010 FORD vehicles by detailing features and specifications that are valued in the used car market.
Yes, the window sticker includes environmental ratings such as greenhouse gas scores and smog ratings, which reflect the vehicle's environmental impact.
Fire damage, if reported, is detailed with specifics on affected areas and severity, important for assessing the repair quality and safety of the 2010 FORD.
Our reports may provide comprehensive details about any accidents the 2010 FORD EXPLORER has been involved in, including the extent of damage and repairs, if data is available.
Gray market status, if noted, indicates the 2010 FORD was imported outside official channels, potentially affecting its compliance with local regulations and parts availability.
Frame damage can indicate severe impacts and is critical to the structural integrity and safety of the 2010 FORD vehicle, if such damage is documented.


