
BADVIN vehicle history report for
2016 FORD EXPLORERVIN: 1FM5K8HTXGGC57872
Get FULL ACCESS to the vehicle history report and see all blurred info.
⭐ Read 205+ reviews from our customers who used BADVIN to avoid buying junk vehicles.
Historical Records
events
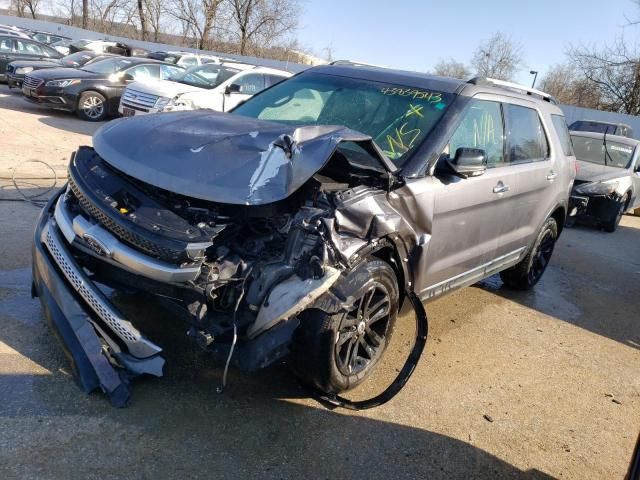
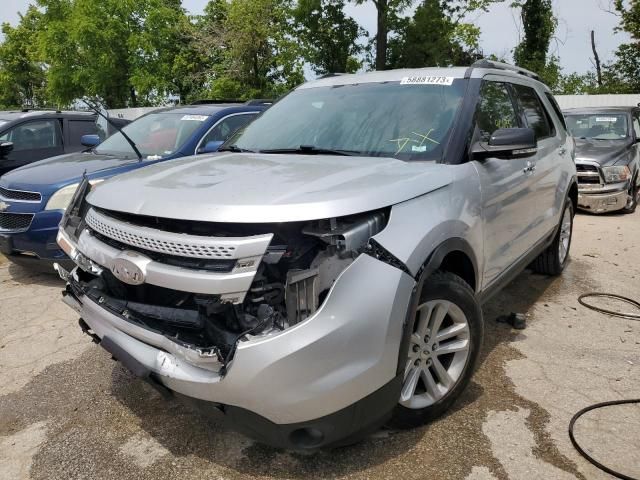
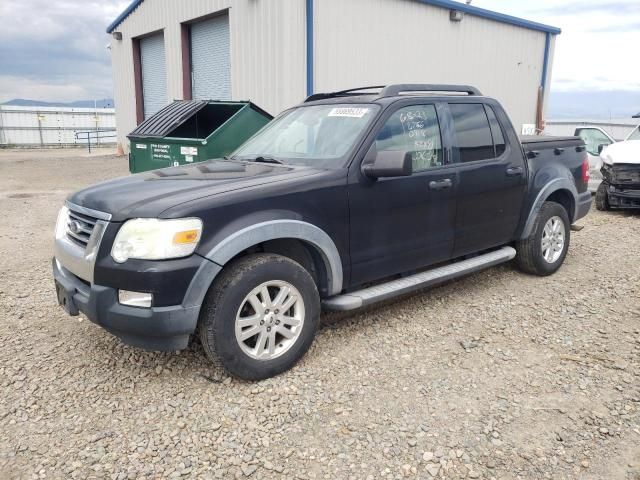
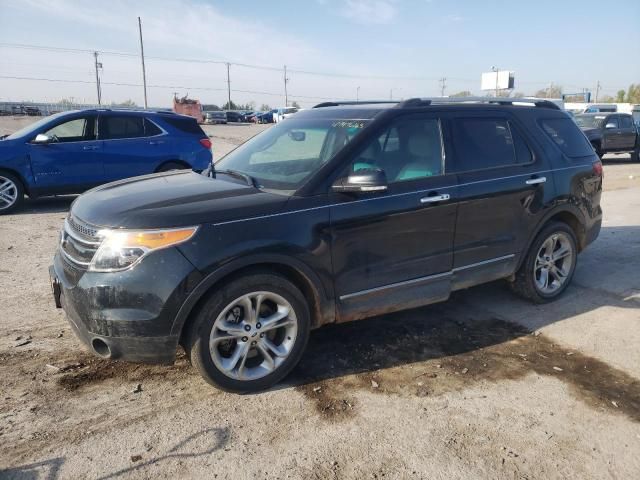
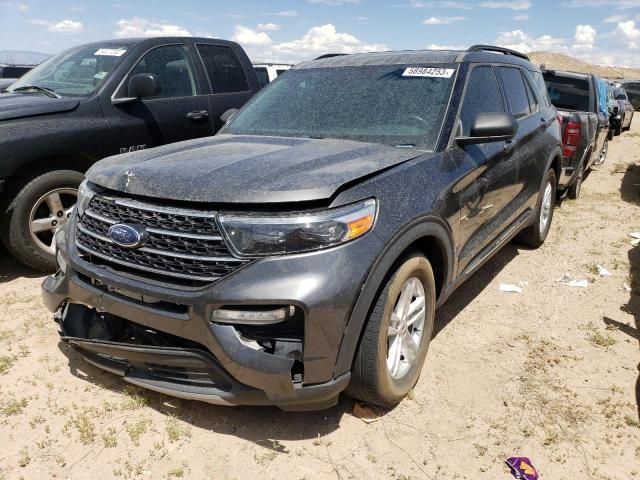
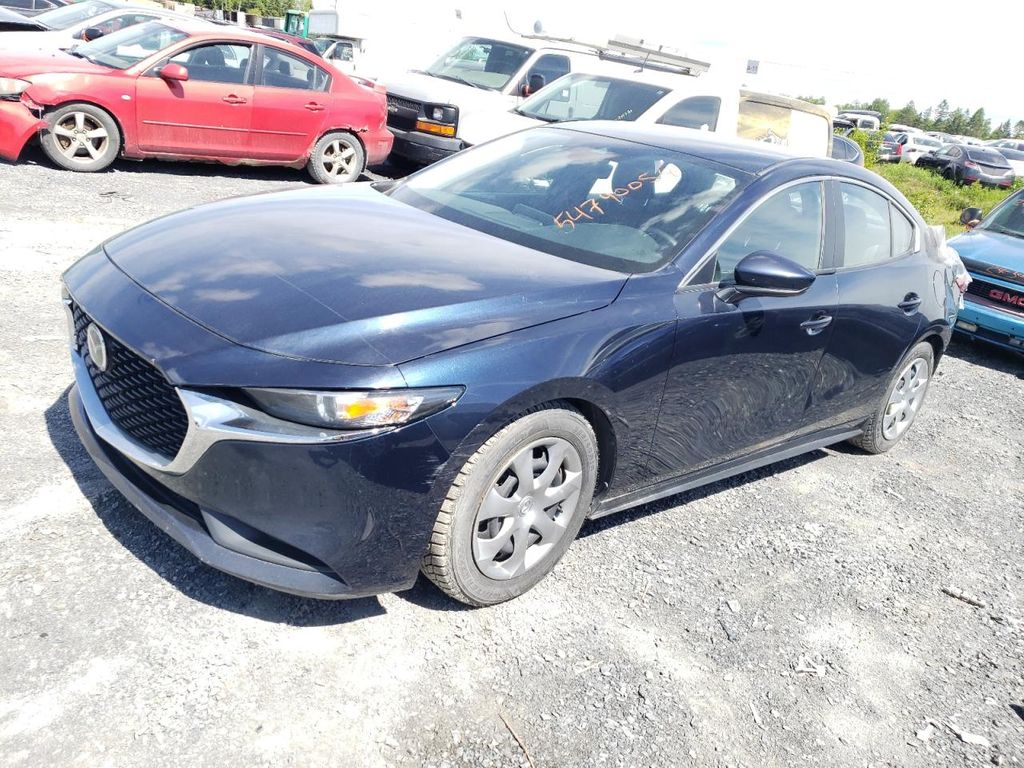
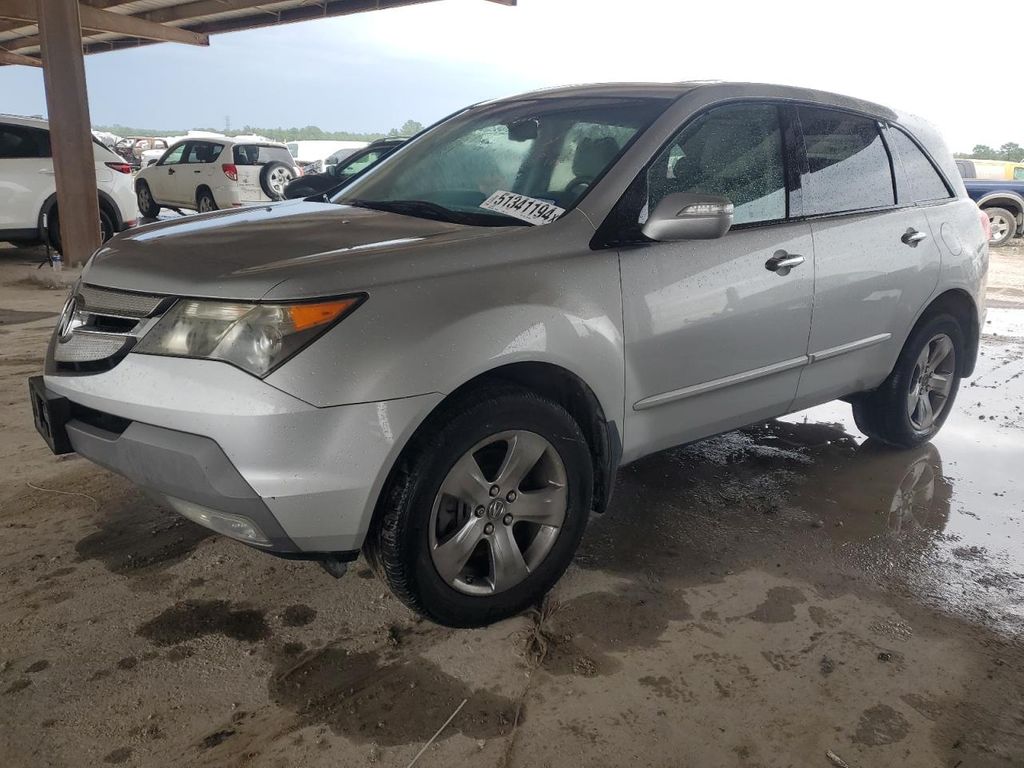
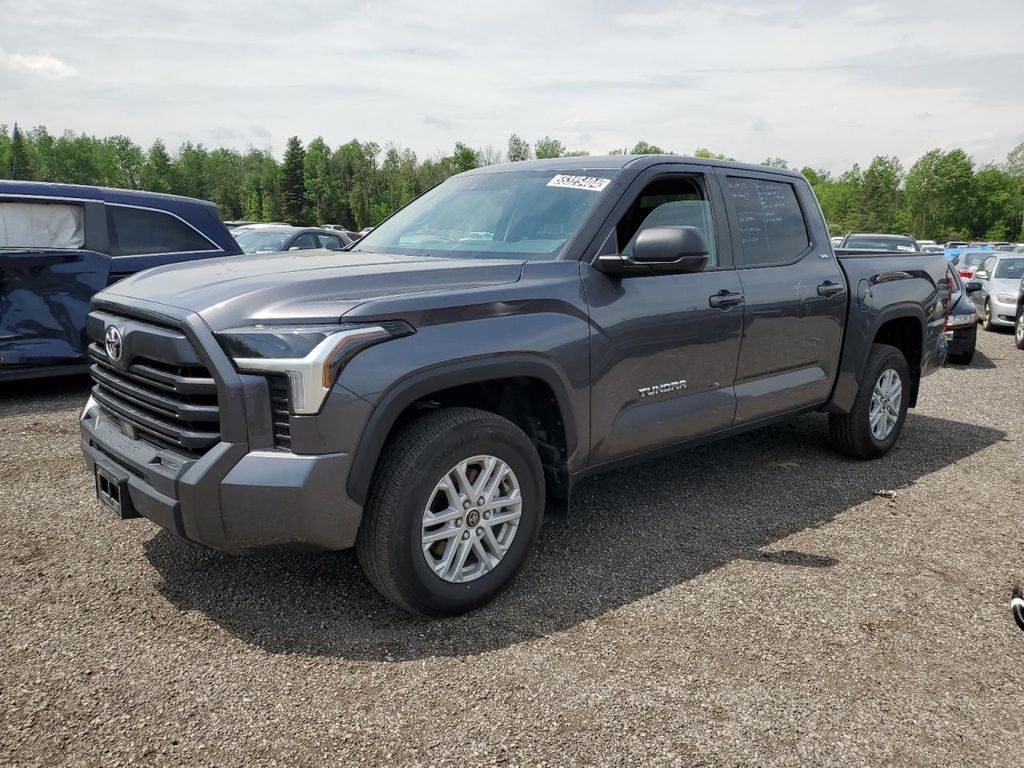
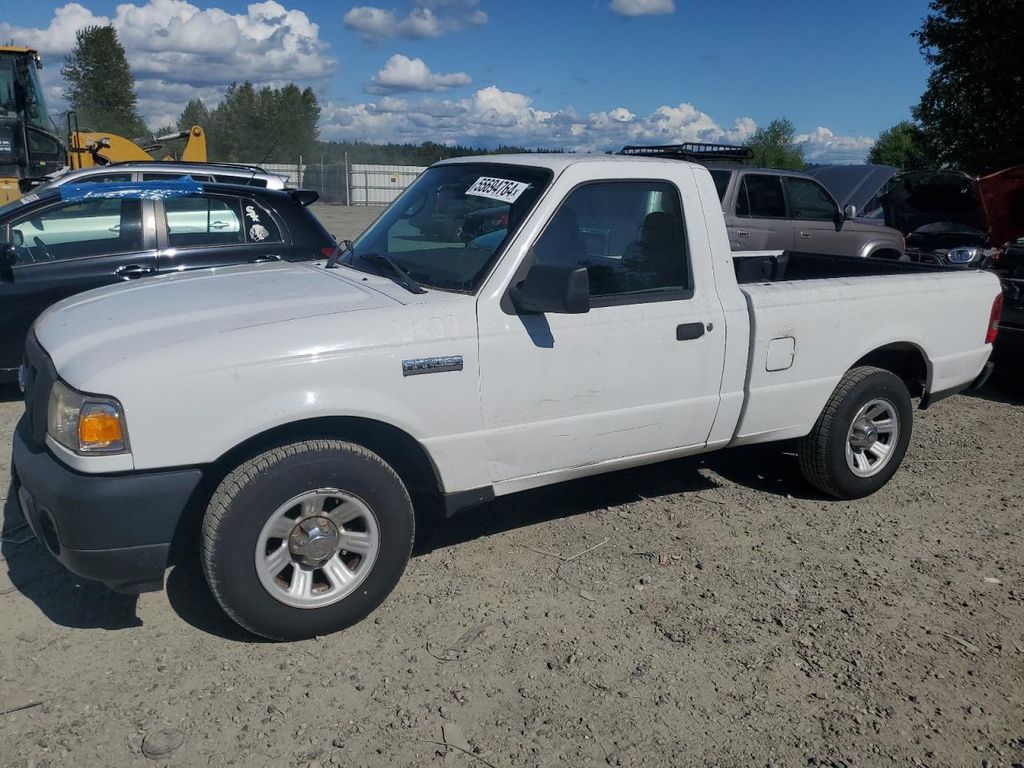
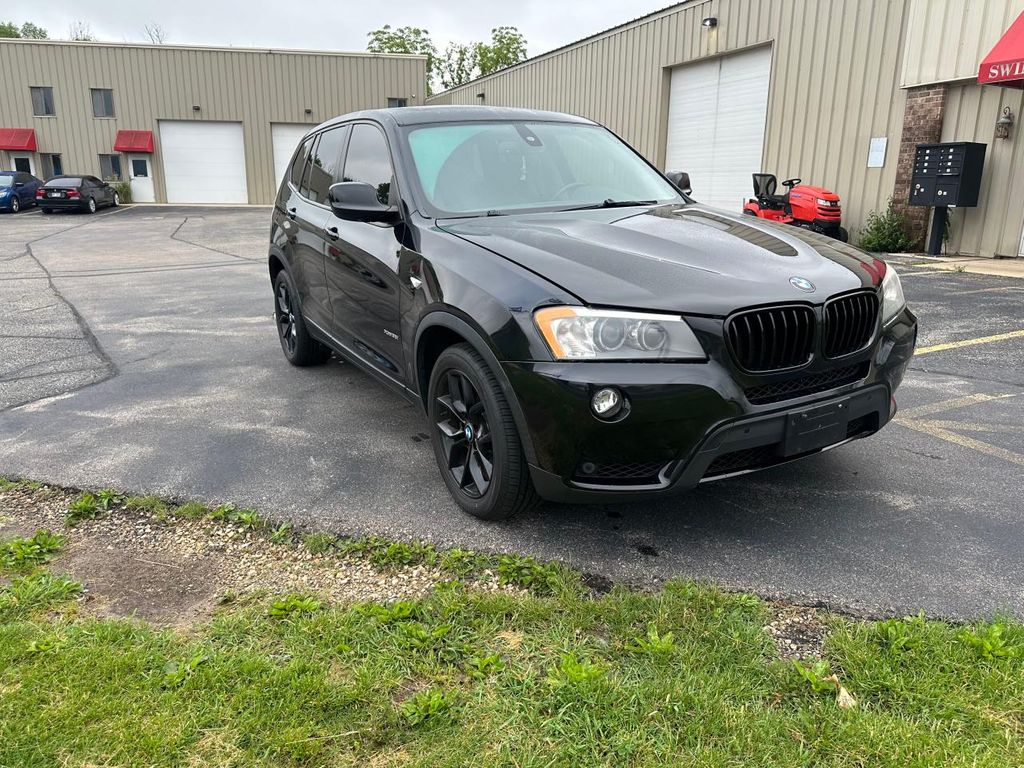
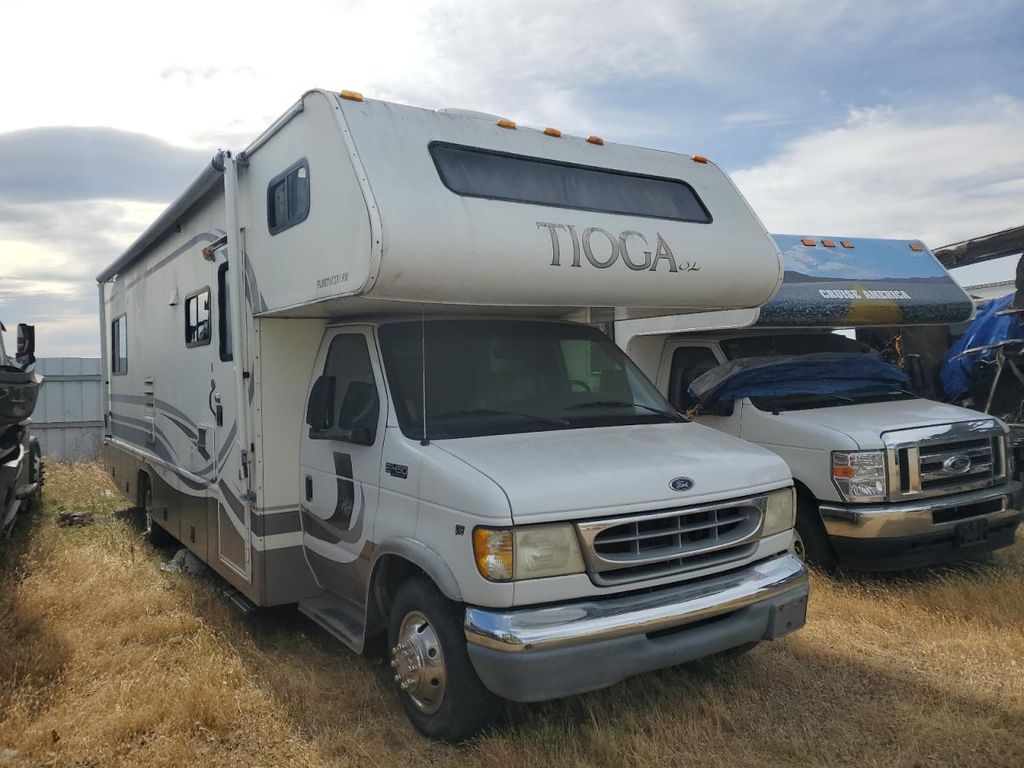
Photos
12 images
Sales History
1 records
Market report
Price analytics
Historical Records
Historical records may include service and maintenance records, title status (clean, junk, salvage), insurance records, number of owners, registration events and states, and other information.
You can find more information about historical records in BADVIN reports and see more examples here.
Available historical records for VIN 1FM5K8HTXGGC57872
Latest reported mileage: 520 mi
Below you can see some examples of what these records could look like.
2023-09-29
8 months ago
98,510 mi
Fire damage reported: minor damage
Vandalism damage reported
Damage to front
Vandalism damage reported
Damage to front
2022-06-18
2 years ago
22,158 mi
Vehicle sold
MILEAGE INCONSISTENCY
MILEAGE INCONSISTENCY
2019-11-24
5 years ago
30,719 mi
SALVAGE TITLE/CERTIFICATE ISSUED
Sale Record
| Year | 2016 |
| Title | Hidden text (Hidden text) |
| ODO | 8998 mi (Hidden text) |
| Damage | Hidden text |
| Estimated Retail Value | $3815 |
| Location | Wilmer, TX, USA, 75172 |
| Date | ended a month ago |
| Sale Website Type | salvage or insurance auction |
sale information provided by user #968367


All photos above are REAL and display ACTUAL car. After you get the report you will see full resolution photos.
Tech Specs
| Color | WHITE |
| Transmission | AUTOMATIC |
| Engine | 3.5L |
| Cylinders | 6 |
| Drive | 4x4 w/Front Whl Drv |
| Fuel Type | GAS |
Model Analytics & Market Report
We've analyzed more than 159,000 sales records of this model and here are some numbers.
The average price for new (MSRP) 2016 FORD EXPLORER in 2016 was $43,180.
The average price for used 2016 FORD EXPLORER nowadays in 2024 is $16,999 which is 39% from the original price.
Estimated mileage driven per year is 10,414 miles.
For this model we also have depreciation curve, photos, list of features and options, and other analytics.
Take a look at 2016 FORD EXPLORER model page in BADVIN vehicles catalog.
Depreciation
The graph below is a depreciation curve for 2016 FORD EXPLORER. It shows how much this model looses per year in price. This analytics is calculated using sales records from BADVIN database.
The table below shows average price for used 2016 FORD EXPLORER in each year since the year of manufacturing, current year price and projected price in the future years.
You can scroll the table horizontally to see all columns.
| Year | Average Mileage | Average Price | % Left | % Lost | ||
|---|---|---|---|---|---|---|
| 2016 MSRP | 0 mi | $43,180 | — | — | 100% | 0% |
| 2016 | 10,414 mi | $46,166 | −$2,986 | −6.92% | 106.92% | -6.92% |
| 2017 | 20,828 mi | $38,000 | +$8,166 | +17.69% | 88% | 12% |
| 2018 | 31,242 mi | $34,383 | +$3,617 | +9.52% | 79.63% | 20.37% |
| 2019 | 41,656 mi | $30,995 | +$3,388 | +9.85% | 71.78% | 28.22% |
| 2020 | 52,070 mi | $28,998 | +$1,997 | +6.44% | 67.16% | 32.84% |
| → Visit 2016 FORD EXPLORER depreciation page to see full data. | ||||||
Price vs Mileage
The graph below shows how mileage affects the price for 2016 FORD EXPLORER. This data was calculated using sales records from BADVIN database.
The table below shows average price for used 2016 FORD EXPLORER by mileage and number of sales.
You can scroll the table horizontally to see all columns.
| Mileage | Average Price | Sample Size |
|---|---|---|
| 20,000 mi | $24,998 | 11 sales |
| 30,000 mi | $20,995 | 10 sales |
| 35,000 mi | $22,998 | 27 sales |
| 40,000 mi | $21,379 | 29 sales |
| 45,000 mi | $21,937 | 45 sales |
| 50,000 mi | $21,990 | 60 sales |
| → Visit 2016 FORD EXPLORER depreciation page to see full data. | ||
Get FULL ACCESS to the vehicle history report and see all blurred info.
⭐ Read 205+ reviews from our customers who used BADVIN to avoid buying junk vehicles.
Testimonials from our customers
Was shopping for a used Range Rover and found one that seemed suspiciously cheap. The badVIN report revealed it had been in a major front end collision, with photos showing the damage. Steered clear of that one and saved myself a ton of headaches!!

Ava Patel
verified on Trustpilot
Can't believe what badvin found on a used 2012 chevy silverado I almost bought - odometer had been rolled back 50k miles according to the mileage history! Carfax didnt show nething bout that. So glad I checked here first b4 handing over my hard earned $$
Jackson
verified on Trustpilot
I always rely on badvin to check out any used car before I buy. It gives such a complete history, including past accidents, service records, recalls and much more. Feel so much more confident as a used car shopper having this info.
Sofia Garcia
verified on Trustpilot
Was about to buy a used 2016 Camry but decided to get the badvin report first. Turns out the car had been in a serious crash and was declared a total loss by insurance, even tho carfax showed it as clean! Dodged a bullet on that one. ty badvin
Jessica Nguyen
verified on Trustpilot
Compare to other 2016 FORD EXPLORER


2017 FORD EXPLORER
a month ago, 85,980 mi
est retail value $16,450
buy now price $6,000
VIN 1FM5K8AR7HGB40914


2020 FORD EXPLORER
a month ago, 30,437 mi
est retail value $34,177
buy now price $11,900
VIN 1FMSK8DH8LGC17840

2023 FORD EXPLORER
in 2 days, 8,833 mi
est retail value $38,933
buy now price $26,200
VIN 1FMSK7DH0PGB18087

2022 FORD EXPLORER
a month ago, 23,738 mi
est retail value $44,766
buy now price $22,000
VIN 1FMSK8FH3NGA94447

Other vehicles sales records

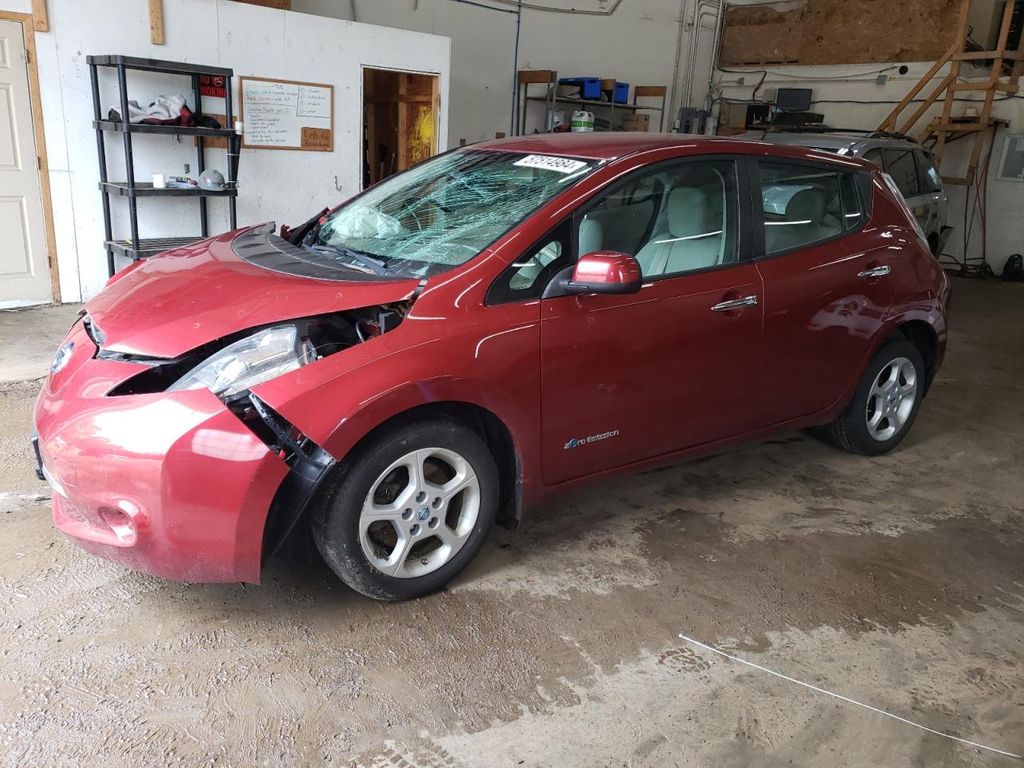
2014 NISSAN LEAF
in 3 days, 95,558 mi
est retail value $4,925
buy now price $1,989
VIN 1N4AZ0CP0EC338433
Frequently asked questions
Emission inspection status may show whether the 2016 FORD vehicle has passed required state emissions testing, which is essential for registration in many areas, if such inspections have been documented.
If available, auction photos may be included in our reports, providing a glimpse into the 2016 FORD vehicle’s condition and appearance at the time of sale.
Accident reports might detail the occurrence, damage severity, and repairs, offering insights into the operational history of the 2016 FORD, if such data is documented.
Our reports might specify the point of impact and damage location on the 2016 FORD vehicle, offering a clearer understanding of the accident, if such details are available.
Economic downturns can lead to decreased demand and lower resale values for vehicles, as buyers may defer purchasing vehicles or opt for less expensive alternatives.
Our reports may include information on any past recalls issued for 2016 FORD vehicles, detailing the nature of the recall and whether it was addressed, if data is available.
Safety ratings on the Monroney label include crash test results from agencies like the NHTSA and IIHS, providing an assessment of the vehicle's safety.


