
BADVIN vehicle history report for
2017 FORD EXPLORERVIN: 1FM5K8HT7HGD66551
Get FULL ACCESS to the vehicle history report and see all blurred info.
⭐ Read 206+ reviews from our customers who used BADVIN to avoid buying junk vehicles.
Historical Records
10 events
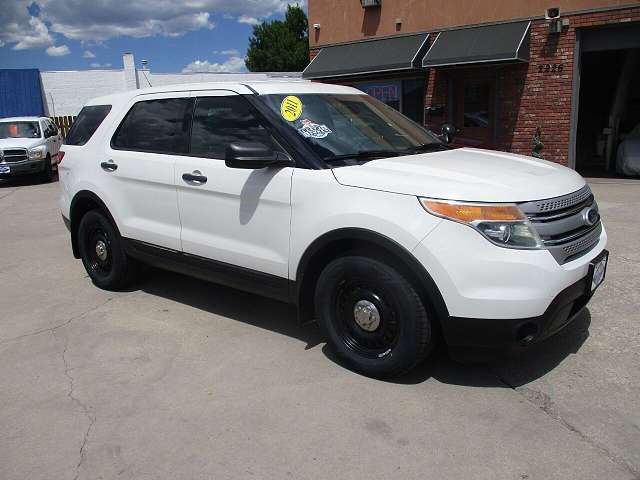
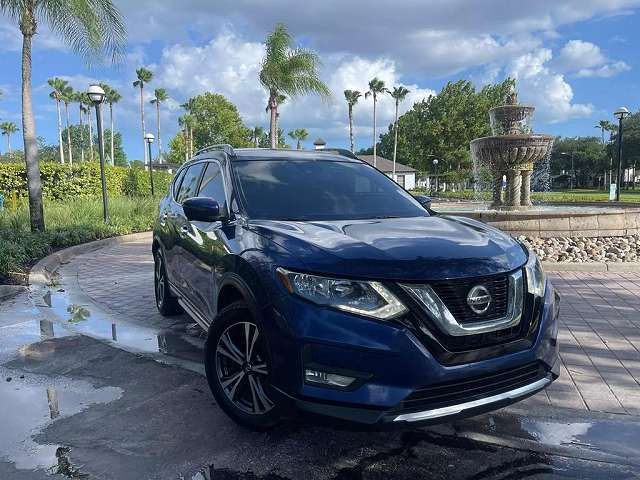
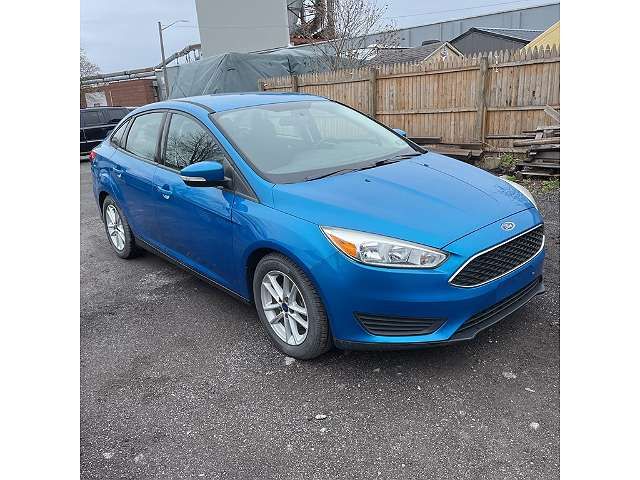
Photos
12 images
Sales History
1 records
Sale Prices
1 records
Market report
Price analytics
Historical Records
Historical records may include service and maintenance records, title status (clean, junk, salvage), insurance records, number of owners, registration events and states, and other information.
You can find more information about historical records in BADVIN reports and see more examples here.
Available 10 historical records for VIN 1FM5K8HT7HGD66551
Latest reported mileage: 3272 mi
Below you can see some examples of what these records could look like.
2023-04-04
a year ago
48,788 mi
TOTAL LOSS VEHICLE
Collision damage reported
Collision damage reported
2022-01-13
2 years ago
16,659 mi
Duplicate title issued
REBUILT TITLE ISSUED
REBUILT TITLE ISSUED
2019-10-24
5 years ago
48,266 mi
SALVAGE TITLE/CERTIFICATE ISSUED
| Year | 2017 |
| ODO | 8753 mi |
| Condition | Hidden text |
| Seller | Hidden text |
| Location | Sandy, OR, 97055 |
| Date | appeared 4 years ago latest price $5840 |
| Price History | |
| Sale Website Type | classifieds |
sale information provided by user #2333


All photos above are REAL and display ACTUAL car. After you get the report you will see full resolution photos.
Tech Specs
| Body Style | SUV |
| Color | Silver |
| Color (Interior) | Black |
| Transmission | Automatic |
| Engine | 3.5 L |
| Cylinders | 6 Cyl |
| Drive | 4WD |
| Fuel Type | Gasoline |
Extra Features
- Navigation System
- Hidden text
- Leather Seats
- Hidden text
- Alloy Wheels
- Hidden text
Standard Features
All these features are based on a model in general. This specific vehicle may differ.
- AM/FM
- Hidden text
- Air Conditioning
- Hidden text
- Cruise Control
- Hidden text
- Front Airbags (Passenger)
- Hidden text
- Front Side Airbags (Driver)
- Hidden text
- Power Mirrors
- Hidden text
- Power Windows
- Hidden text
- Tachometer
Model Analytics & Market Report
We've analyzed more than 248,000 sales records of this model and here are some numbers.
The average price for new (MSRP) 2017 FORD EXPLORER in 2017 was $43,180.
The average price for used 2017 FORD EXPLORER nowadays in 2024 is $18,995 which is 44% from the original price.
Estimated mileage driven per year is 10,414 miles.
For this model we also have depreciation curve, photos, list of features and options, and other analytics.
Take a look at 2017 FORD EXPLORER model page in BADVIN vehicles catalog.
Depreciation
The graph below is a depreciation curve for 2017 FORD EXPLORER. It shows how much this model looses per year in price. This analytics is calculated using sales records from BADVIN database.
The table below shows average price for used 2017 FORD EXPLORER in each year since the year of manufacturing, current year price and projected price in the future years.
You can scroll the table horizontally to see all columns.
| Year | Average Mileage | Average Price | % Left | % Lost | ||
|---|---|---|---|---|---|---|
| 2017 MSRP | 0 mi | $43,180 | — | — | 100% | 0% |
| 2017 | 10,414 mi | $46,166 | −$2,986 | −6.92% | 106.92% | -6.92% |
| 2018 | 20,828 mi | $38,000 | +$8,166 | +17.69% | 88% | 12% |
| 2019 | 31,242 mi | $34,383 | +$3,617 | +9.52% | 79.63% | 20.37% |
| 2020 | 41,656 mi | $30,995 | +$3,388 | +9.85% | 71.78% | 28.22% |
| 2021 | 52,070 mi | $28,998 | +$1,997 | +6.44% | 67.16% | 32.84% |
| → Visit 2017 FORD EXPLORER depreciation page to see full data. | ||||||
Price vs Mileage
The graph below shows how mileage affects the price for 2017 FORD EXPLORER. This data was calculated using sales records from BADVIN database.
The table below shows average price for used 2017 FORD EXPLORER by mileage and number of sales.
You can scroll the table horizontally to see all columns.
| Mileage | Average Price | Sample Size |
|---|---|---|
| 20,000 mi | $25,240 | 21 sales |
| 30,000 mi | $24,998 | 32 sales |
| 35,000 mi | $22,983 | 39 sales |
| 40,000 mi | $23,594 | 67 sales |
| 45,000 mi | $22,999 | 103 sales |
| 50,000 mi | $21,910 | 155 sales |
| → Visit 2017 FORD EXPLORER depreciation page to see full data. | ||
Get FULL ACCESS to the vehicle history report and see all blurred info.
⭐ Read 206+ reviews from our customers who used BADVIN to avoid buying junk vehicles.
Testimonials from our customers
After a bad experience buying a used car that turned out to have major issues, I now use Bad VIN to thoroughly check every vehicle i consider. It costs a bit more than other services but the detailed records and photos of past sales are wotrh it for the added peace of mind.

Olivia Johnson
verified on Trustpilot
I import used luxury cars from US auctions to resell in Russia. The vehicle history reports from badVIN are essential for avoiding problem cars. For a BMW I was bidding on, it uncovered a salvage title from flood damage that other reports missed! That alone pays for the service.
Dmitry Volkov
verified on Trustpilot
I almost bought a 2019 Malibu that seemed like a great deal - low miles and price. But the badvin report showed it used to be a rental fleet vehicle, which the seller didn't disclose. Glad I found out before buying someone else's abused rental!
Benjamin Torres
verified on Trustpilot
BadVin's vehicle history report is a must-have before buying any used vehicle. It's saved me from a few lemons over the years - cars that looked great on the surface but had hidden issues like accidents or title problems. Well worth the price.
Camila Santos
verified on Trustpilot
Compare to other 2017 FORD EXPLORER


Other vehicles sales records


Frequently asked questions
Crashed status, if reported, details past accidents and collisions, essential for evaluating the operational history and current state of the 2017 FORD.
A vehicle history report provides past data and records but cannot assess the current physical condition of a vehicle, underscoring the need for an independent inspection before purchase.
You can track the depreciation of your car by monitoring market trends, checking online valuation tools, and staying informed about new model releases.
Odometer issues such as rollbacks or malfunctions raise red flags about potential fraud or misuse in the 2017 FORD vehicle’s history, if such problems are recorded.
The window sticker plays a crucial role in the car buying process by ensuring transparency about the vehicle's features, costs, and certifications, aiding consumers in making informed purchasing decisions.
Sales prices from past transactions may be documented in our reports, providing a price history that aids in determining current market value, if such data is available.
The window sticker benefits car dealers by providing a standardized set of information that aids in promoting transparency and trust with customers, facilitating a smoother sales process.


