
BADVIN vehicle history report for
2017 FORD EXPLORERVIN: 1FM5K8B86HGC88963
Get FULL ACCESS to the vehicle history report and see all blurred info.
⭐ Read 206+ reviews from our customers who used BADVIN to avoid buying junk vehicles.
Historical Records
events
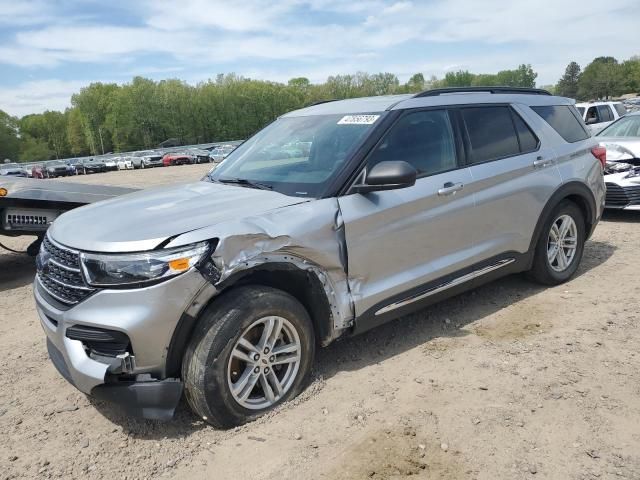
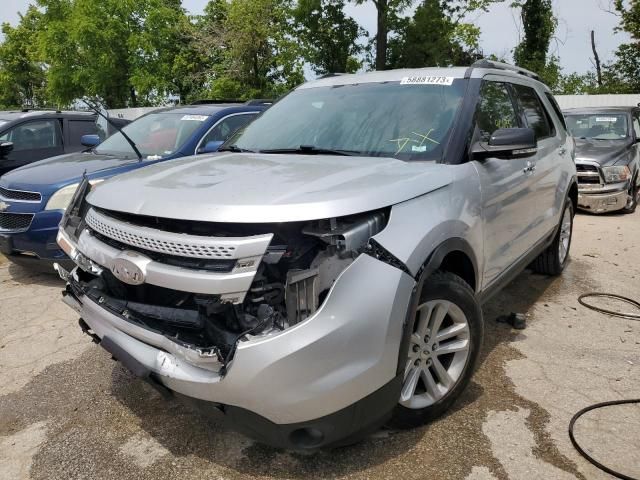
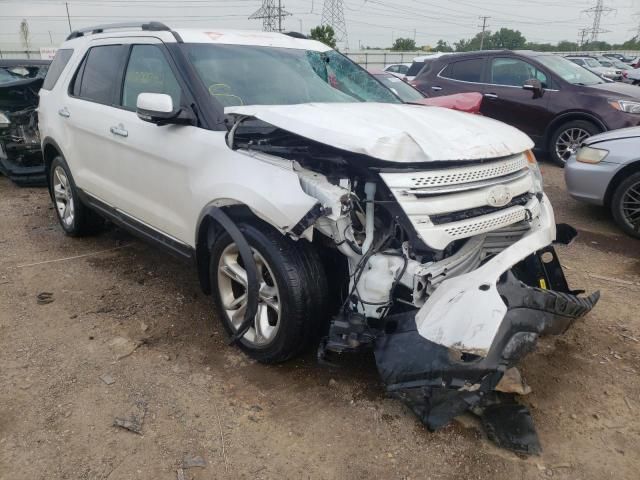
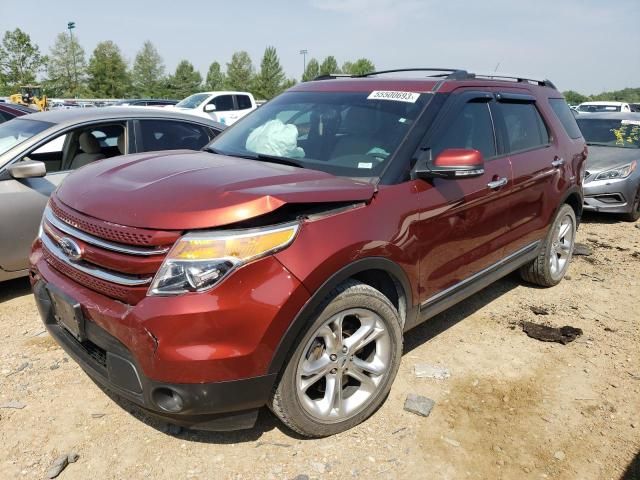
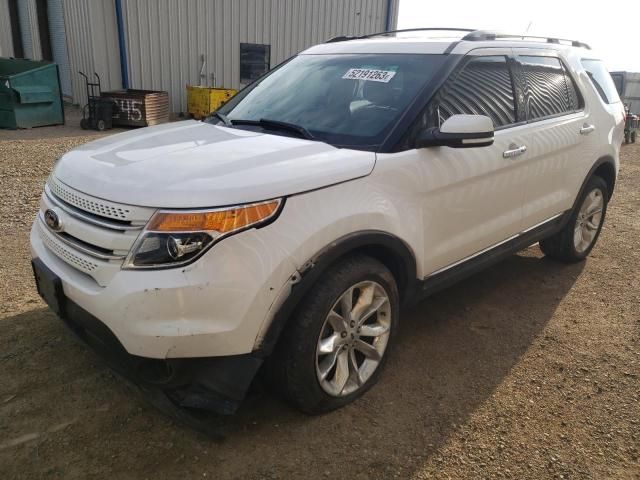
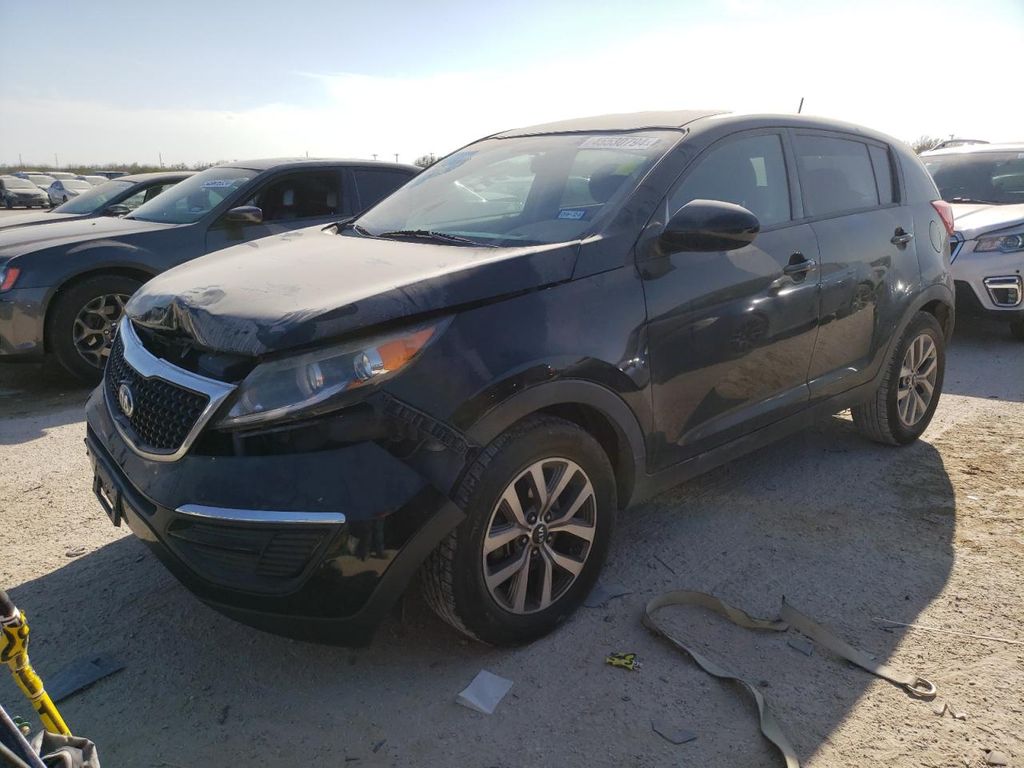
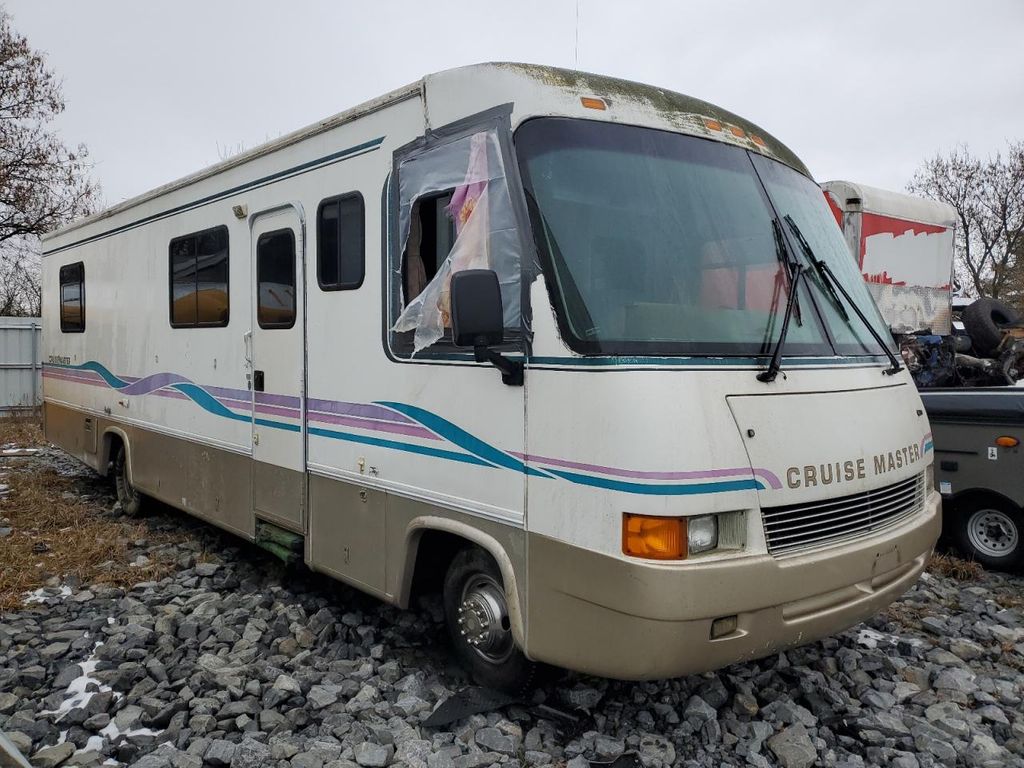
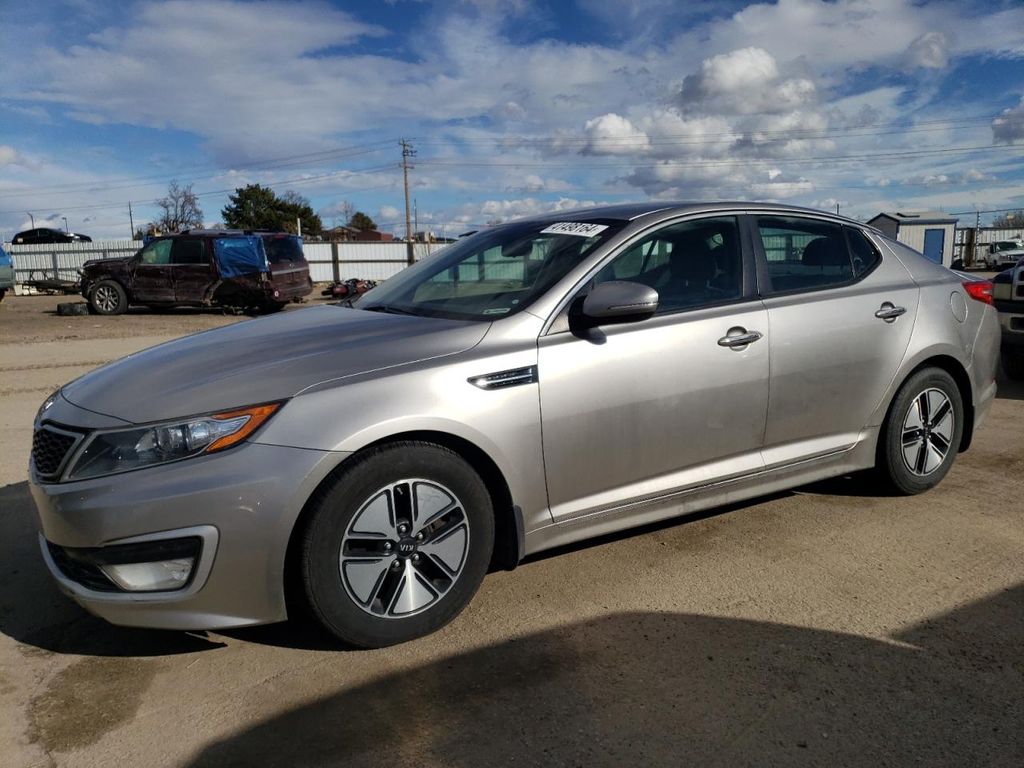
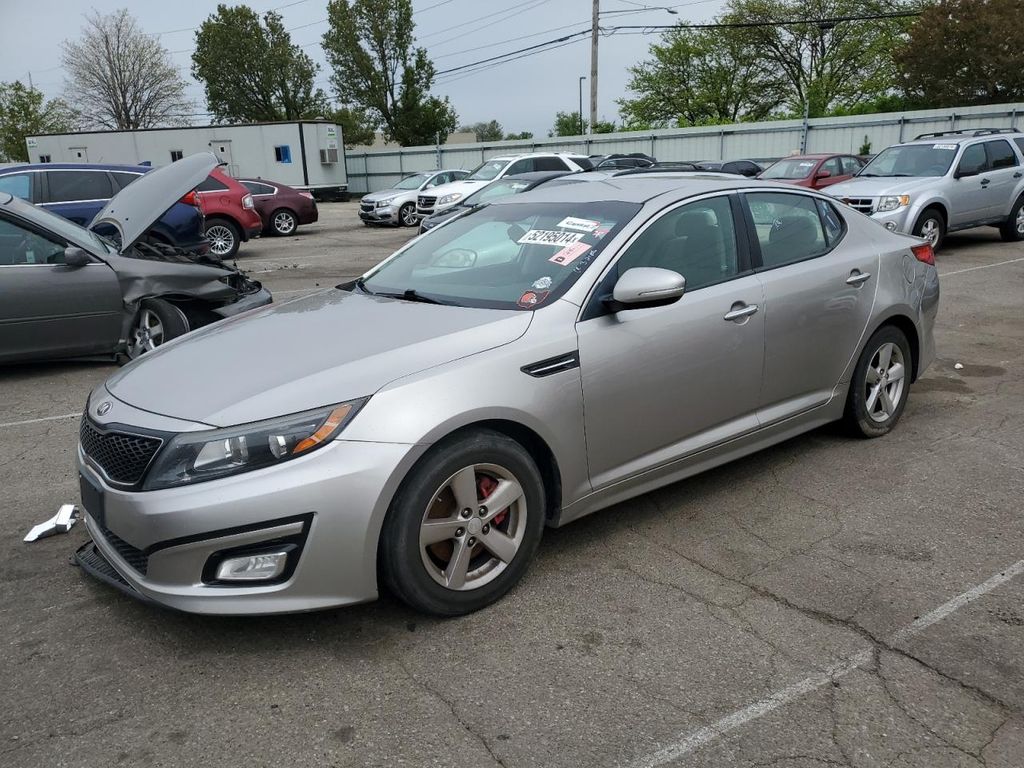
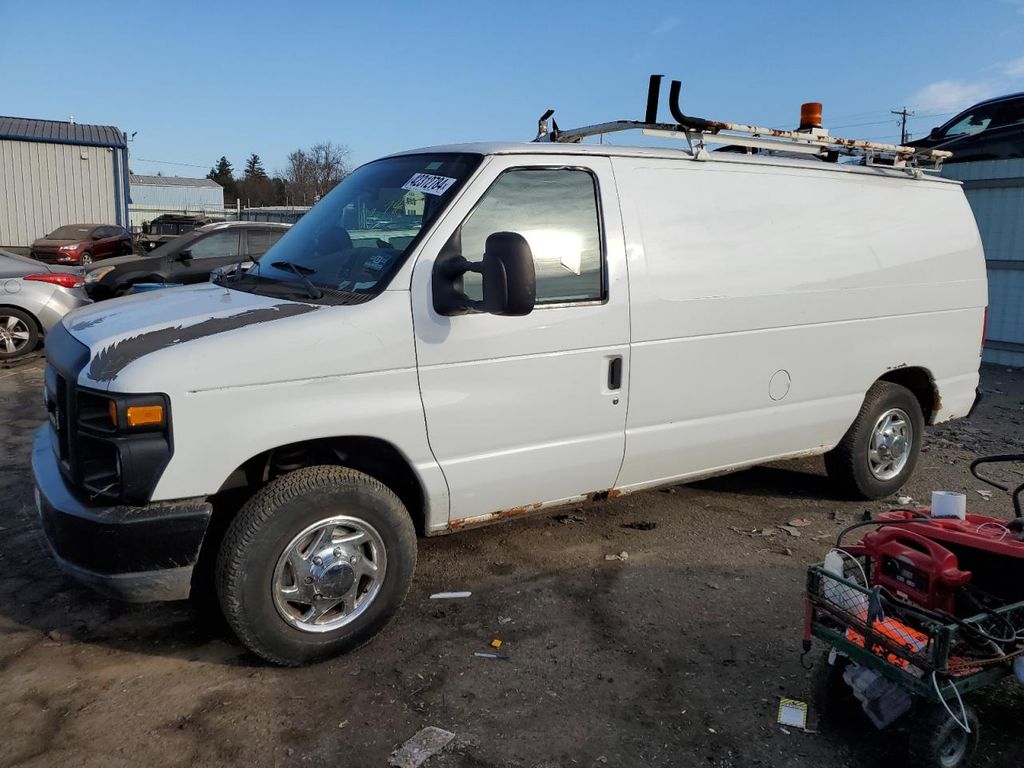
Photos
10 images
Sales History
1 records
Market report
Price analytics
Historical Records
Historical records may include service and maintenance records, title status (clean, junk, salvage), insurance records, number of owners, registration events and states, and other information.
You can find more information about historical records in BADVIN reports and see more examples here.
Available historical records for VIN 1FM5K8B86HGC88963
Latest reported mileage: 175 mi
Below you can see some examples of what these records could look like.
2023-01-03
a year ago
111,645 mi
Damage reported: minor to moderate damage
Damage to right rear
Damage to rear
Damage to right rear
Damage to rear
2022-02-05
2 years ago
22,092 mi
REBUILT TITLE ISSUED
2021-03-31
3 years ago
40,750 mi
Accident reported: minor damage with another motor vehicle
Damage to rear
Damage to rear
Sale Record
Sale Date
2 years ago
Location
Columbus, OH, 43214
2017 FORD EXPLORER
sold
| Year | 2017 |
| ODO | — |
| Location | Columbus, OH, 43214 |
| Date | ended 2 years ago |
| Sale Website Type | salvage or insurance auction |
sale information provided by user #922010


All photos above are REAL and display ACTUAL car. After you get the report you will see full resolution photos.
Tech Specs
Model Analytics & Market Report
We've analyzed more than 248,000 sales records of this model and here are some numbers.
The average price for new (MSRP) 2017 FORD EXPLORER in 2017 was $43,180.
The average price for used 2017 FORD EXPLORER nowadays in 2024 is $18,995 which is 44% from the original price.
Estimated mileage driven per year is 10,414 miles.
For this model we also have depreciation curve, photos, list of features and options, and other analytics.
Take a look at 2017 FORD EXPLORER model page in BADVIN vehicles catalog.
Depreciation
The graph below is a depreciation curve for 2017 FORD EXPLORER. It shows how much this model looses per year in price. This analytics is calculated using sales records from BADVIN database.
The table below shows average price for used 2017 FORD EXPLORER in each year since the year of manufacturing, current year price and projected price in the future years.
You can scroll the table horizontally to see all columns.
| Year | Average Mileage | Average Price | % Left | % Lost | ||
|---|---|---|---|---|---|---|
| 2017 MSRP | 0 mi | $43,180 | — | — | 100% | 0% |
| 2017 | 10,414 mi | $46,166 | −$2,986 | −6.92% | 106.92% | -6.92% |
| 2018 | 20,828 mi | $38,000 | +$8,166 | +17.69% | 88% | 12% |
| 2019 | 31,242 mi | $34,383 | +$3,617 | +9.52% | 79.63% | 20.37% |
| 2020 | 41,656 mi | $30,995 | +$3,388 | +9.85% | 71.78% | 28.22% |
| 2021 | 52,070 mi | $28,998 | +$1,997 | +6.44% | 67.16% | 32.84% |
| → Visit 2017 FORD EXPLORER depreciation page to see full data. | ||||||
Price vs Mileage
The graph below shows how mileage affects the price for 2017 FORD EXPLORER. This data was calculated using sales records from BADVIN database.
The table below shows average price for used 2017 FORD EXPLORER by mileage and number of sales.
You can scroll the table horizontally to see all columns.
| Mileage | Average Price | Sample Size |
|---|---|---|
| 20,000 mi | $25,240 | 21 sales |
| 30,000 mi | $24,998 | 32 sales |
| 35,000 mi | $22,983 | 39 sales |
| 40,000 mi | $23,594 | 67 sales |
| 45,000 mi | $22,999 | 103 sales |
| 50,000 mi | $21,910 | 155 sales |
| → Visit 2017 FORD EXPLORER depreciation page to see full data. | ||
Get FULL ACCESS to the vehicle history report and see all blurred info.
⭐ Read 206+ reviews from our customers who used BADVIN to avoid buying junk vehicles.
Testimonials from our customers
I almost bought a 2019 Malibu that seemed like a great deal - low miles and price. But the badvin report showed it used to be a rental fleet vehicle, which the seller didn't disclose. Glad I found out before buying someone else's abused rental!

Benjamin Torres
verified on Trustpilot
Bad Vin's vehicle history report showed that the 2018 Audi A4 I was about to buy had been in a major accident that was not disclosed by the seller. The severity analysis helped me avoid a bad purchase. Great service!
Sophie Dubois
verified on Trustpilot
I always rely on badvin to check out any used car before I buy. It gives such a complete history, including past accidents, service records, recalls and much more. Feel so much more confident as a used car shopper having this info.
Sofia Garcia
verified on Trustpilot
Was shopping for a used Range Rover and found one that seemed suspiciously cheap. The badVIN report revealed it had been in a major front end collision, with photos showing the damage. Steered clear of that one and saved myself a ton of headaches!!
Ava Patel
verified on Trustpilot
Compare to other 2017 FORD EXPLORER


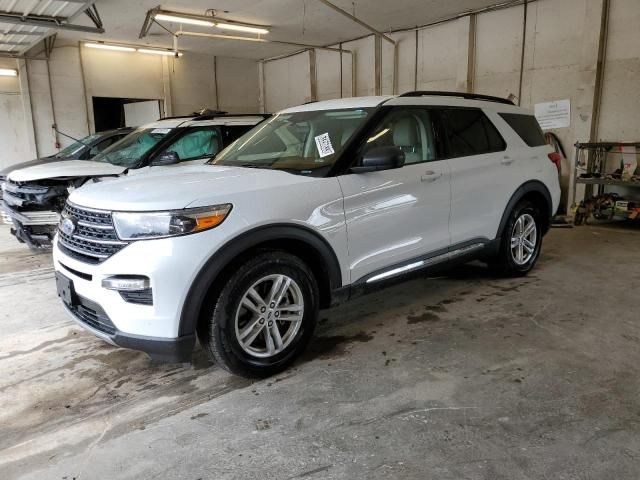
2023 FORD EXPLORER
a day ago, 8,833 mi
est retail value $38,933
buy now price $26,200
VIN 1FMSK7DH0PGB18087

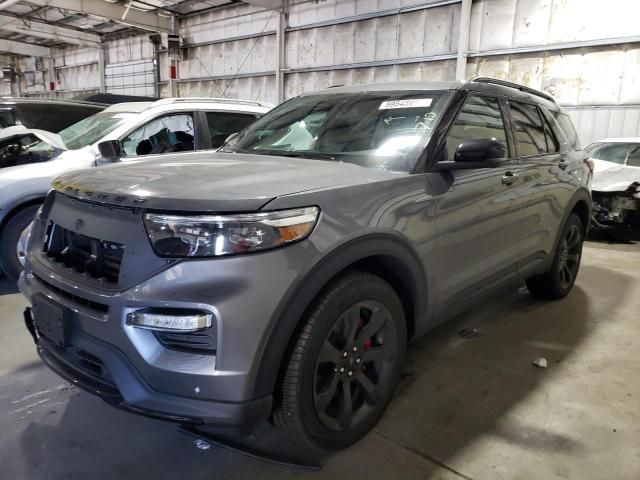
2013 FORD EXPLORER
23 days ago, 128,734 mi
est retail value $16,050
buy now price $3,000
VIN 1FM5K8F8XDGB92290


Other vehicles sales records

2014 FORD FOCUS
in 12 days, 127,461 mi
est retail value $6,325
buy now price $1,500
VIN 1FADP3F24EL428186


Frequently asked questions
No, vehicle history reports do not include personal contact information of previous owners due to privacy regulations.
Economic downturns can lead to decreased demand and lower resale values for vehicles, as buyers may defer purchasing vehicles or opt for less expensive alternatives.
Our reports may detail types of accidents involving the 2017 FORD EXPLORER, such as collision data and impact severity, if available.
Yes, a VIN decoder can provide detailed specifications for a used 2017 FORD EXPLORER, including its assembly line specifications like engine details and optional equipment.
Some models may depreciate faster due to factors like lower demand, higher maintenance costs, or outdated technology compared to newer versions.
Yes, the Monroney label typically lists the exterior color and interior options of the vehicle, providing buyers with specifics about the vehicle’s appearance and styling.


