
BADVIN vehicle history report for
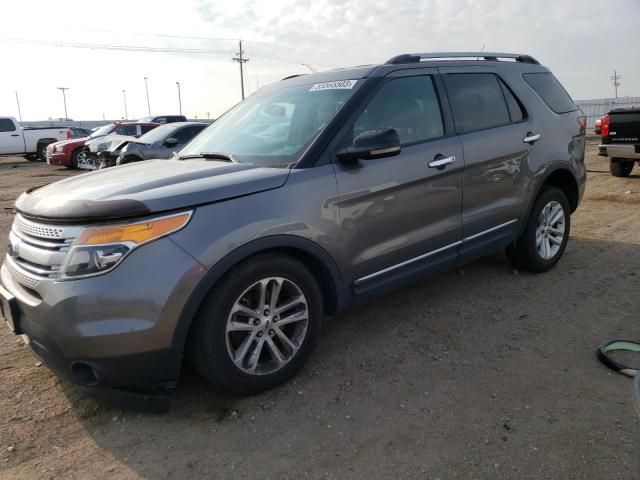
2017 FORD EXPLORERVIN: 1FM5K8AR3HGB33684
Get FULL ACCESS to the vehicle history report and see all blurred info.
⭐ Read 206+ reviews from our customers who used BADVIN to avoid buying junk vehicles.
Historical Records
28 events
Market report
Price analytics
Historical Records
Historical records may include service and maintenance records, title status (clean, junk, salvage), insurance records, number of owners, registration events and states, and other information.
You can find more information about historical records in BADVIN reports and see more examples here.
Available 28 historical records for VIN 1FM5K8AR3HGB33684
Latest reported mileage: 7785 mi
Below you can see some examples of what these records could look like.
2024-01-01
6 months ago
138,449 mi
REBUILT TITLE ISSUED
2021-12-08
3 years ago
24,872 mi
Vehicle serviced
Tire repaired
Tire repaired
2021-04-10
3 years ago
31,394 mi
TOTAL LOSS VEHICLE
Collision damage reported
Collision damage reported
Model Analytics & Market Report
We've analyzed more than 248,000 sales records of this model and here are some numbers.
The average price for new (MSRP) 2017 FORD EXPLORER in 2017 was $43,180.
The average price for used 2017 FORD EXPLORER nowadays in 2024 is $18,995 which is 44% from the original price.
Estimated mileage driven per year is 10,414 miles.
For this model we also have depreciation curve, photos, list of features and options, and other analytics.
Take a look at 2017 FORD EXPLORER model page in BADVIN vehicles catalog.
Depreciation
The graph below is a depreciation curve for 2017 FORD EXPLORER. It shows how much this model looses per year in price. This analytics is calculated using sales records from BADVIN database.
The table below shows average price for used 2017 FORD EXPLORER in each year since the year of manufacturing, current year price and projected price in the future years.
You can scroll the table horizontally to see all columns.
| Year | Average Mileage | Average Price | % Left | % Lost | ||
|---|---|---|---|---|---|---|
| 2017 MSRP | 0 mi | $43,180 | — | — | 100% | 0% |
| 2017 | 10,414 mi | $46,166 | −$2,986 | −6.92% | 106.92% | -6.92% |
| 2018 | 20,828 mi | $38,000 | +$8,166 | +17.69% | 88% | 12% |
| 2019 | 31,242 mi | $34,383 | +$3,617 | +9.52% | 79.63% | 20.37% |
| 2020 | 41,656 mi | $30,995 | +$3,388 | +9.85% | 71.78% | 28.22% |
| 2021 | 52,070 mi | $28,998 | +$1,997 | +6.44% | 67.16% | 32.84% |
| → Visit 2017 FORD EXPLORER depreciation page to see full data. | ||||||
Price vs Mileage
The graph below shows how mileage affects the price for 2017 FORD EXPLORER. This data was calculated using sales records from BADVIN database.
The table below shows average price for used 2017 FORD EXPLORER by mileage and number of sales.
You can scroll the table horizontally to see all columns.
| Mileage | Average Price | Sample Size |
|---|---|---|
| 20,000 mi | $25,240 | 21 sales |
| 30,000 mi | $24,998 | 32 sales |
| 35,000 mi | $22,983 | 39 sales |
| 40,000 mi | $23,594 | 67 sales |
| 45,000 mi | $22,999 | 103 sales |
| 50,000 mi | $21,910 | 155 sales |
| → Visit 2017 FORD EXPLORER depreciation page to see full data. | ||
Testimonials from our customers
I almost bought a 2019 Malibu that seemed like a great deal - low miles and price. But the badvin report showed it used to be a rental fleet vehicle, which the seller didn't disclose. Glad I found out before buying someone else's abused rental!

Benjamin Torres
verified on Trustpilot
After a bad experience buying a used car that turned out to have major issues, I now use Bad VIN to thoroughly check every vehicle i consider. It costs a bit more than other services but the detailed records and photos of past sales are wotrh it for the added peace of mind.
Olivia Johnson
verified on Trustpilot
As a broke college kid I almost settled for a sketchy 2005 Altima cuz it was cheap. but splurged on the report from badvin 1st. soooo glad I did - turned out it had been totalled and rebuilt. spending a little saved me from wasting $1000s!
Sophie
verified on Trustpilot
I always rely on badvin to check out any used car before I buy. It gives such a complete history, including past accidents, service records, recalls and much more. Feel so much more confident as a used car shopper having this info.
Sofia Garcia
verified on Trustpilot
Compare to other 2017 FORD EXPLORER


2023 FORD EXPLORER
2 days ago, 8,833 mi
est retail value $38,933
buy now price $26,200
VIN 1FMSK7DH0PGB18087
2022 FORD EXPLORER
15 days ago, 2,660 mi
est retail value $43,329
buy now price $13,000
VIN 1FMSK8DH8NGC49660


Other vehicles sales records


Frequently asked questions
Yes, in many cases, you can determine the type of drivetrain a 2017 FORD EXPLORER has from its VIN if the manufacturer encodes this information within the VIN.
Mileage is considered a major factor in the depreciation of vehicles because it directly correlates with the amount of use and potential wear and tear the vehicle has undergone.
Results and dates of safety inspections performed may be included in our reports, ensuring you know the safety status of the 2017 FORD vehicle, if inspections have been reported.
The manufacturing location can be interpreted from the first character of the VIN, which indicates the country of assembly, and sometimes more specific location details are included in the first few characters.
You can verify the authenticity of a window sticker on a new car by checking that it includes official data from the manufacturer and matches the vehicle’s VIN and specifications.
A VIN decoder can confirm the safety features originally installed in a 2017 FORD EXPLORER, such as airbags, ABS, and stability control systems.
Lien status may indicate whether there are outstanding financial obligations like loans on the 2017 FORD vehicle, which must be settled before ownership can transfer, if such records exist.
Understanding depreciation is important for car owners to manage financial expectations and make informed decisions about selling or trading in their vehicles at the right time.
Factors to consider when estimating the future resale value include the car's historical depreciation rate, current market trends, overall vehicle condition, and mileage.


