BADVIN vehicle history report for
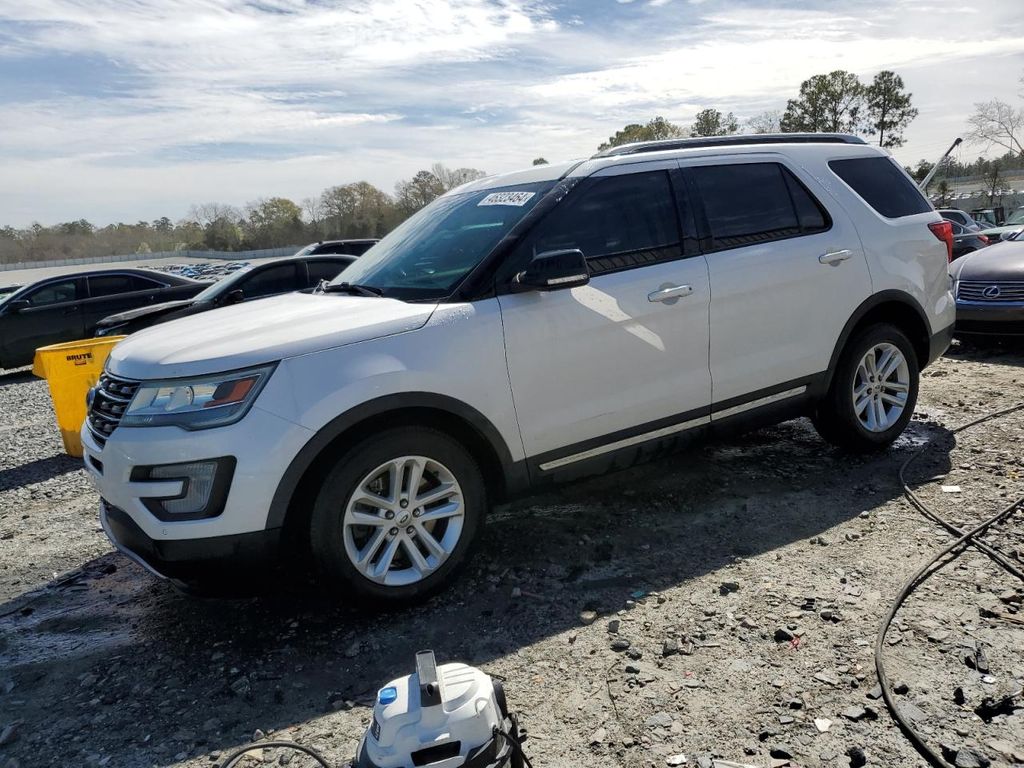
2016 FORD EXPLORERVIN: 1FM5K7D83GGB32689
Get FULL ACCESS to the vehicle history report and see all blurred info.
⭐ Read 205+ reviews from our customers who used BADVIN to avoid buying junk vehicles.
Historical Records
events
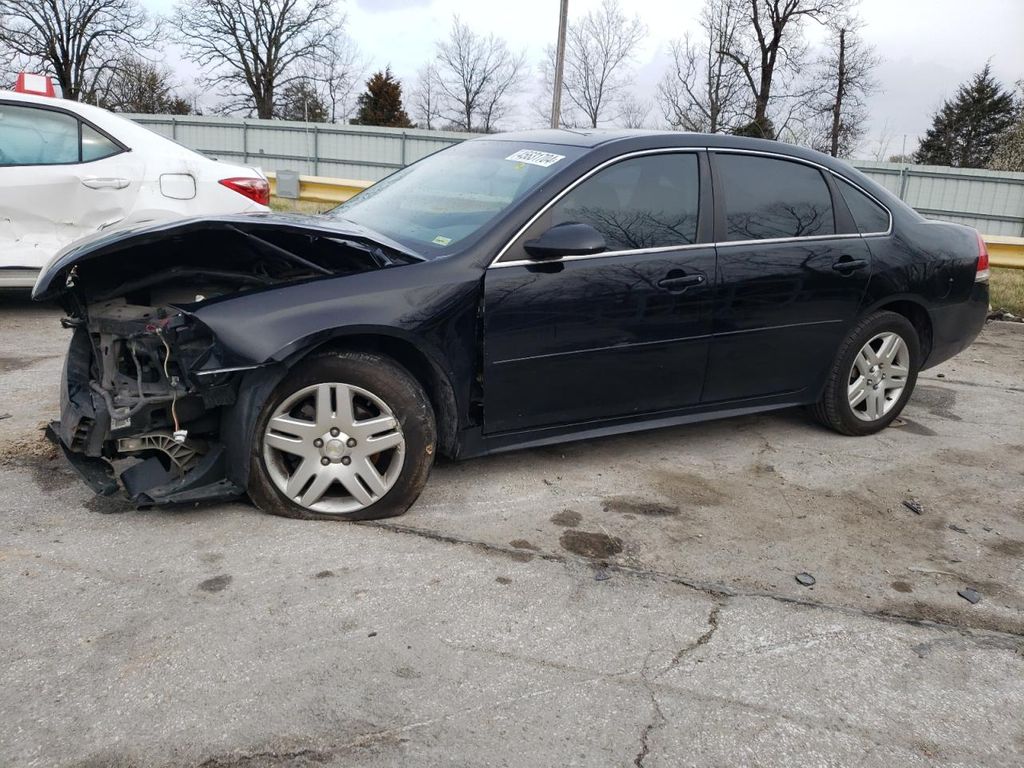
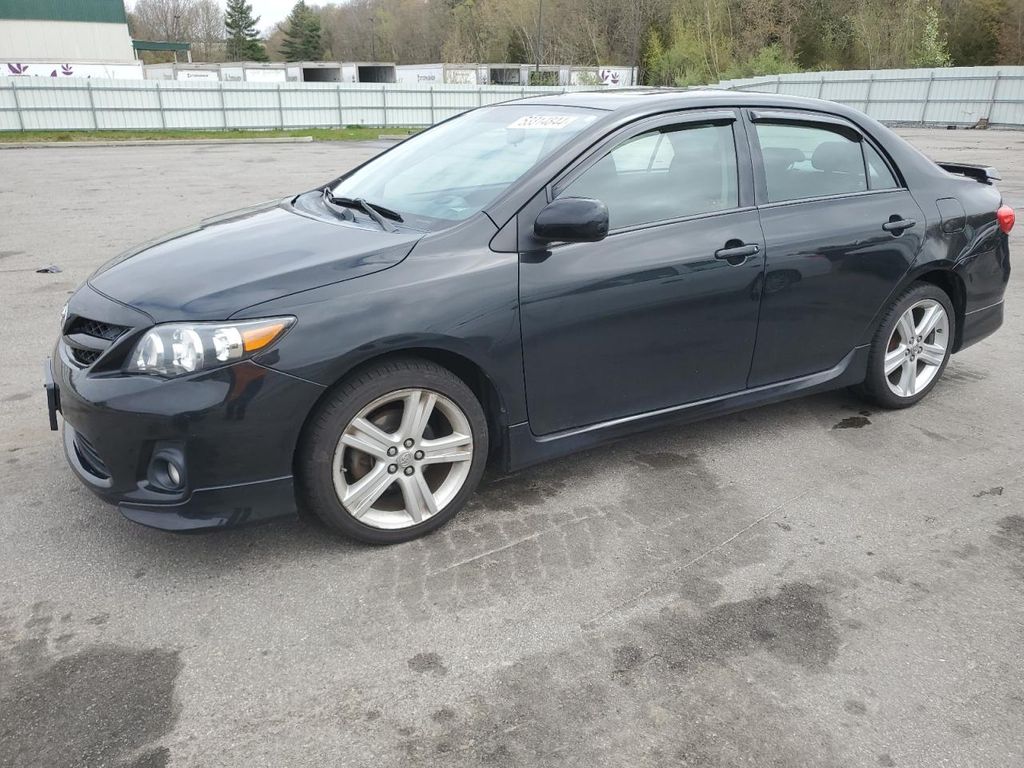
Photos
12 images
Sales History
1 records
Market report
Price analytics
Historical Records
Historical records may include service and maintenance records, title status (clean, junk, salvage), insurance records, number of owners, registration events and states, and other information.
You can find more information about historical records in BADVIN reports and see more examples here.
Available historical records for VIN 1FM5K7D83GGB32689
Latest reported mileage: 601 mi
Below you can see some examples of what these records could look like.
2023-03-18
a year ago
83,095 mi
TOTAL LOSS VEHICLE
Collision damage reported
Collision damage reported
2022-05-18
2 years ago
8,126 mi
Vehicle sold
MILEAGE INCONSISTENCY
MILEAGE INCONSISTENCY
2021-07-29
3 years ago
29,677 mi
Accident reported: minor damage with another motor vehicle
Damage to rear
Damage to rear
Sale Record
| Year | 2016 |
| Title | Hidden text (Hidden text) |
| ODO | 9828 mi (Hidden text) |
| Damage | Hidden text |
| Estimated Retail Value | $1675 |
| Estimated Repair Cost | $2640 (136%) |
| Seller | Hidden text |
| Location | Byron, GA, USA, 31008 |
| Date | ended 16 days ago |
| Sale Website Type | salvage or insurance auction |
sale information provided by user #50115


All photos above are REAL and display ACTUAL car. After you get the report you will see full resolution photos.
Tech Specs
| Color | WHITE |
| Transmission | AUTOMATIC |
| Engine | 3.5L |
| Cylinders | 6 |
| Drive | Front-wheel Drive |
| Fuel Type | GAS |
Model Analytics & Market Report
We've analyzed more than 159,000 sales records of this model and here are some numbers.
The average price for new (MSRP) 2016 FORD EXPLORER in 2016 was $43,180.
The average price for used 2016 FORD EXPLORER nowadays in 2024 is $16,999 which is 39% from the original price.
Estimated mileage driven per year is 10,414 miles.
For this model we also have depreciation curve, photos, list of features and options, and other analytics.
Take a look at 2016 FORD EXPLORER model page in BADVIN vehicles catalog.
Depreciation
The graph below is a depreciation curve for 2016 FORD EXPLORER. It shows how much this model looses per year in price. This analytics is calculated using sales records from BADVIN database.
The table below shows average price for used 2016 FORD EXPLORER in each year since the year of manufacturing, current year price and projected price in the future years.
You can scroll the table horizontally to see all columns.
| Year | Average Mileage | Average Price | % Left | % Lost | ||
|---|---|---|---|---|---|---|
| 2016 MSRP | 0 mi | $43,180 | — | — | 100% | 0% |
| 2016 | 10,414 mi | $46,166 | −$2,986 | −6.92% | 106.92% | -6.92% |
| 2017 | 20,828 mi | $38,000 | +$8,166 | +17.69% | 88% | 12% |
| 2018 | 31,242 mi | $34,383 | +$3,617 | +9.52% | 79.63% | 20.37% |
| 2019 | 41,656 mi | $30,995 | +$3,388 | +9.85% | 71.78% | 28.22% |
| 2020 | 52,070 mi | $28,998 | +$1,997 | +6.44% | 67.16% | 32.84% |
| → Visit 2016 FORD EXPLORER depreciation page to see full data. | ||||||
Price vs Mileage
The graph below shows how mileage affects the price for 2016 FORD EXPLORER. This data was calculated using sales records from BADVIN database.
The table below shows average price for used 2016 FORD EXPLORER by mileage and number of sales.
You can scroll the table horizontally to see all columns.
| Mileage | Average Price | Sample Size |
|---|---|---|
| 20,000 mi | $24,998 | 11 sales |
| 30,000 mi | $20,995 | 10 sales |
| 35,000 mi | $22,998 | 27 sales |
| 40,000 mi | $21,379 | 29 sales |
| 45,000 mi | $21,937 | 45 sales |
| 50,000 mi | $21,990 | 60 sales |
| → Visit 2016 FORD EXPLORER depreciation page to see full data. | ||
Get FULL ACCESS to the vehicle history report and see all blurred info.
⭐ Read 205+ reviews from our customers who used BADVIN to avoid buying junk vehicles.
Testimonials from our customers
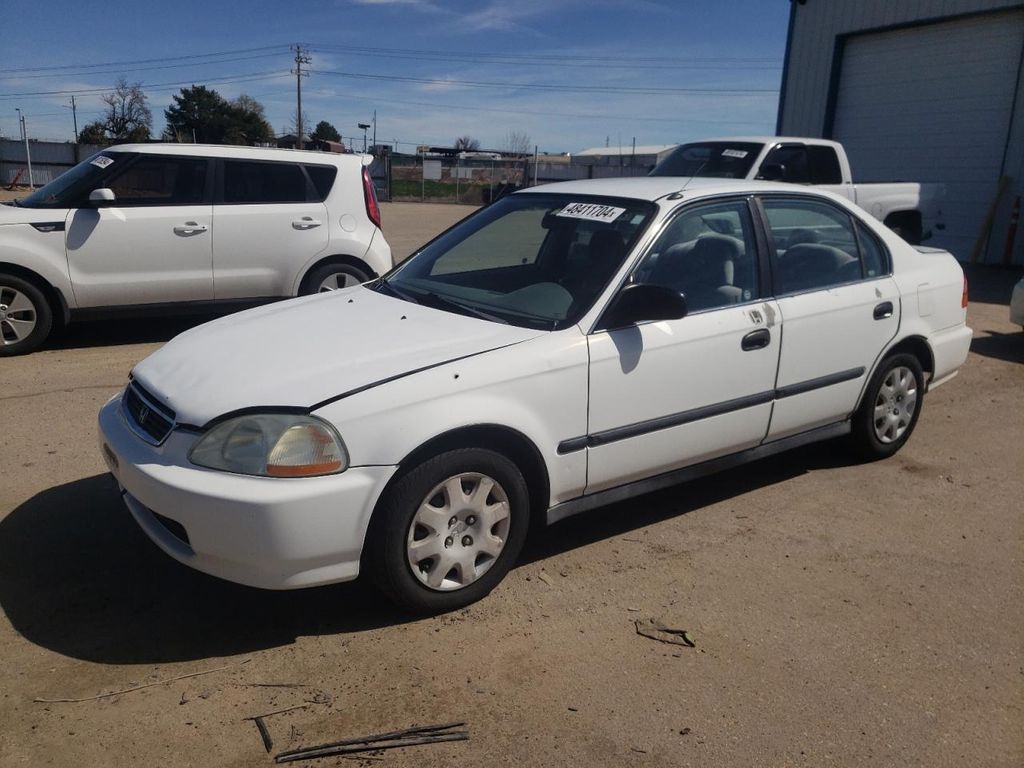
Purchased a badvin report before buying a used Lexus RX 350. It revealed a minor accident the seller hadn't mentioned. I still bought the car but used the info to negotiate a lower price. Well worth the cost for the leverage it gave me!

Aiden Patel
verified on Trustpilot
BadVin's vehicle history report is a must-have before buying any used vehicle. It's saved me from a few lemons over the years - cars that looked great on the surface but had hidden issues like accidents or title problems. Well worth the price.
Camila Santos
verified on Trustpilot
As a broke college kid I almost settled for a sketchy 2005 Altima cuz it was cheap. but splurged on the report from badvin 1st. soooo glad I did - turned out it had been totalled and rebuilt. spending a little saved me from wasting $1000s!
Sophie
verified on Trustpilot
I buy rebuilt title cars at copart to fix and resell. was hoping BadVin reports wud have more detail on damage history to help me value cars before bidding, Carfax is better for that. but for clean title vehicles it seems pretty useful
Fatima
verified on Trustpilot
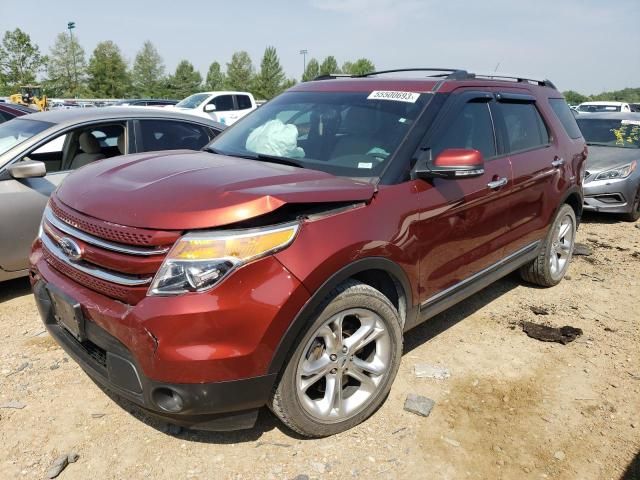
Compare to other 2016 FORD EXPLORER

2014 FORD EXPLORER
3 days ago, 157,674 mi
est retail value $10,900
buy now price $2,000
VIN 1FM5K7D83EGB33029

2023 FORD EXPLORER
in 2 days, 8,833 mi
est retail value $38,933
buy now price $26,200
VIN 1FMSK7DH0PGB18087


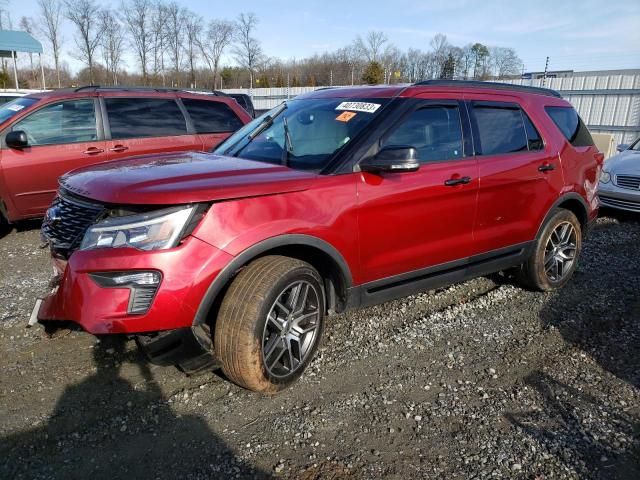
2018 FORD EXPLORER
10 days ago, 77,632 mi
est retail value $29,240
buy now price $3,750
VIN 1FM5K8GT6JGA85350

2022 FORD EXPLORER
4 days ago, 2,660 mi
est retail value $43,329
buy now price $13,000
VIN 1FMSK8DH8NGC49660

Other vehicles sales records


Frequently asked questions
You can use a Monroney label to compare different 2016 FORD models by reviewing their features, fuel economy, safety equipment, and pricing directly on the sticker.
Safety ratings, if available, provide information from crash tests and safety evaluations, which can help assess the 2016 FORD vehicle's protection level in accidents.
Repossession records, if included, indicate if the 2016 FORD vehicle has been taken back by a lender due to payment defaults, which might affect its condition and value.
A VIN alone does not typically provide fuel economy details directly; however, it can identify the vehicle model and engine type, which you can cross-reference with fuel economy data from other sources.
Our reports may include records of tire rotations, indicating how regularly they were performed and at what intervals for the 2016 FORD, if data is available.
The frequency of oil changes, a crucial aspect of vehicle maintenance, might be documented in the service history section of our reports, if records are available.


