
BADVIN vehicle history report for
2013 FORD ECONOLINEVIN: 1FBSS3BL7DDA77799
Get FULL ACCESS to the vehicle history report and see all blurred info.
⭐ Read 206+ reviews from our customers who used BADVIN to avoid buying junk vehicles.
Historical Records
events
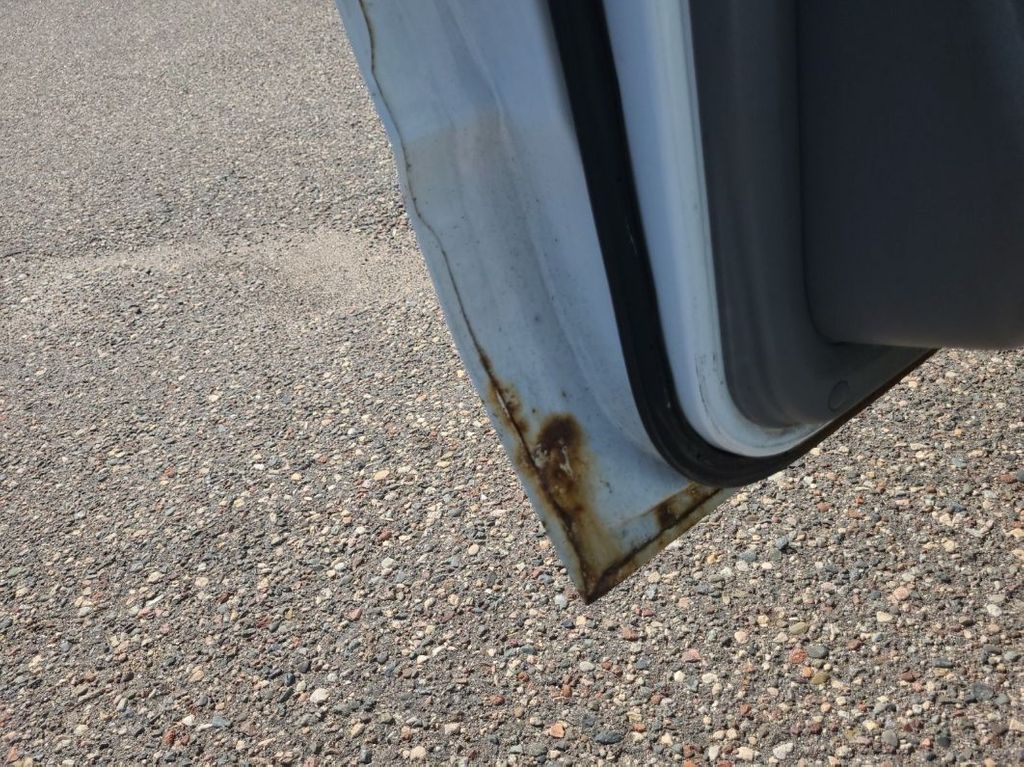
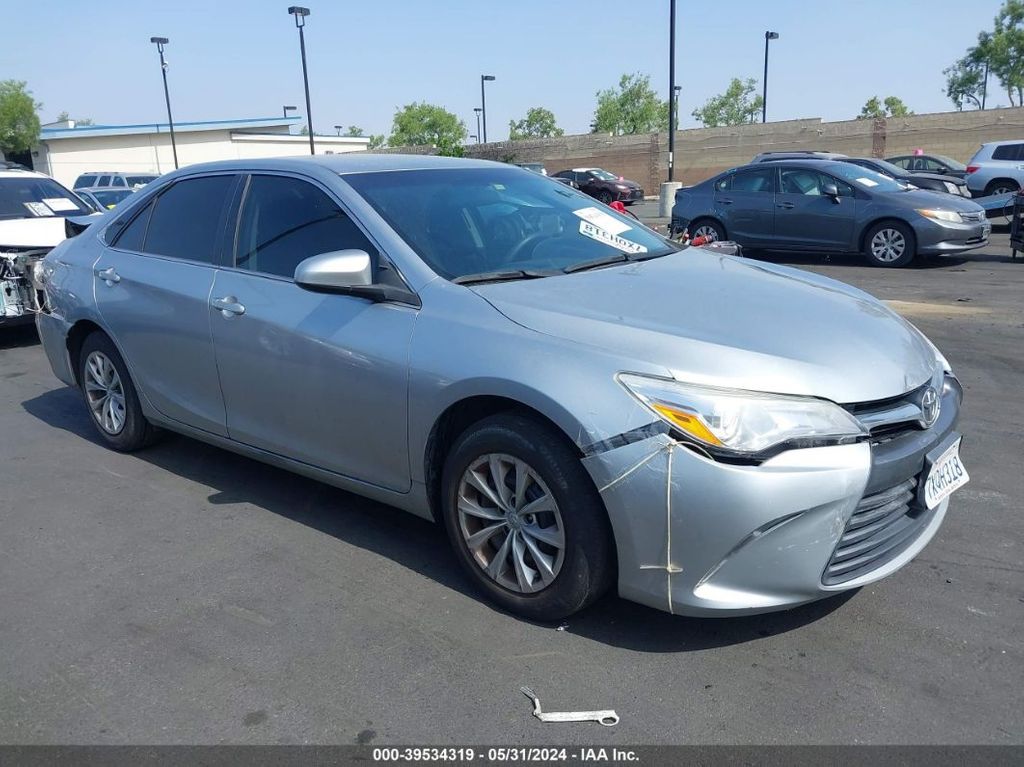
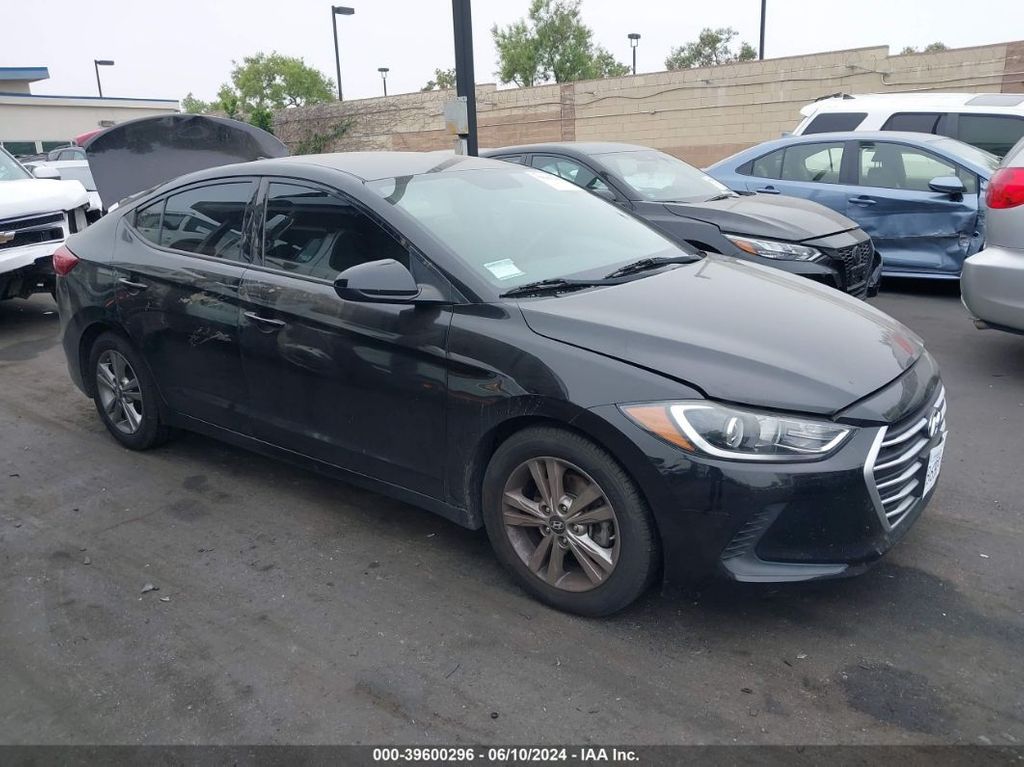
Photos
11 images
Sales History
1 records
Sale Prices
2 records
Market report
Price analytics
Historical Records
Historical records may include service and maintenance records, title status (clean, junk, salvage), insurance records, number of owners, registration events and states, and other information.
You can find more information about historical records in BADVIN reports and see more examples here.
Available historical records for VIN 1FBSS3BL7DDA77799
Latest reported mileage: 391 mi
Below you can see some examples of what these records could look like.
2023-07-01
a year ago
73,275 mi
NOT ACTUAL MILEAGE TITLE ISSUED
Titled or registered as lease vehicle
Titled or registered as lease vehicle
2022-07-26
2 years ago
11,954 mi
Odometer reading reported
2019-04-01
5 years ago
36,003 mi
TOTAL LOSS VEHICLE
Collision damage reported
Collision damage reported
Has Keys:Hidden text
| Year | 2013 |
| Title | Hidden text |
| ODO | 7693 mi (Hidden text) |
| Loss | Hidden text |
| Damage | Hidden text, Hidden text |
| Estimated Retail Value | $5630 |
| Buy Now Price | $9043 |
| Location | Orlando, FL, 32808 |
| Date | ended 4 years ago sold for $751 |
| Sale Website Type | salvage or insurance auction |
sale information provided by user #776362


All photos above are REAL and display ACTUAL car. After you get the report you will see full resolution photos.
Tech Specs
| Engine | 5.4L EFI FFV V8 ENGINE |
| Cylinders | 8 Cylinders |
| Drive | Rear Wheel Drive |
| Fuel Type | Other |
Model Analytics & Market Report
We've analyzed more than 7,000 sales records of this model and here are some numbers.
The average price for new (MSRP) 2013 FORD ECONOLINE in 2013 was $30,978.
The average price for used 2013 FORD ECONOLINE nowadays in 2024 is $14,500 which is 47% from the original price.
Estimated mileage driven per year is 10,233 miles.
For this model we also have depreciation curve, photos, list of features and options, and other analytics.
Take a look at 2013 FORD ECONOLINE model page in BADVIN vehicles catalog.
Depreciation
The graph below is a depreciation curve for 2013 FORD ECONOLINE. It shows how much this model looses per year in price. This analytics is calculated using sales records from BADVIN database.
The table below shows average price for used 2013 FORD ECONOLINE in each year since the year of manufacturing, current year price and projected price in the future years.
You can scroll the table horizontally to see all columns.
| Year | Average Mileage | Average Price | % Left | % Lost | ||
|---|---|---|---|---|---|---|
| 2013 MSRP | 0 mi | $30,978 | — | — | 100% | 0% |
| 2015 | 30,699 mi | $38,906 | +$0 | +0% | 125.59% | -25.59% |
| 2016 | 40,932 mi | $35,246 | +$3,660 | +9.41% | 113.78% | -13.78% |
| → Visit 2013 FORD ECONOLINE depreciation page to see full data. | ||||||
Price vs Mileage
The graph below shows how mileage affects the price for 2013 FORD ECONOLINE. This data was calculated using sales records from BADVIN database.
The table below shows average price for used 2013 FORD ECONOLINE by mileage and number of sales.
You can scroll the table horizontally to see all columns.
| Mileage | Average Price | Sample Size |
|---|---|---|
| 25,000 mi | $29,239 | 12 sales |
| 30,000 mi | $30,484 | 16 sales |
| 35,000 mi | $24,493 | 18 sales |
| 45,000 mi | $22,973 | 28 sales |
| 50,000 mi | $24,111 | 26 sales |
| 55,000 mi | $21,959 | 29 sales |
| → Visit 2013 FORD ECONOLINE depreciation page to see full data. | ||
Get FULL ACCESS to the vehicle history report and see all blurred info.
⭐ Read 206+ reviews from our customers who used BADVIN to avoid buying junk vehicles.
Testimonials from our customers
I almost bought a 2019 Malibu that seemed like a great deal - low miles and price. But the badvin report showed it used to be a rental fleet vehicle, which the seller didn't disclose. Glad I found out before buying someone else's abused rental!

Benjamin Torres
verified on Trustpilot
As a car dealer importing vehicles from the US to Mexico, I rely on badvin for comprehensive history reports before bidding at auctions. Their info has helped me avoid several salvage vehicles and is more thorough than carfax. A must-have service!
Javier Ramirez
verified on Trustpilot
Ich hätte fast einen 2017 Mercedes-Benz C300 gekauft, bis der Bad Vin-Bericht zeigte, dass er als durch Überschwemmung beschädigt gemeldet wurde. Die detaillierten Schadensaufzeichnungen haben mich vor einem großen Fehler bewahrt!
Sophia Müller
verified on Trustpilot
Was shopping for a used Range Rover and found one that seemed suspiciously cheap. The badVIN report revealed it had been in a major front end collision, with photos showing the damage. Steered clear of that one and saved myself a ton of headaches!!
Ava Patel
verified on Trustpilot
Compare to other 2013 FORD ECONOLINE


Other vehicles sales records


2011 HYUNDAI ELANTRA
in 28 minutes, 210,969 mi
est retail value $2,475
buy now price $850
VIN 5NPDH4AE5BH005826


2013 DODGE CHARGER
in an hour, 187,862 mi
est retail value $435
buy now price $2,550
VIN 2C3CDXCTXDH716880


2006 MAZDA MAZDA3
in 28 minutes, 131,979 mi
est retail value $1,850
buy now price $725
VIN JM1BK343161537195
Frequently asked questions
Safety ratings on the Monroney label include crash test results from agencies like the NHTSA and IIHS, providing an assessment of the vehicle's safety.
MSRP on a Monroney label stands for Manufacturer's Suggested Retail Price, which is the recommended selling price for a vehicle.
A VIN decoder can help you find compatible parts for a 2013 FORD vehicle by identifying the exact model, engine type, and other specifications crucial for parts compatibility.
Yes, a VIN decoder can determine the manufacture year of the vehicle as it is encoded in the 10th character of the VIN.
High mileage typically accelerates the depreciation of a vehicle, as it may indicate increased wear and tear and potential future repairs.
Market value is generally estimated based on the 2013 FORD vehicle’s history, condition, and comparable sales, helping to provide a guideline for buyers and sellers, though specific values can vary.
Total loss is usually determined when the cost of repairing the vehicle exceeds a certain percentage of its value before the damage occurred, as decided by the insurance company, if such data is recorded.


