Depreciation
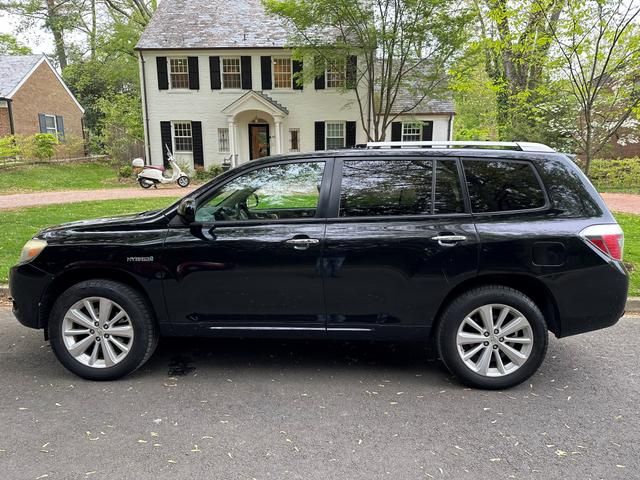
The depreciation graph and accompanying table on our page detail how the 2008 TOYOTA HIGHLANDER's price has changed annually.
For instance, while the car initially depreciated slightly in its first year, subsequent years show a significant decrease, reflecting market trends and vehicle condition over time.
Such precise data is crucial for understanding how age and market dynamics impact car values.
The average price for new (MSRP) 2008 TOYOTA HIGHLANDER in 2008 was $41,405.
The average price for used 2008 TOYOTA HIGHLANDER nowadays in 2024 is $9,976 which is 24% from the original price.
Estimated mileage driven per year is 11,461 miles.
The graph below is a depreciation curve for 2008 TOYOTA HIGHLANDER. It shows how much this model looses per year in price. This analytics is calculated using sales records from BADVIN database.
The table below shows average price for used 2008 TOYOTA HIGHLANDER in each year since the year of manufacturing, current year price and projected price in the future years.
You can scroll the table horizontally to see all columns.
| Year | Average Mileage | Average Price | % Left | % Lost | ||
|---|---|---|---|---|---|---|
| 2008 MSRP | 0 mi | $41,405 | — | — | 100% | 0% |
| 2008 | 11,461 mi | $47,195 | −$5,790 | −13.98% | 113.98% | -13.98% |
| 2009 | 22,922 mi | $39,900 | +$7,295 | +15.46% | 96.37% | 3.63% |
| 2010 | 34,383 mi | $37,499 | +$2,401 | +6.02% | 90.57% | 9.43% |
| 2011 | 45,844 mi | $35,508 | +$1,991 | +5.31% | 85.76% | 14.24% |
| 2012 | 57,305 mi | $33,452 | +$2,056 | +5.79% | 80.79% | 19.21% |
| 2013 | 68,766 mi | $29,355 | +$4,097 | +12.25% | 70.9% | 29.1% |
| 2014 | 80,227 mi | $26,998 | +$2,357 | +8.03% | 65.2% | 34.8% |
| 2015 | 91,688 mi | $24,990 | +$2,008 | +7.44% | 60.36% | 39.64% |
| 2016 | 103,149 mi | $21,996 | +$2,994 | +11.98% | 53.12% | 46.88% |
| 2017 | 114,610 mi | $19,999 | +$1,997 | +9.08% | 48.3% | 51.7% |
| 2018 | 126,071 mi | $18,971 | +$1,028 | +5.14% | 45.82% | 54.18% |
| 2019 | 137,532 mi | $15,995 | +$2,976 | +15.69% | 38.63% | 61.37% |
| 2020 | 148,993 mi | $14,400 | +$1,595 | +9.97% | 34.78% | 65.22% |
| 2021 | 160,454 mi | $12,990 | +$1,410 | +9.79% | 31.37% | 68.63% |
| 2022 | 171,915 mi | $11,895 | +$1,095 | +8.43% | 28.73% | 71.27% |
Price vs Mileage
Our comprehensive analysis does not stop at depreciation; it also covers how mileage affects the TOYOTA HIGHLANDER’s price.
With data showing detailed price points at various mileage milestones, this section helps in identifying trends and making informed decisions.
For instance, price drops at higher mileages compared to lower mileages provides insights into potential maintenance or value thresholds.
This block is particularly useful for buyers and sellers aiming to gauge the best value proposition based on vehicle mileage.
The graph below shows how mileage affects the price for 2008 TOYOTA HIGHLANDER. This data was calculated using sales records from BADVIN database.
The table below shows average price for used 2008 TOYOTA HIGHLANDER by mileage and number of sales.
You can scroll the table horizontally to see all columns.
| Mileage | Average Price | Sample Size |
|---|---|---|
| 50,000 mi | $18,997 | 13 sales |
| 55,000 mi | $16,900 | 13 sales |
| 60,000 mi | $15,995 | 21 sales |
| 65,000 mi | $14,999 | 32 sales |
| 70,000 mi | $14,995 | 29 sales |
| 75,000 mi | $13,995 | 39 sales |
| 80,000 mi | $13,497 | 42 sales |
| 85,000 mi | $13,995 | 49 sales |
| 90,000 mi | $13,995 | 51 sales |
| 95,000 mi | $12,995 | 86 sales |
| 100,000 mi | $12,991 | 63 sales |
| 105,000 mi | $11,995 | 77 sales |
| 110,000 mi | $12,677 | 112 sales |
| 115,000 mi | $12,500 | 137 sales |
| 120,000 mi | $12,480 | 133 sales |
| 125,000 mi | $11,900 | 139 sales |
| 130,000 mi | $11,995 | 142 sales |
| 135,000 mi | $11,566 | 164 sales |
| 140,000 mi | $11,455 | 183 sales |
| 145,000 mi | $10,995 | 197 sales |
| 150,000 mi | $10,988 | 184 sales |
| 155,000 mi | $10,888 | 173 sales |
| 160,000 mi | $10,497 | 177 sales |
| 165,000 mi | $9,995 | 190 sales |
| 170,000 mi | $9,991 | 197 sales |
| 175,000 mi | $9,999 | 162 sales |
| 180,000 mi | $9,295 | 142 sales |
| 185,000 mi | $9,647 | 164 sales |
| 190,000 mi | $8,995 | 116 sales |
| 195,000 mi | $8,983 | 128 sales |
| 200,000 mi | $8,500 | 136 sales |
| 205,000 mi | $7,988 | 129 sales |
| 210,000 mi | $8,500 | 78 sales |
| 215,000 mi | $8,773 | 93 sales |
| 220,000 mi | $7,995 | 92 sales |
| 225,000 mi | $7,638 | 68 sales |
| 230,000 mi | $7,650 | 47 sales |
| 235,000 mi | $7,900 | 27 sales |
| 240,000 mi | $7,450 | 49 sales |
| 245,000 mi | $7,547 | 32 sales |
| 250,000 mi | $6,995 | 31 sales |
| 255,000 mi | $6,948 | 26 sales |
| 260,000 mi | $7,504 | 22 sales |
| 265,000 mi | $6,950 | 15 sales |
| 270,000 mi | $6,455 | 10 sales |
| 275,000 mi | $6,946 | 20 sales |
| 280,000 mi | $6,995 | 14 sales |
Frequently asked questions
The average depreciation rate for vehicles over five years can vary, but many models experience a significant portion of their depreciation within the first few years of ownership.
Mileage is considered a major factor in the depreciation of vehicles because it directly correlates with the amount of use and potential wear and tear the vehicle has undergone.
The best time of year to sell your car to minimize depreciation might be just before the release of a new model, when demand for used models could be higher.
To maximize value, consider buying a vehicle that is a few years old, as it has already undergone significant depreciation but likely remains reliable.
High mileage typically accelerates the depreciation of a vehicle, as it may indicate increased wear and tear and potential future repairs.
Technology plays a significant role in the depreciation of vehicles, as models with outdated tech depreciate faster due to lower consumer demand for older features.
Depreciation directly affects the resale value of a 2008 TOYOTA HIGHLANDER, with faster depreciating vehicles typically having lower resale values over time.
On average, a new car can depreciate by approximately 23% after the first year, reflecting the premium paid for new technology and immediate depreciation once it's considered used.
Some models may depreciate faster due to factors like lower demand, higher maintenance costs, or outdated technology compared to newer versions.
Keeping your vehicle for about three to five years can optimize its resale value, balancing depreciation with usage and maintenance costs.
Other years of TOYOTA HIGHLANDER

2003 TOYOTA HIGHLANDER
$6,118 average used price
7,900+ sales records

2005 TOYOTA HIGHLANDER
$6,993 average used price
11,500+ sales records

2011 TOYOTA HIGHLANDER
$12,990 average used price
23,800+ sales records

2012 TOYOTA HIGHLANDER
$14,400 average used price
43,300+ sales records

2015 TOYOTA HIGHLANDER
$19,999 average used price
74,600+ sales records

2021 TOYOTA HIGHLANDER
$35,508 average used price
191,800+ sales records
Similar Models

2010 TOYOTA VENZA
$37,565 MSRP
$11,000 average used price
14,300+ sales records

2010 TOYOTA COROLLA
$21,900 MSRP
$8,990 average used price
60,300+ sales records

2010 TOYOTA SIENNA
$38,660 MSRP
$9,000 average used price
9,400+ sales records
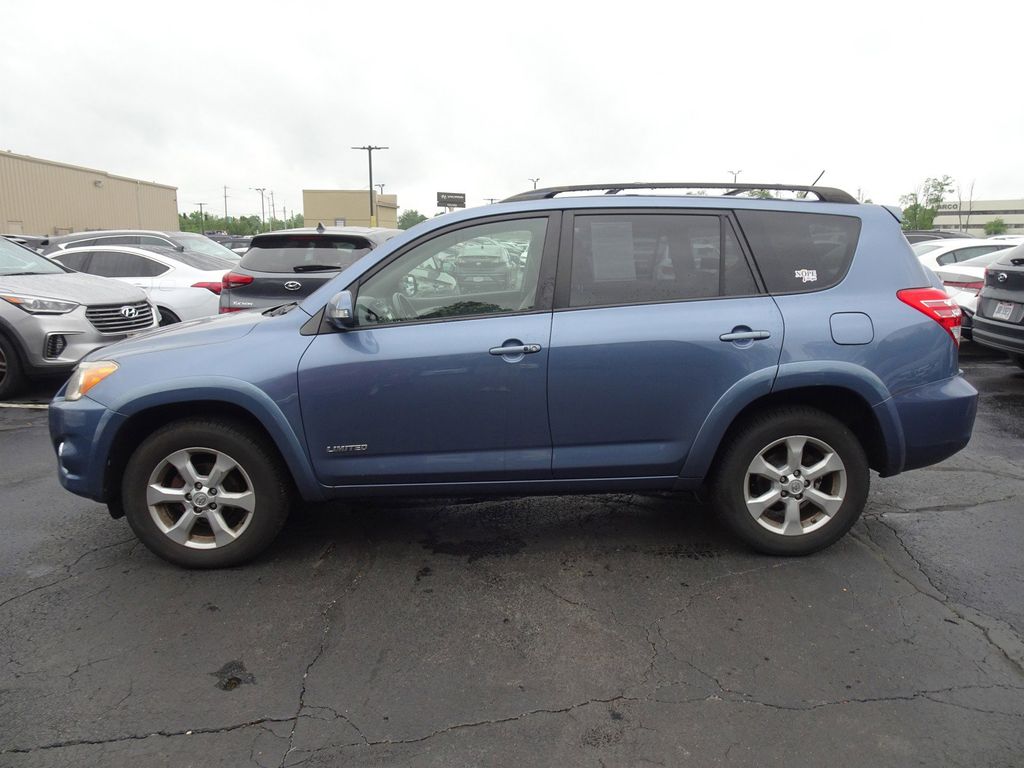
2010 TOYOTA RAV4
$30,710 MSRP
$9,999 average used price
35,900+ sales records

2011 TOYOTA SIENNA
$38,660 MSRP
$11,599 average used price
43,100+ sales records

2011 TOYOTA AVALON
$37,825 MSRP
$11,989 average used price
14,500+ sales records
2008 TOYOTA HIGHLANDER on BADVIN