Depreciation
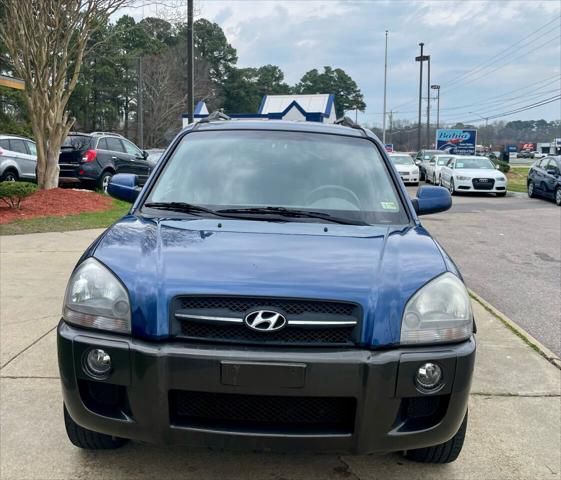
The depreciation graph and accompanying table on our page detail how the 2006 HYUNDAI TUCSON's price has changed annually.
For instance, while the car initially depreciated slightly in its first year, subsequent years show a significant decrease, reflecting market trends and vehicle condition over time.
Such precise data is crucial for understanding how age and market dynamics impact car values.
The average price for new (MSRP) 2006 HYUNDAI TUCSON in 2006 was $26,870.
The average price for used 2006 HYUNDAI TUCSON nowadays in 2024 is $5,000 which is 19% from the original price.
Estimated mileage driven per year is 10,687 miles.
The graph below is a depreciation curve for 2006 HYUNDAI TUCSON. It shows how much this model looses per year in price. This analytics is calculated using sales records from BADVIN database.
The table below shows average price for used 2006 HYUNDAI TUCSON in each year since the year of manufacturing, current year price and projected price in the future years.
You can scroll the table horizontally to see all columns.
| Year | Average Mileage | Average Price | % Left | % Lost | ||
|---|---|---|---|---|---|---|
| 2006 MSRP | 0 mi | $26,870 | — | — | 100% | 0% |
| 2006 | 10,687 mi | $29,128 | −$2,258 | −8.4% | 108.4% | -8.4% |
| 2007 | 21,374 mi | $26,500 | +$2,628 | +9.02% | 98.62% | 1.38% |
| 2008 | 32,061 mi | $24,190 | +$2,310 | +8.72% | 90.03% | 9.97% |
| 2009 | 42,748 mi | $21,499 | +$2,691 | +11.12% | 80.01% | 19.99% |
| 2010 | 53,435 mi | $19,998 | +$1,501 | +6.98% | 74.43% | 25.57% |
| 2011 | 64,122 mi | $18,000 | +$1,998 | +9.99% | 66.99% | 33.01% |
| 2012 | 74,809 mi | $16,500 | +$1,500 | +8.33% | 61.41% | 38.59% |
| 2013 | 85,496 mi | $15,494 | +$1,006 | +6.1% | 57.66% | 42.34% |
| 2014 | 96,183 mi | $14,499 | +$995 | +6.42% | 53.96% | 46.04% |
| 2015 | 106,870 mi | $11,999 | +$2,500 | +17.24% | 44.66% | 55.34% |
| 2016 | 117,557 mi | $11,892 | +$107 | +0.89% | 44.26% | 55.74% |
| 2017 | 128,244 mi | $10,700 | +$1,192 | +10.02% | 39.82% | 60.18% |
| 2018 | 138,931 mi | $9,595 | +$1,105 | +10.33% | 35.71% | 64.29% |
| 2019 | 149,618 mi | $8,289 | +$1,306 | +13.61% | 30.85% | 69.15% |
| 2020 | 160,305 mi | $7,998 | +$291 | +3.51% | 29.77% | 70.23% |
Price vs Mileage
Our comprehensive analysis does not stop at depreciation; it also covers how mileage affects the HYUNDAI TUCSON’s price.
With data showing detailed price points at various mileage milestones, this section helps in identifying trends and making informed decisions.
For instance, price drops at higher mileages compared to lower mileages provides insights into potential maintenance or value thresholds.
This block is particularly useful for buyers and sellers aiming to gauge the best value proposition based on vehicle mileage.
The graph below shows how mileage affects the price for 2006 HYUNDAI TUCSON. This data was calculated using sales records from BADVIN database.
The table below shows average price for used 2006 HYUNDAI TUCSON by mileage and number of sales.
You can scroll the table horizontally to see all columns.
| Mileage | Average Price | Sample Size |
|---|---|---|
| 35,000 mi | $9,000 | 16 sales |
| 45,000 mi | $8,392 | 21 sales |
| 55,000 mi | $8,199 | 24 sales |
| 60,000 mi | $7,995 | 29 sales |
| 65,000 mi | $7,995 | 39 sales |
| 70,000 mi | $7,599 | 38 sales |
| 75,000 mi | $6,987 | 57 sales |
| 80,000 mi | $6,695 | 62 sales |
| 85,000 mi | $6,288 | 64 sales |
| 90,000 mi | $6,995 | 106 sales |
| 95,000 mi | $5,999 | 98 sales |
| 100,000 mi | $5,495 | 78 sales |
| 105,000 mi | $5,495 | 78 sales |
| 110,000 mi | $5,638 | 106 sales |
| 115,000 mi | $5,598 | 85 sales |
| 120,000 mi | $4,999 | 87 sales |
| 125,000 mi | $5,498 | 82 sales |
| 130,000 mi | $5,454 | 94 sales |
| 135,000 mi | $5,000 | 127 sales |
| 140,000 mi | $4,500 | 88 sales |
| 145,000 mi | $4,790 | 89 sales |
| 150,000 mi | $4,995 | 92 sales |
| 155,000 mi | $4,990 | 73 sales |
| 160,000 mi | $3,999 | 66 sales |
| 165,000 mi | $4,495 | 64 sales |
| 170,000 mi | $4,366 | 58 sales |
| 175,000 mi | $3,995 | 69 sales |
| 180,000 mi | $3,936 | 30 sales |
| 185,000 mi | $4,400 | 94 sales |
| 190,000 mi | $3,900 | 55 sales |
| 195,000 mi | $4,495 | 43 sales |
| 200,000 mi | $3,900 | 37 sales |
| 205,000 mi | $3,800 | 11 sales |
| 210,000 mi | $3,500 | 14 sales |
| 215,000 mi | $3,495 | 25 sales |
| 220,000 mi | $4,688 | 17 sales |
| 230,000 mi | $2,995 | 10 sales |
| 235,000 mi | $2,333 | 11 sales |
Frequently asked questions
Understanding depreciation is important for car owners to manage financial expectations and make informed decisions about selling or trading in their vehicles at the right time.
Mileage is considered a major factor in the depreciation of vehicles because it directly correlates with the amount of use and potential wear and tear the vehicle has undergone.
New vehicles often depreciate quickly due to rapid advancements in technology and consumer preference for the latest features, which make older models less desirable.
A CPO vehicle offers the reliability of a new car at a lower price, backed by a comprehensive warranty, making it a great option for those seeking value and peace of mind.
Strategies to reduce the rate of depreciation include regular maintenance, keeping mileage low, avoiding significant modifications, and keeping up with all necessary repairs.
To minimize depreciation costs, consider purchasing a model known for retaining its value or opting for a slightly used vehicle that has already undergone initial depreciation.
The average depreciation rate for vehicles over five years can vary, but many models experience a significant portion of their depreciation within the first few years of ownership.
Yes, the choice of vehicle color can impact the depreciation rate, with neutral colors typically being easier to sell and potentially holding their value better than more unconventional colors.
The exterior and interior condition of vehicles significantly affects their depreciation, as well-maintained vehicles generally retain more value.
Proper maintenance and good condition can slow the depreciation of a 2006 HYUNDAI TUCSON by making it more attractive to potential buyers, thereby preserving more of its value.
Other years of HYUNDAI TUCSON
2009 HYUNDAI TUCSON
$5,999 average used price
1,700+ sales records

2010 HYUNDAI TUCSON
$7,998 average used price
5,300+ sales records

2012 HYUNDAI TUCSON
$9,595 average used price
16,300+ sales records

2018 HYUNDAI TUCSON
$16,500 average used price
91,300+ sales records

2019 HYUNDAI TUCSON
$18,000 average used price
112,300+ sales records
2020 HYUNDAI TUCSON
$19,998 average used price
98,700+ sales records
Similar Models

2006 HYUNDAI TIBURON
$8,790 MSRP
$6,734 average used price
940+ sales records
2007 HYUNDAI TIBURON
$8,790 MSRP
$5,995 average used price
890+ sales records

2007 HYUNDAI VERACRUZ
$35,515 MSRP
$5,500 average used price
1,400+ sales records
2007 HYUNDAI ACCENT
$17,215 MSRP
$4,993 average used price
2,300+ sales records

2008 HYUNDAI TIBURON
$8,790 MSRP
$6,300 average used price
1,600+ sales records

2009 HYUNDAI ACCENT
$17,215 MSRP
$5,152 average used price
5,500+ sales records


