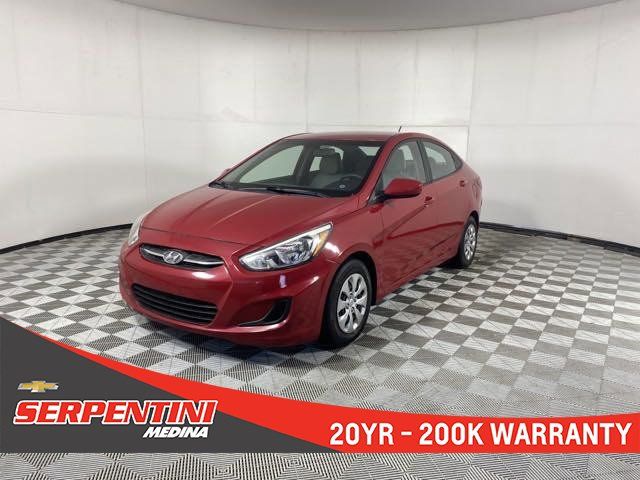
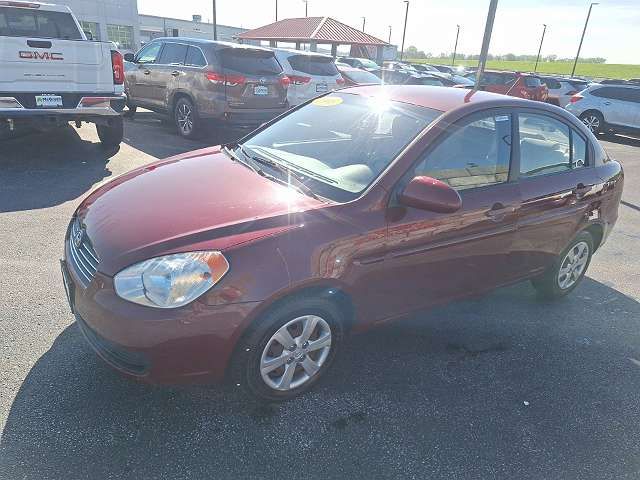
Depreciation
The depreciation graph and accompanying table on our page detail how the 2016 HYUNDAI ACCENT's price has changed annually.
For instance, while the car initially depreciated slightly in its first year, subsequent years show a significant decrease, reflecting market trends and vehicle condition over time.
Such precise data is crucial for understanding how age and market dynamics impact car values.
The average price for new (MSRP) 2016 HYUNDAI ACCENT in 2016 was $17,215.
The average price for used 2016 HYUNDAI ACCENT nowadays in 2024 is $9,487 which is 55% from the original price.
Estimated mileage driven per year is 11,105 miles.
The graph below is a depreciation curve for 2016 HYUNDAI ACCENT. It shows how much this model looses per year in price. This analytics is calculated using sales records from BADVIN database.
The table below shows average price for used 2016 HYUNDAI ACCENT in each year since the year of manufacturing, current year price and projected price in the future years.
You can scroll the table horizontally to see all columns.
| Year | Average Mileage | Average Price | % Left | % Lost | ||
|---|---|---|---|---|---|---|
| 2016 MSRP | 0 mi | $17,215 | — | — | 100% | 0% |
| 2018 | 33,315 mi | $17,776 | +$0 | +0% | 103.26% | -3.26% |
| 2019 | 44,420 mi | $14,990 | +$2,786 | +15.67% | 87.08% | 12.92% |
| 2020 | 55,525 mi | $14,426 | +$564 | +3.76% | 83.8% | 16.2% |
| 2021 | 66,630 mi | $13,298 | +$1,128 | +7.82% | 77.25% | 22.75% |
| 2022 | 77,735 mi | $12,998 | +$300 | +2.26% | 75.5% | 24.5% |
| 2023 | 88,840 mi | $9,988 | +$3,010 | +23.16% | 58.02% | 41.98% |
| 2024 | 99,945 mi | $9,487 | +$501 | +5.02% | 55.11% | 44.89% |
| 2025 | 111,050 mi | $8,900 | +$587 | +6.19% | 51.7% | 48.3% |
| 2026 | 122,155 mi | $8,388 | +$512 | +5.75% | 48.72% | 51.28% |
| 2027 | 133,260 mi | $7,994 | +$394 | +4.7% | 46.44% | 53.56% |
| 2028 | 144,365 mi | $7,797 | +$197 | +2.46% | 45.29% | 54.71% |
| 2029 | 155,470 mi | $5,532 | +$2,265 | +29.05% | 32.13% | 67.87% |
| 2030 | 166,575 mi | $5,000 | +$532 | +9.62% | 29.04% | 70.96% |
Price vs Mileage
Our comprehensive analysis does not stop at depreciation; it also covers how mileage affects the HYUNDAI ACCENT’s price.
With data showing detailed price points at various mileage milestones, this section helps in identifying trends and making informed decisions.
For instance, price drops at higher mileages compared to lower mileages provides insights into potential maintenance or value thresholds.
This block is particularly useful for buyers and sellers aiming to gauge the best value proposition based on vehicle mileage.
The graph below shows how mileage affects the price for 2016 HYUNDAI ACCENT. This data was calculated using sales records from BADVIN database.
The table below shows average price for used 2016 HYUNDAI ACCENT by mileage and number of sales.
You can scroll the table horizontally to see all columns.
| Mileage | Average Price | Sample Size |
|---|---|---|
| 5,000 mi | $14,823 | 14 sales |
| 10,000 mi | $14,998 | 35 sales |
| 15,000 mi | $14,800 | 39 sales |
| 20,000 mi | $13,997 | 47 sales |
| 25,000 mi | $13,985 | 58 sales |
| 30,000 mi | $13,995 | 71 sales |
| 35,000 mi | $13,882 | 81 sales |
| 40,000 mi | $13,025 | 115 sales |
| 45,000 mi | $12,780 | 128 sales |
| 50,000 mi | $12,686 | 145 sales |
| 55,000 mi | $12,605 | 190 sales |
| 60,000 mi | $11,995 | 221 sales |
| 65,000 mi | $11,495 | 261 sales |
| 70,000 mi | $11,000 | 277 sales |
| 75,000 mi | $11,488 | 268 sales |
| 80,000 mi | $10,500 | 286 sales |
| 85,000 mi | $10,249 | 283 sales |
| 90,000 mi | $10,399 | 286 sales |
| 95,000 mi | $9,999 | 274 sales |
| 100,000 mi | $9,495 | 272 sales |
| 105,000 mi | $9,745 | 281 sales |
| 110,000 mi | $8,981 | 218 sales |
| 115,000 mi | $8,800 | 236 sales |
| 120,000 mi | $8,649 | 167 sales |
| 125,000 mi | $7,995 | 127 sales |
| 130,000 mi | $7,991 | 96 sales |
| 135,000 mi | $7,791 | 65 sales |
| 140,000 mi | $6,995 | 50 sales |
| 145,000 mi | $6,395 | 34 sales |
| 150,000 mi | $6,999 | 27 sales |
| 155,000 mi | $6,995 | 13 sales |
| 160,000 mi | $6,597 | 20 sales |
| 165,000 mi | $6,995 | 12 sales |
| 170,000 mi | $6,250 | 14 sales |
| 180,000 mi | $5,056 | 10 sales |
Frequently asked questions
The expected depreciation of a vehicle after three years can vary, but generally, cars lose a significant portion of their value within the first few years.
High mileage typically accelerates the depreciation of a vehicle, as it may indicate increased wear and tear and potential future repairs.
Depreciation directly affects the resale value of a 2016 HYUNDAI ACCENT, with faster depreciating vehicles typically having lower resale values over time.
Technology plays a significant role in the depreciation of vehicles, as models with outdated tech depreciate faster due to lower consumer demand for older features.
When buying a car, consider models with strong resale histories, opt for popular color and feature options, and evaluate current market trends for the best value retention.
The market value of a vehicle is calculated based on its historical depreciation trends, current condition, mileage, and market trends.
Mileage is considered a major factor in the depreciation of vehicles because it directly correlates with the amount of use and potential wear and tear the vehicle has undergone.
Advanced safety features can influence the resale value and slow the depreciation of vehicles by making them more attractive to safety-conscious buyers.
Aftermarket modifications can affect the depreciation of 2016 HYUNDAI ACCENT either positively, by enhancing appeal to certain buyers, or negatively, by deterring those who prefer stock condition.
Keeping your vehicle for about three to five years can optimize its resale value, balancing depreciation with usage and maintenance costs.
Other years of HYUNDAI ACCENT
2006 HYUNDAI ACCENT
$4,995 average used price
740+ sales records
2008 HYUNDAI ACCENT
$4,990 average used price
3,600+ sales records

2009 HYUNDAI ACCENT
$5,152 average used price
5,500+ sales records

2010 HYUNDAI ACCENT
$5,000 average used price
6,200+ sales records

2011 HYUNDAI ACCENT
$5,532 average used price
3,900+ sales records
2013 HYUNDAI ACCENT
$7,994 average used price
18,700+ sales records
Similar Models

2017 HYUNDAI TUCSON
$26,870 MSRP
$15,494 average used price
138,500+ sales records

2018 HYUNDAI GENESIS
$41,985 MSRP
810+ sales records

2018 HYUNDAI TUCSON
$26,870 MSRP
$16,500 average used price
91,300+ sales records

2018 HYUNDAI SANTA FE
$31,445 MSRP
$16,460 average used price
90,000+ sales records

2019 HYUNDAI SONATA
$25,559 MSRP
$16,800 average used price
84,300+ sales records
2019 HYUNDAI IONIQ
$27,050 MSRP
$16,990 average used price
29,300+ sales records


