
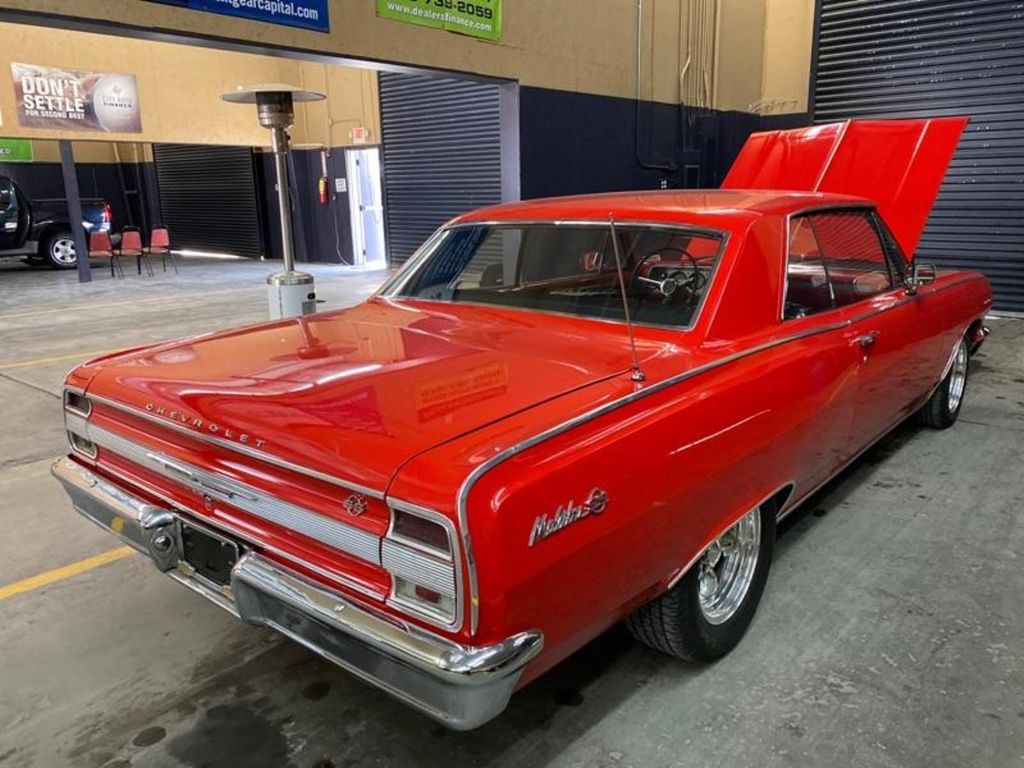
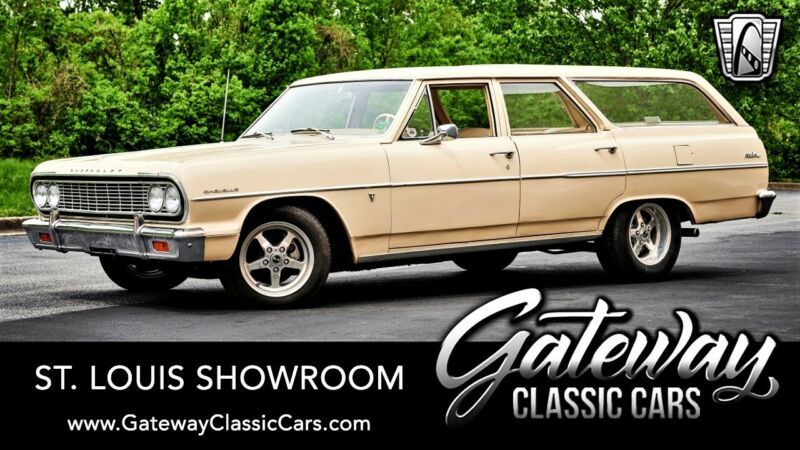
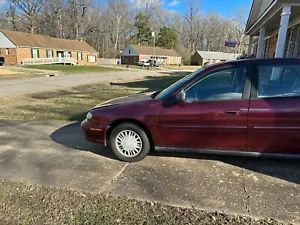
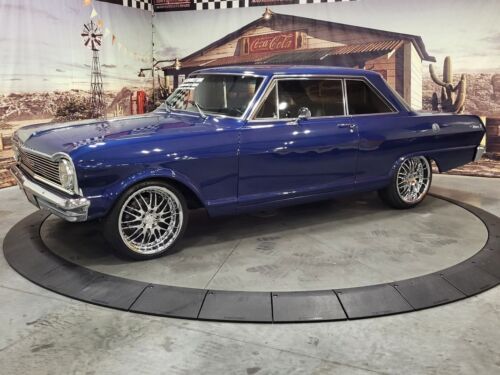
Photos
Pictures below are not fancy pictures from manufacturer catalog. It's all photos of real vehicles that were on sale on United States market. You can click on any picture to see specific vehicle and its VIN report.


The graph below is a depreciation curve for 1964 CHEVROLET MALIBU. It shows how much this model looses per year in price. This analytics is calculated using sales records from BADVIN database.
The table below shows average price for used 1964 CHEVROLET MALIBU in each year since the year of manufacturing, current year price and projected price in the future years.
You can scroll the table horizontally to see all columns.
| Year | Average Mileage | Average Price | % Left | % Lost | ||
|---|---|---|---|---|---|---|
| 1964 MSRP | 0 mi | $27,395 | — | — | 100% | 0% |
| 1964 | 10,681 mi | $23,646 | +$3,749 | +13.68% | 86.32% | 13.68% |
| 1965 | 21,362 mi | $21,998 | +$1,648 | +6.97% | 80.3% | 19.7% |
| 1966 | 32,043 mi | $19,888 | +$2,110 | +9.59% | 72.6% | 27.4% |
| 1967 | 42,724 mi | $18,900 | +$988 | +4.97% | 68.99% | 31.01% |
| 1968 | 53,405 mi | $17,423 | +$1,477 | +7.81% | 63.6% | 36.4% |
| → Visit 1964 CHEVROLET MALIBU depreciation page to see full data. | ||||||
The graph below shows how mileage affects the price for 1964 CHEVROLET MALIBU. This data was calculated using sales records from BADVIN database.
The table below shows average price for used 1964 CHEVROLET MALIBU by mileage and number of sales.
You can scroll the table horizontally to see all columns.
| Mileage | Average Price | Sample Size |
|---|---|---|
| 0 mi | $39,500 | 75 sales |
| 10,000 mi | $42,000 | 30 sales |
| 20,000 mi | $35,497 | 17 sales |
| 40,000 mi | $59,900 | 16 sales |
| 60,000 mi | $21,250 | 12 sales |
| 75,000 mi | $32,000 | 20 sales |
| → Visit 1964 CHEVROLET MALIBU depreciation page to see full data. | ||
Other years of CHEVROLET MALIBU

1982 CHEVROLET MALIBU
0+ sales records
2001 CHEVROLET MALIBU
$3,995 average used price
1,500+ sales records

2003 CHEVROLET MALIBU
$3,997 average used price
3,100+ sales records

2005 CHEVROLET MALIBU
$4,482 average used price
6,800+ sales records

2010 CHEVROLET MALIBU
$6,295 average used price
26,300+ sales records

2022 CHEVROLET MALIBU
$19,888 average used price
32,900+ sales records
Similar Models
1965 CHEVROLET NOVA
$39,900 MSRP
$23,795 average used price
580+ sales records

1966 CHEVROLET CLASSIC
$4,600 MSRP
20+ sales records

1966 CHEVROLET SS
$50,020 MSRP
610+ sales records

1967 CHEVROLET CHEVELLE
$69,900 MSRP
$64,978 average used price
4,500+ sales records
1967 CHEVROLET EL CAMINO
$24,990 MSRP
$39,950 average used price
990+ sales records

1967 CHEVROLET C/K1500
$12,339 MSRP
0+ sales records
Frequently asked questions
To possibly get a vehicle history report by VIN, you can enter the VIN on our website's search tool; the availability and detail of the report will depend on the data accessible for that specific VIN.
The window sticker benefits car dealers by providing a standardized set of information that aids in promoting transparency and trust with customers, facilitating a smoother sales process.
Registration information, if available, includes current and historical registration data, offering insights into the vehicle's ownership timeline.
The expected depreciation of a vehicle after three years can vary, but generally, cars lose a significant portion of their value within the first few years.
Documentation, if available, includes details of theft and vandalism incidents, showing the extent of damage and any recovery actions taken for the vehicle vehicle.
Safety Recalls
With over 1.4 million Chevrolets sold yearly in the U.S., up to 25% may have open safety recalls. A VIN check identifies any unresolved issues.
Accident History
Decoding the VIN reveals if a used Chevy has been in accidents or sustained damage, helping you avoid potential mechanical problems.
True Mileage
Odometer fraud is common in used cars. Checking the VIN provides a detailed history report, confirming the actual mileage and protecting your investment.


