
BADVIN vehicle history report for
2018 LAND ROVER RANGE ROVER SPORTVIN: SALWG2RV4JA411132
Get FULL ACCESS to the vehicle history report and see all blurred info.
⭐ Read 206+ reviews from our customers who used BADVIN to avoid buying junk vehicles.
Historical Records
12 events
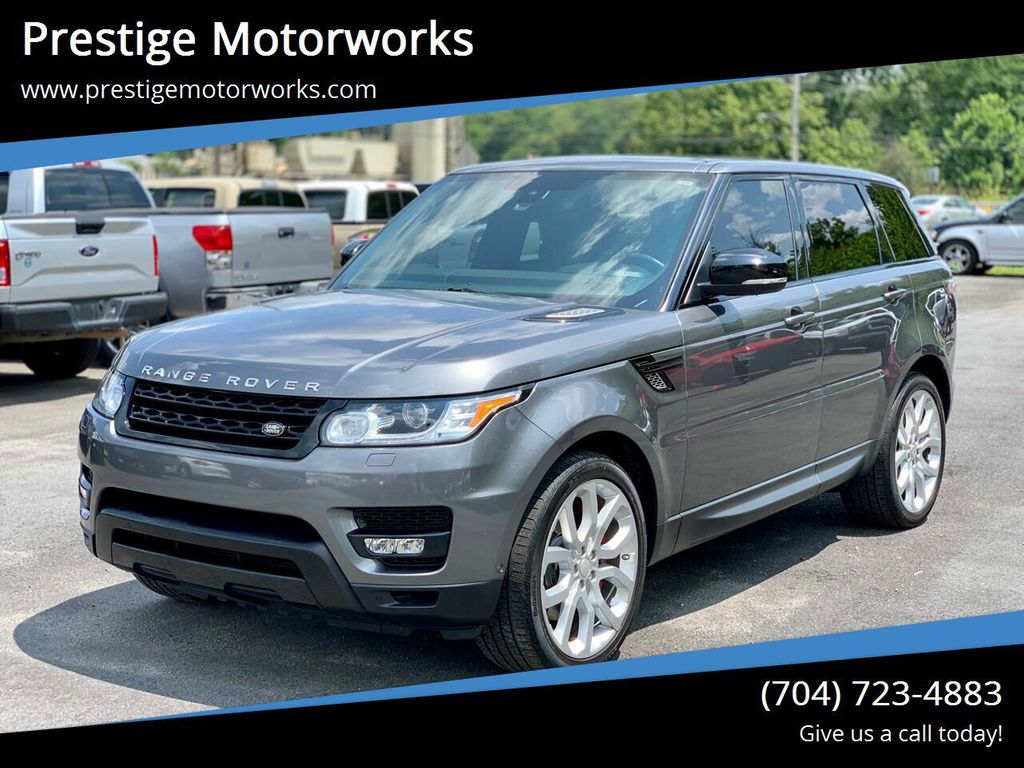
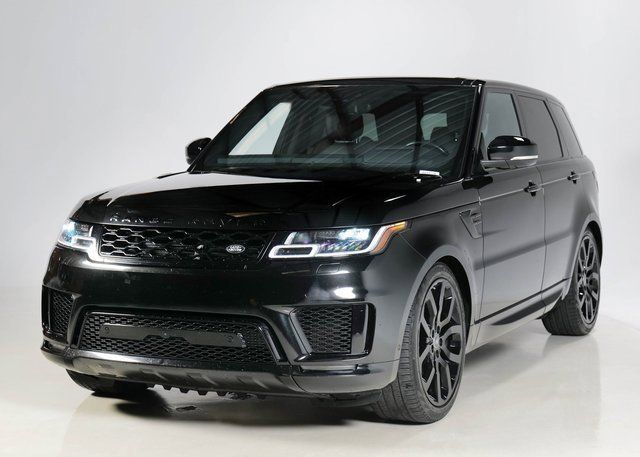
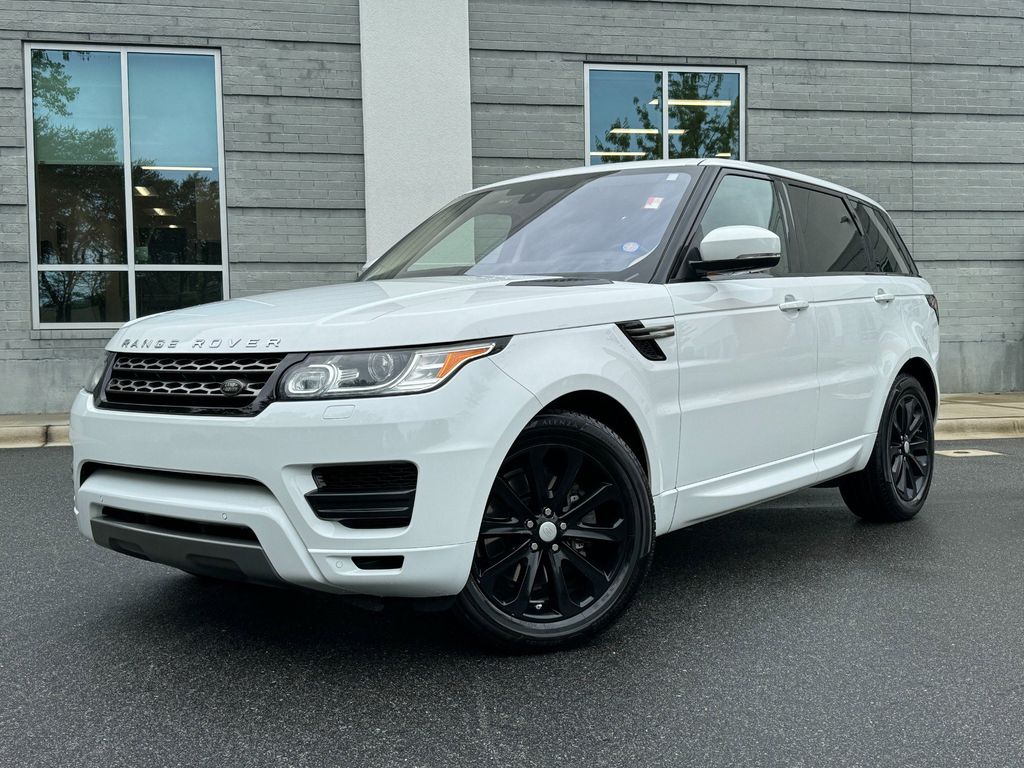
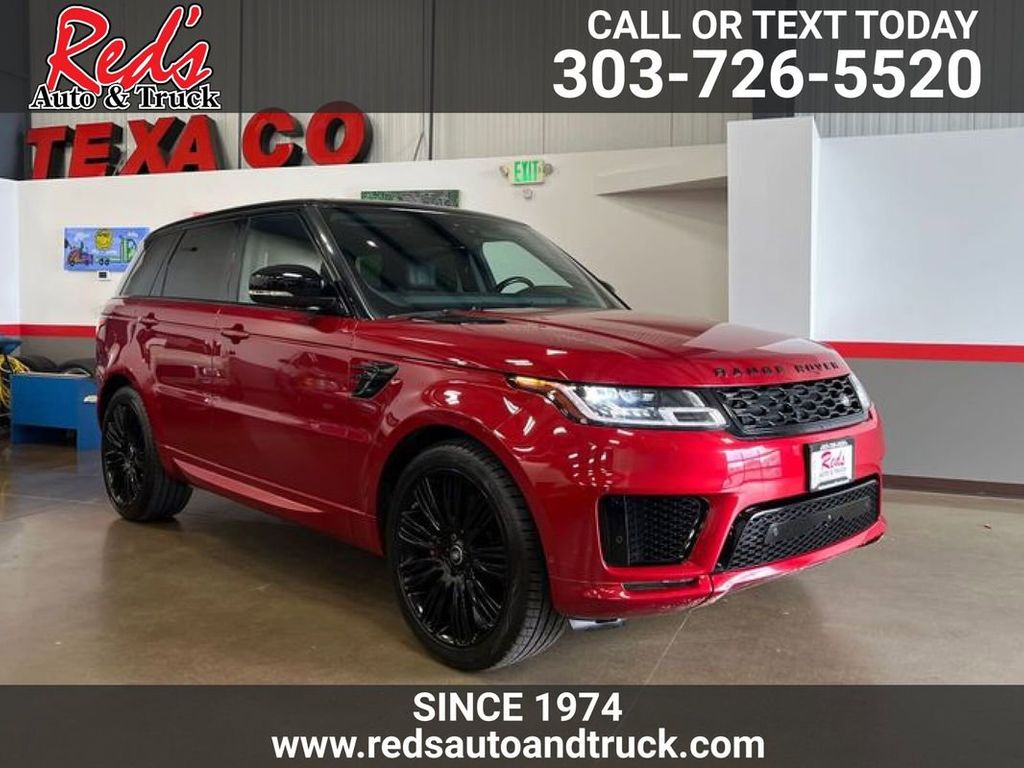
Photos
13 images
Sales History
1 records
Sale Prices
1 records
Market report
Price analytics
Historical Records
Historical records may include service and maintenance records, title status (clean, junk, salvage), insurance records, number of owners, registration events and states, and other information.
You can find more information about historical records in BADVIN reports and see more examples here.
Available 12 historical records for VIN SALWG2RV4JA411132
Latest reported mileage: 298 mi
Below you can see some examples of what these records could look like.
2022-08-30
2 years ago
46,197 mi
Passed emissions inspection
2021-12-24
3 years ago
16,757 mi
Accident reported
Vehicle involved in a sideswipe collision with another motor vehicle
Airbag deployed
Vehicle involved in a sideswipe collision with another motor vehicle
Airbag deployed
2019-09-22
5 years ago
35,654 mi
Vehicle serviced
40,000 mile service performed
40,000 mile service performed
2018 Land Rover Range Rover Sport SE
| Year | 2018 |
| ODO | 5439 mi |
| Seller | Hidden text (Hidden text) |
| Location | Cerritos, CA, 90703 |
| Date | appeared 3 years ago latest price $6583 sale post disappeared 2020-03-02 |
| Sale Website Type | classifieds |
| Notes | |
| Hidden text | |
sale information provided by user #872851


All photos above are REAL and display ACTUAL car. After you get the report you will see full resolution photos.
Tech Specs
| Color | Santorini Exterior |
| Transmission | 8-Speed Automatic Transmission |
| Drive | 4 wheel drive |
Standard Features
All these features are based on a model in general. This specific vehicle may differ.
- 3.73 Axle Ratio
- Hidden text
- Automatic Temperature Control
- Hidden text
- Electronic stability control
- Hidden text
- Auto-Dimming Rear-View Mirror
- Hidden text
- Dual Front Impact Airbags
- Hidden text
- Fully Automatic Headlights
- Hidden text
- Outside temperature display
- Hidden text
- Power Steering
- Hidden text
- Rear Window Defroster
- Hidden text
- Steering Wheel Mounted Audio Controls
- Hidden text
- 8 Speakers
- Hidden text
- Bumpers: Body-Color
- Hidden text
- Four Wheel Independent Suspension
- Hidden text
- Illuminated entry
- Hidden text
- Passenger Door Bin
- Hidden text
- Rain Sensing Wipers
- Hidden text
- Speed control
- Hidden text
- Traction Control
- Hidden text
- Headlight Cleaning
- Hidden text
- Overhead console
- Hidden text
- Radio data system
- Hidden text
- Remote Keyless Entry
- Hidden text
- Telescoping Steering Wheel
- Hidden text
- 14-Way Front Seats w/Memory
- Hidden text
- Auto-Leveling Suspension
- Hidden text
- Dual front side impact airbags
- Hidden text
- Grained Leather Seat Trim
- Hidden text
- Overhead Airbag
- Hidden text
- Power Windows
- Hidden text
- Rear window wiper
- Hidden text
- Tachometer
- Hidden text
- 4-Wheel Disc Brakes
- Hidden text
- Brake Assist
- Hidden text
- Exterior Parking Camera Rear
- Hidden text
- Heated Door Mirrors
- Hidden text
- Panic alarm
- Hidden text
- Radio: Enhanced Sound System (250W)
- Hidden text
- Security System
- Hidden text
- Tilt steering wheel
Model Analytics & Market Report
We've analyzed more than 35,500 sales records of this model and here are some numbers.
The average price for new (MSRP) 2018 LAND ROVER RANGE ROVER SPORT in 2018 was $68,791.
The average price for used 2018 LAND ROVER RANGE ROVER SPORT nowadays in 2024 is $38,995 which is 57% from the original price.
Estimated mileage driven per year is 10,104 miles.
For this model we also have depreciation curve, photos, list of features and options, and other analytics.
Take a look at 2018 LAND ROVER RANGE ROVER SPORT model page in BADVIN vehicles catalog.
Depreciation
The graph below is a depreciation curve for 2018 LAND ROVER RANGE ROVER SPORT. It shows how much this model looses per year in price. This analytics is calculated using sales records from BADVIN database.
The table below shows average price for used 2018 LAND ROVER RANGE ROVER SPORT in each year since the year of manufacturing, current year price and projected price in the future years.
You can scroll the table horizontally to see all columns.
| Year | Average Mileage | Average Price | % Left | % Lost | ||
|---|---|---|---|---|---|---|
| 2018 MSRP | 0 mi | $68,791 | — | — | 100% | 0% |
| 2018 | 10,104 mi | $99,040 | −$30,249 | −43.97% | 143.97% | -43.97% |
| 2019 | 20,208 mi | $92,990 | +$6,050 | +6.11% | 135.18% | -35.18% |
| 2020 | 30,312 mi | $67,249 | +$25,741 | +27.68% | 97.76% | 2.24% |
| 2021 | 40,416 mi | $56,348 | +$10,901 | +16.21% | 81.91% | 18.09% |
| 2022 | 50,520 mi | $49,900 | +$6,448 | +11.44% | 72.54% | 27.46% |
| → Visit 2018 LAND ROVER RANGE ROVER SPORT depreciation page to see full data. | ||||||
Price vs Mileage
The graph below shows how mileage affects the price for 2018 LAND ROVER RANGE ROVER SPORT. This data was calculated using sales records from BADVIN database.
The table below shows average price for used 2018 LAND ROVER RANGE ROVER SPORT by mileage and number of sales.
You can scroll the table horizontally to see all columns.
| Mileage | Average Price | Sample Size |
|---|---|---|
| 10,000 mi | $51,998 | 16 sales |
| 15,000 mi | $55,199 | 23 sales |
| 20,000 mi | $52,497 | 55 sales |
| 25,000 mi | $51,305 | 124 sales |
| 30,000 mi | $51,224 | 210 sales |
| 35,000 mi | $50,000 | 289 sales |
| → Visit 2018 LAND ROVER RANGE ROVER SPORT depreciation page to see full data. | ||
Get FULL ACCESS to the vehicle history report and see all blurred info.
⭐ Read 206+ reviews from our customers who used BADVIN to avoid buying junk vehicles.
Testimonials from our customers
BadVin's vehicle history report is a must-have before buying any used vehicle. It's saved me from a few lemons over the years - cars that looked great on the surface but had hidden issues like accidents or title problems. Well worth the price.

Camila Santos
verified on Trustpilot
As a first time used car buyer, I was nervous about getting ripped off. The vehicle report from badvin gave me so much more confidence - it confirmed the car had a clean history and the mileage lined up. Such a relief to have that peace of mind.
Chloe Martin
verified on Trustpilot
Bad Vin's vehicle history report showed that the 2018 Audi A4 I was about to buy had been in a major accident that was not disclosed by the seller. The severity analysis helped me avoid a bad purchase. Great service!
Sophie Dubois
verified on Trustpilot
As a car dealer importing vehicles from the US to Mexico, I rely on badvin for comprehensive history reports before bidding at auctions. Their info has helped me avoid several salvage vehicles and is more thorough than carfax. A must-have service!
Javier Ramirez
verified on Trustpilot
Compare to other 2018 LAND ROVER RANGE ROVER SPORT


Other vehicles sales records


Frequently asked questions
If theft records are present, it’s crucial to ensure the vehicle has been recovered and legally cleared for sale to avoid potential legal issues, depending on the accuracy of the data.
Total loss is usually determined when the cost of repairing the vehicle exceeds a certain percentage of its value before the damage occurred, as decided by the insurance company, if such data is recorded.
Test vehicle status, if reported, reveals use in trials or development, which may involve experimental features and adjustments in the 2018 LAND ROVER RANGE ROVER SPORT.
The Monroney label helps you understand the added features on a 2018 LAND ROVER RANGE ROVER SPORT by listing optional equipment and packages included in the vehicle, along with their pricing.
Sales descriptions may provide detailed narratives of the 2018 LAND ROVER vehicle’s features and condition at the time of each sale, highlighting potential changes and upgrades, depending on available data.
Our vehicle history reports may include records of repairs undertaken after accidents, detailing the nature of the damage and the types of repairs, if this information is available.
VIN decoding can prevent fraud in the sale of 2018 LAND ROVER RANGE ROVER SPORT vehicles by ensuring the vehicle's details match those recorded officially, thus confirming its identity and legality.


