
BADVIN vehicle history report for
2017 HYUNDAI SANTA FEVIN: KM8SM4HF6HU181960
Get FULL ACCESS to the vehicle history report and see all blurred info.
⭐ Read 205+ reviews from our customers who used BADVIN to avoid buying junk vehicles.
Historical Records
events
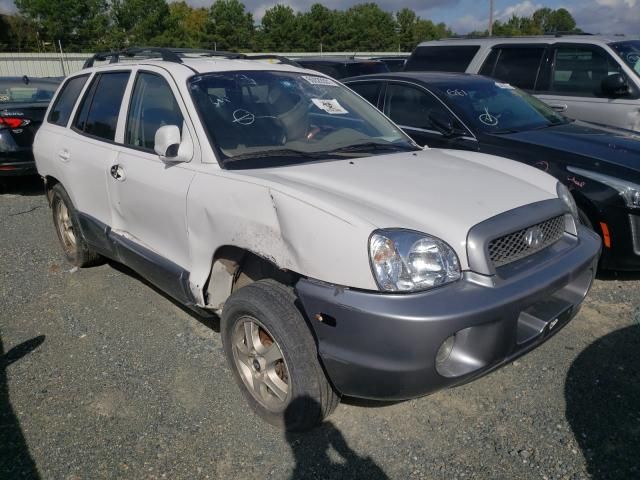
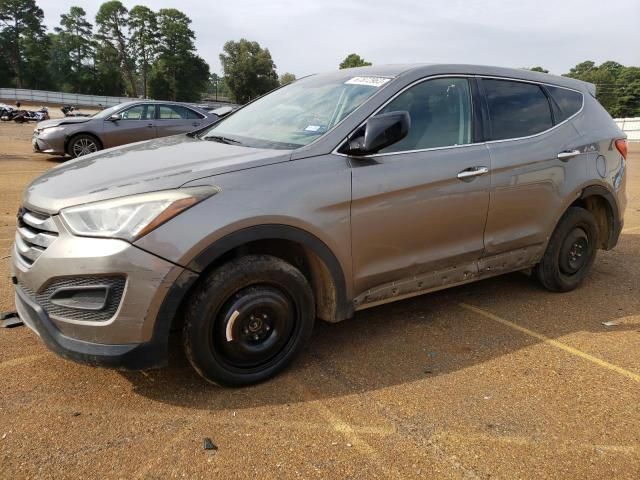
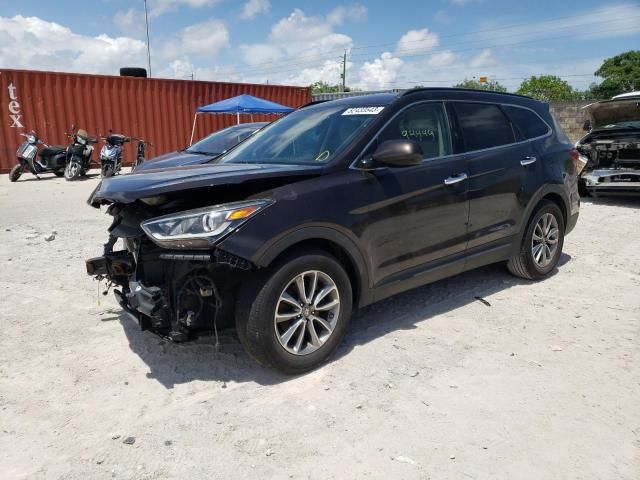
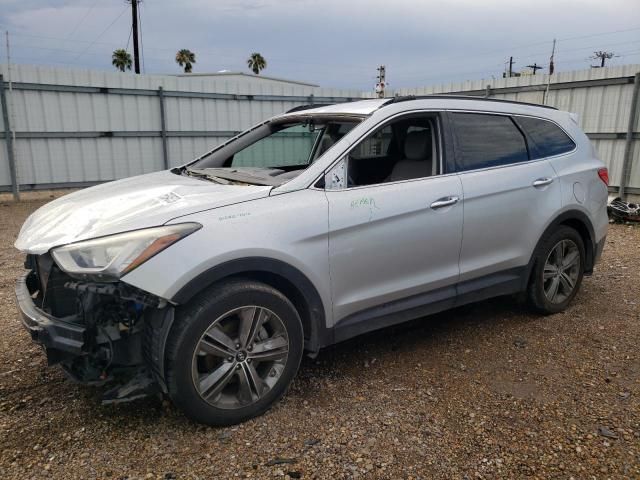
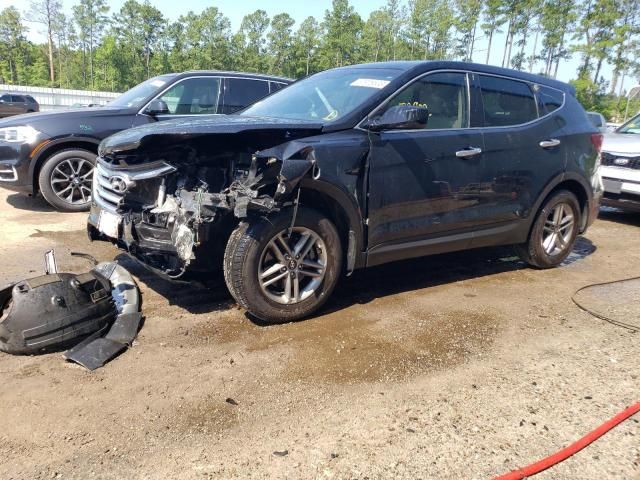
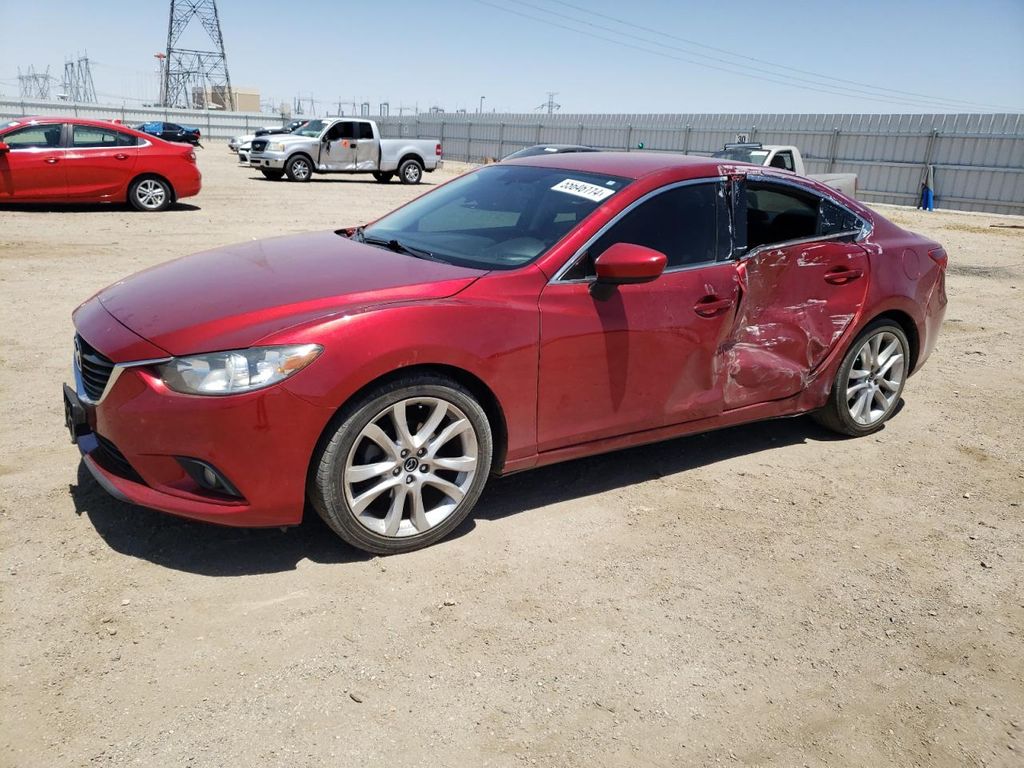
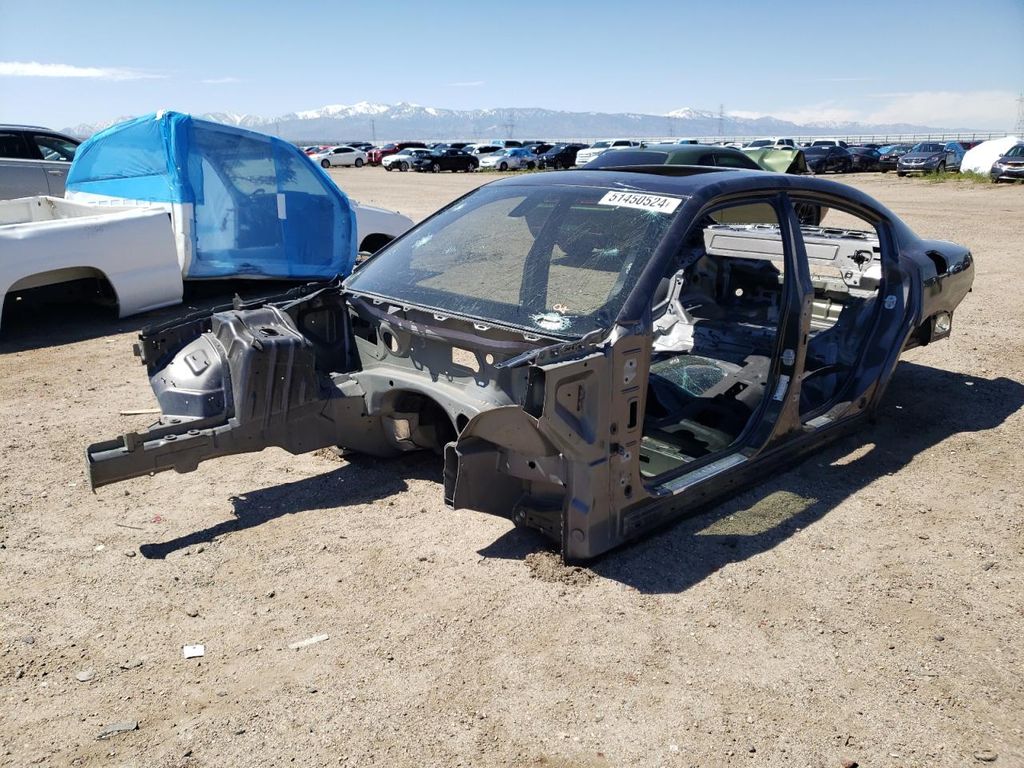
Photos
13 images
Sales History
1 records
Sale Prices
1 records
Market report
Price analytics
Historical Records
Historical records may include service and maintenance records, title status (clean, junk, salvage), insurance records, number of owners, registration events and states, and other information.
You can find more information about historical records in BADVIN reports and see more examples here.
Available historical records for VIN KM8SM4HF6HU181960
Latest reported mileage: 625 mi
Below you can see some examples of what these records could look like.
2023-08-18
10 months ago
114,702 mi
Vehicle serviced
40,000 mile service performed
40,000 mile service performed
2022-01-17
2 years ago
11,957 mi
Odometer reading reported
2019-06-30
5 years ago
29,844 mi
Vehicle sold
MILEAGE INCONSISTENCY
MILEAGE INCONSISTENCY
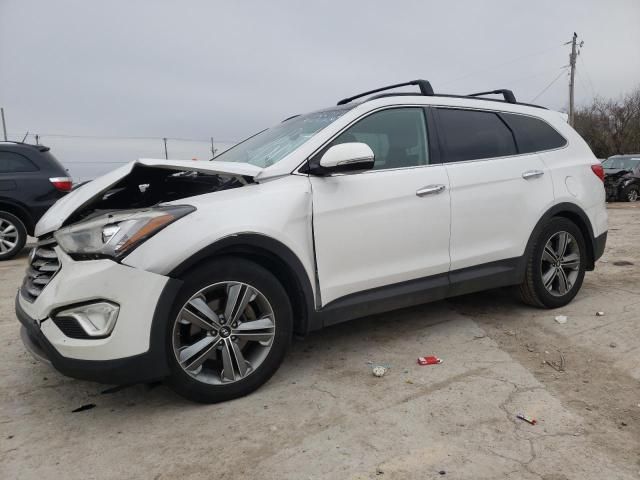
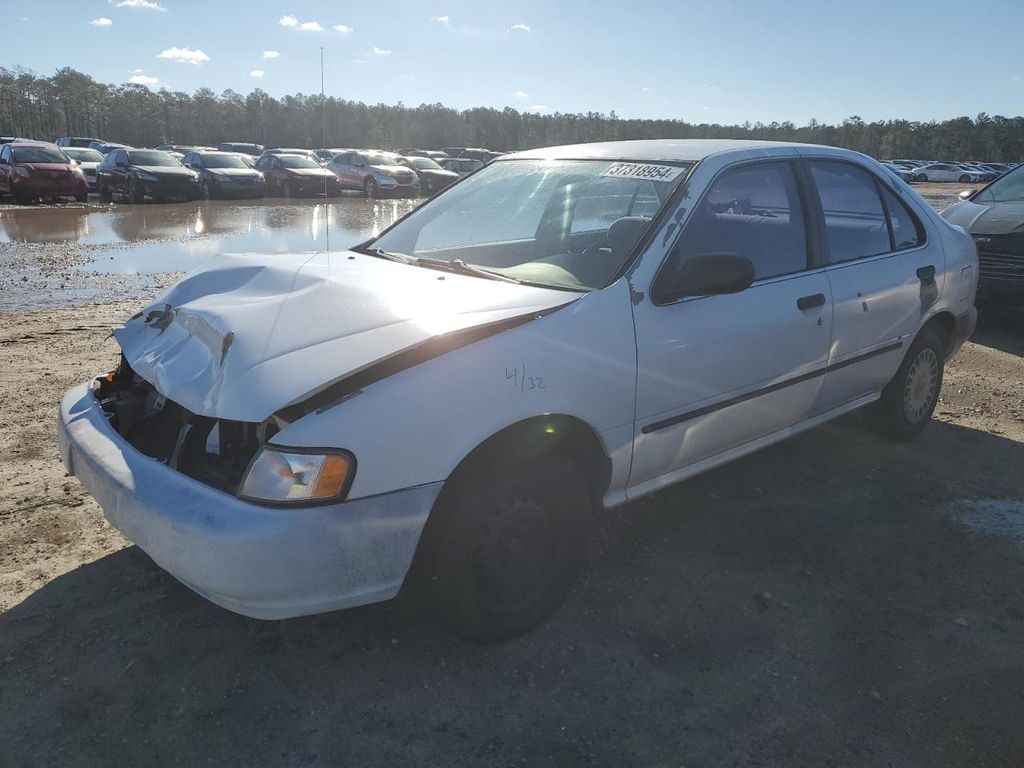
2017 HYUNDAI SANTA FE SE
sold
| Year | 2017 |
| Title | Hidden text (Hidden text) |
| ODO | 9678 mi (Hidden text) |
| Damage | Hidden text, Hidden text |
| Estimated Retail Value | $1237 |
| Location | Hayward, CA, 94544 |
| Date | ended a year ago |
| Sale Website Type | salvage or insurance auction |
sale information provided by user #998599


All photos above are REAL and display ACTUAL car. After you get the report you will see full resolution photos.
Tech Specs
| Body Style | 4DR SPOR |
| Color | WHITE |
| Transmission | AUTOMATIC |
| Engine | 3.3L 6 |
| Drive | Front-wheel Drive |
| Fuel Type | GAS |
Model Analytics & Market Report
We've analyzed more than 131,700 sales records of this model and here are some numbers.
The average price for new (MSRP) 2017 HYUNDAI SANTA FE in 2017 was $31,445.
The average price for used 2017 HYUNDAI SANTA FE nowadays in 2024 is $15,695 which is 50% from the original price.
Estimated mileage driven per year is 10,883 miles.
For this model we also have depreciation curve, photos, list of features and options, and other analytics.
Take a look at 2017 HYUNDAI SANTA FE model page in BADVIN vehicles catalog.
Depreciation
The graph below is a depreciation curve for 2017 HYUNDAI SANTA FE. It shows how much this model looses per year in price. This analytics is calculated using sales records from BADVIN database.
The table below shows average price for used 2017 HYUNDAI SANTA FE in each year since the year of manufacturing, current year price and projected price in the future years.
You can scroll the table horizontally to see all columns.
| Year | Average Mileage | Average Price | % Left | % Lost | ||
|---|---|---|---|---|---|---|
| 2017 MSRP | 0 mi | $31,445 | — | — | 100% | 0% |
| 2017 | 10,883 mi | $41,500 | −$10,055 | −31.98% | 131.98% | -31.98% |
| 2018 | 21,766 mi | $29,441 | +$12,059 | +29.06% | 93.63% | 6.37% |
| 2019 | 32,649 mi | $26,485 | +$2,956 | +10.04% | 84.23% | 15.77% |
| 2020 | 43,532 mi | $24,500 | +$1,985 | +7.49% | 77.91% | 22.09% |
| 2021 | 54,415 mi | $21,995 | +$2,505 | +10.22% | 69.95% | 30.05% |
| → Visit 2017 HYUNDAI SANTA FE depreciation page to see full data. | ||||||
Price vs Mileage
The graph below shows how mileage affects the price for 2017 HYUNDAI SANTA FE. This data was calculated using sales records from BADVIN database.
The table below shows average price for used 2017 HYUNDAI SANTA FE by mileage and number of sales.
You can scroll the table horizontally to see all columns.
| Mileage | Average Price | Sample Size |
|---|---|---|
| 15,000 mi | $21,999 | 13 sales |
| 20,000 mi | $20,998 | 21 sales |
| 25,000 mi | $18,499 | 19 sales |
| 30,000 mi | $20,154 | 38 sales |
| 35,000 mi | $18,915 | 64 sales |
| 40,000 mi | $19,000 | 83 sales |
| → Visit 2017 HYUNDAI SANTA FE depreciation page to see full data. | ||
Get FULL ACCESS to the vehicle history report and see all blurred info.
⭐ Read 205+ reviews from our customers who used BADVIN to avoid buying junk vehicles.
Testimonials from our customers
Bad Vin's vehicle history report showed that the 2018 Audi A4 I was about to buy had been in a major accident that was not disclosed by the seller. The severity analysis helped me avoid a bad purchase. Great service!

Sophie Dubois
verified on Trustpilot
Was shopping for a used Range Rover and found one that seemed suspiciously cheap. The badVIN report revealed it had been in a major front end collision, with photos showing the damage. Steered clear of that one and saved myself a ton of headaches!!
Ava Patel
verified on Trustpilot
Was about to buy a used 2016 Camry but decided to get the badvin report first. Turns out the car had been in a serious crash and was declared a total loss by insurance, even tho carfax showed it as clean! Dodged a bullet on that one. ty badvin
Jessica Nguyen
verified on Trustpilot
BadVin's vehicle history report is a must-have before buying any used vehicle. It's saved me from a few lemons over the years - cars that looked great on the surface but had hidden issues like accidents or title problems. Well worth the price.
Camila Santos
verified on Trustpilot
Compare to other 2017 HYUNDAI SANTA FE


2017 HYUNDAI SANTA FE
in 2 days, 44,209 mi
est retail value $18,074
buy now price $9,400
VIN 5XYZTDLB3HG387698
2018 HYUNDAI SANTA FE
19 days ago, 73,902 mi
est retail value $16,843
buy now price $2,650
VIN 5NMZT3LB8JH098953
Other vehicles sales records


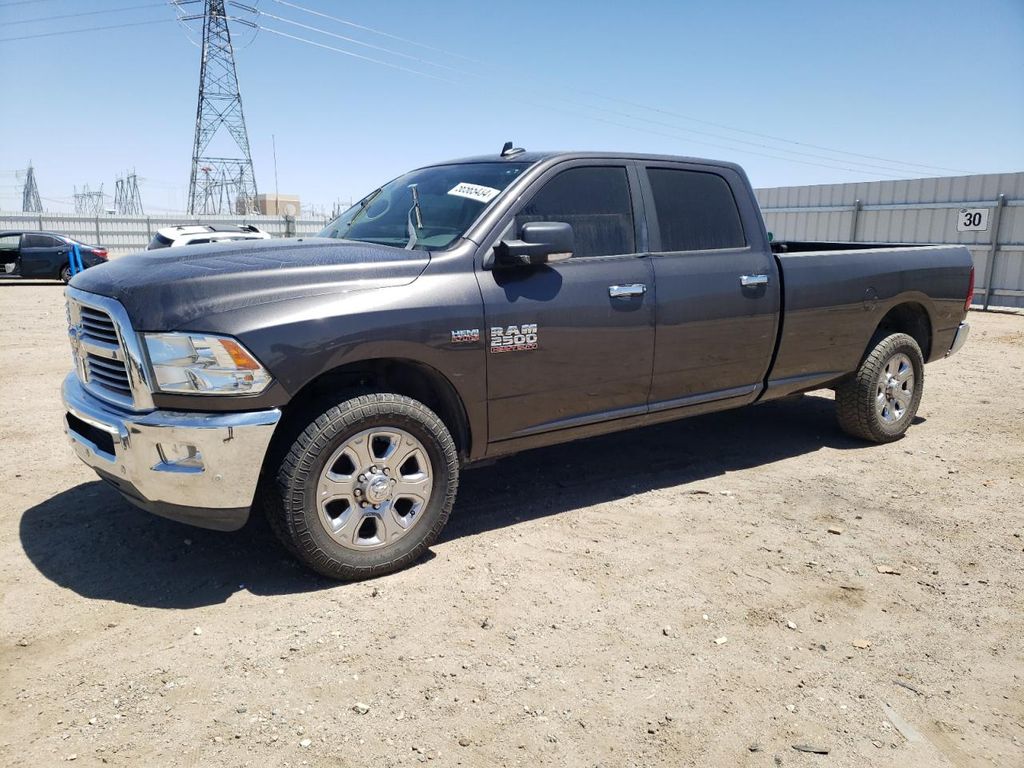
2017 RAM 2500 SLT
in 2 days, 202,207 mi
est retail value $50,000
buy now price $15,000
VIN 3C6TR4JTXHG758560
Frequently asked questions
Accident reports might detail the occurrence, damage severity, and repairs, offering insights into the operational history of the 2017 HYUNDAI, if such data is documented.
The Monroney label helps you understand the added features on a 2017 HYUNDAI SANTA FE by listing optional equipment and packages included in the vehicle, along with their pricing.
Crashed status, if reported, details past accidents and collisions, essential for evaluating the operational history and current state of the 2017 HYUNDAI.
Mileage is considered a major factor in the depreciation of vehicles because it directly correlates with the amount of use and potential wear and tear the vehicle has undergone.
VIN decoding assists in insurance processes by providing accurate vehicle identification, which is crucial for policy creation, risk assessment, and claim processing.
Car depreciation is the decrease in value of a vehicle over time. It's a crucial factor to consider when calculating the total cost of vehicle ownership.
Vehicles that have been flooded may have a specific flood title or watermark in the vehicle history report, indicating significant water damage, if such events are documented.


