
BADVIN vehicle history report for
2020 SUBARU CROSSTREKVIN: JF2GTANC8LH208908
Get FULL ACCESS to the vehicle history report and see all blurred info.
⭐ Read 206+ reviews from our customers who used BADVIN to avoid buying junk vehicles.
Historical Records
events
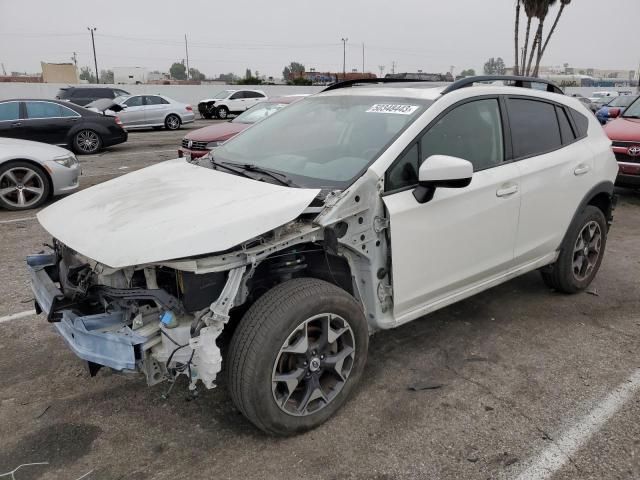
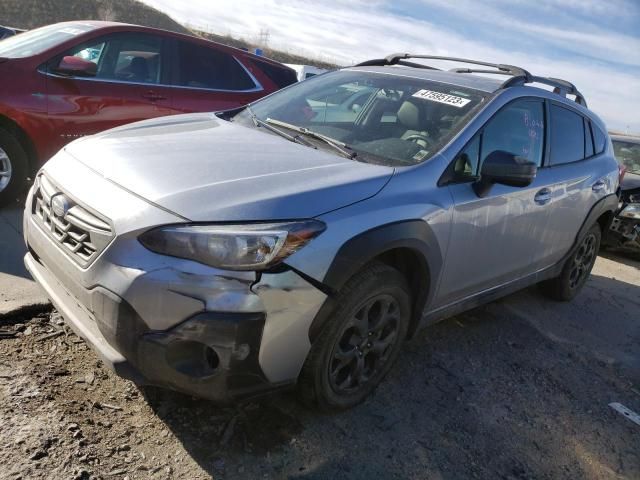
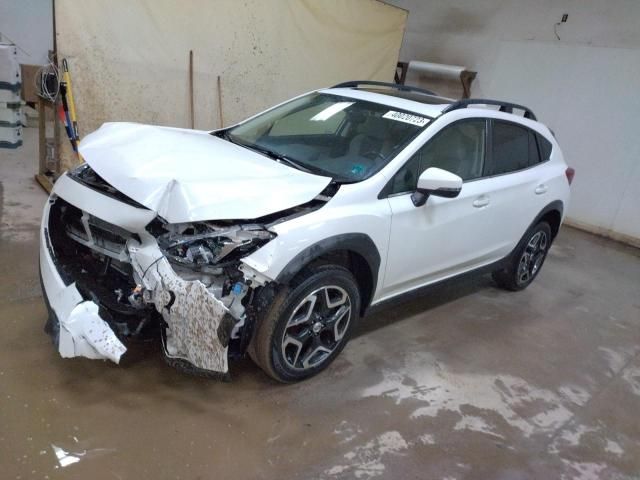
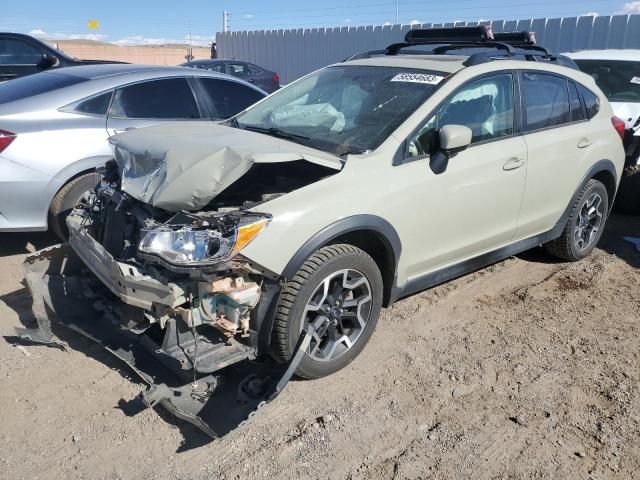
Photos
9 images
Sales History
1 records
Market report
Price analytics
Historical Records
Historical records may include service and maintenance records, title status (clean, junk, salvage), insurance records, number of owners, registration events and states, and other information.
You can find more information about historical records in BADVIN reports and see more examples here.
Available historical records for VIN JF2GTANC8LH208908
Latest reported mileage: 255 mi
Below you can see some examples of what these records could look like.
2023-12-25
6 months ago
65,266 mi
Sold as a BMW Certified Pre-Owned Vehicle
2022-06-30
2 years ago
11,177 mi
Passed emissions inspection
2021-02-10
3 years ago
25,703 mi
TOTAL LOSS VEHICLE
Collision damage reported
Collision damage reported
Sale Record
2020 SUBARU CROSSTREK LIMITED
sold
| Year | 2020 |
| Title | Hidden text (Hidden text) |
| ODO | 1216 mi (Hidden text) |
| Damage | Hidden text |
| Estimated Retail Value | $4057 |
| Estimated Repair Cost | $1061 (661%) |
| Location | Long Island, NY, 11716 |
| Date | ended 2 years ago |
| Sale Website Type | salvage or insurance auction |
sale information provided by user #500076


All photos above are REAL and display ACTUAL car. After you get the report you will see full resolution photos.
Tech Specs
| Color | GRAY |
| Transmission | AUTOMATIC |
| Engine | 2.0L 4 |
| Drive | All wheel drive |
| Fuel Type | GAS |
Model Analytics & Market Report
We've analyzed more than 52,800 sales records of this model and here are some numbers.
The average price for new (MSRP) 2020 SUBARU CROSSTREK in 2020 was $26,495.
The average price for used 2020 SUBARU CROSSTREK nowadays in 2024 is $23,900 which is 90% from the original price.
Estimated mileage driven per year is 10,572 miles.
For this model we also have depreciation curve, photos, list of features and options, and other analytics.
Take a look at 2020 SUBARU CROSSTREK model page in BADVIN vehicles catalog.
Depreciation
The graph below is a depreciation curve for 2020 SUBARU CROSSTREK. It shows how much this model looses per year in price. This analytics is calculated using sales records from BADVIN database.
The table below shows average price for used 2020 SUBARU CROSSTREK in each year since the year of manufacturing, current year price and projected price in the future years.
You can scroll the table horizontally to see all columns.
| Year | Average Mileage | Average Price | % Left | % Lost | ||
|---|---|---|---|---|---|---|
| 2020 MSRP | 0 mi | $26,495 | — | — | 100% | 0% |
| 2020 | 10,572 mi | $28,625 | −$2,130 | −8.04% | 108.04% | -8.04% |
| 2021 | 21,144 mi | $27,700 | +$925 | +3.23% | 104.55% | -4.55% |
| 2022 | 31,716 mi | $26,889 | +$811 | +2.93% | 101.49% | -1.49% |
| 2023 | 42,288 mi | $25,000 | +$1,889 | +7.03% | 94.36% | 5.64% |
| 2024 | 52,860 mi | $23,900 | +$1,100 | +4.4% | 90.21% | 9.79% |
| → Visit 2020 SUBARU CROSSTREK depreciation page to see full data. | ||||||
Price vs Mileage
The graph below shows how mileage affects the price for 2020 SUBARU CROSSTREK. This data was calculated using sales records from BADVIN database.
The table below shows average price for used 2020 SUBARU CROSSTREK by mileage and number of sales.
You can scroll the table horizontally to see all columns.
| Mileage | Average Price | Sample Size |
|---|---|---|
| 5,000 mi | $27,627 | 144 sales |
| 10,000 mi | $27,963 | 355 sales |
| 15,000 mi | $27,490 | 591 sales |
| 20,000 mi | $26,996 | 938 sales |
| 25,000 mi | $26,587 | 1,025 sales |
| 30,000 mi | $26,450 | 1,013 sales |
| → Visit 2020 SUBARU CROSSTREK depreciation page to see full data. | ||
Get FULL ACCESS to the vehicle history report and see all blurred info.
⭐ Read 206+ reviews from our customers who used BADVIN to avoid buying junk vehicles.
Testimonials from our customers
Purchased a badvin report before buying a used Lexus RX 350. It revealed a minor accident the seller hadn't mentioned. I still bought the car but used the info to negotiate a lower price. Well worth the cost for the leverage it gave me!

Aiden Patel
verified on Trustpilot
I've tried many vehicle reports but badvin's is by far the most comprehensive. It shows accident photos, past sales, repairs and so much more. I won't buy a car now without getting a report first. It's a must-have.
Alexander Hunt
verified on Trustpilot
Ich hätte fast einen 2017 Mercedes-Benz C300 gekauft, bis der Bad Vin-Bericht zeigte, dass er als durch Überschwemmung beschädigt gemeldet wurde. Die detaillierten Schadensaufzeichnungen haben mich vor einem großen Fehler bewahrt!
Sophia Müller
verified on Trustpilot
Was shopping for a used Range Rover and found one that seemed suspiciously cheap. The badVIN report revealed it had been in a major front end collision, with photos showing the damage. Steered clear of that one and saved myself a ton of headaches!!
Ava Patel
verified on Trustpilot
Compare to other 2020 SUBARU CROSSTREK
2022 SUBARU CROSSTREK
3 days ago, 13,947 mi
est retail value $32,691
buy now price $9,500
VIN JF2GTHSC9NH268874
2018 SUBARU CROSSTREK
in 3 days, 92,996 mi
est retail value $21,381
buy now price $5,200
VIN JF2GTAMC0JH201689
Other vehicles sales records


2012 FORD F450
6 days ago, 224,953 mi
est retail value $19,340
buy now price $1,600
VIN 1FDUF4HY2CED10705

Frequently asked questions
Water damage, if documented, is detailed with information on the extent and impact, affecting the 2020 SUBARU's electrical systems, engine, and overall functionality.
Our reports may track major service milestones such as brake rotor replacements, detailing when and how often they have occurred, if this information is recorded.
Yes, in many cases, you can determine the type of drivetrain a 2020 SUBARU CROSSTREK has from its VIN if the manufacturer encodes this information within the VIN.
Proper maintenance and good condition can slow the depreciation of a 2020 SUBARU CROSSTREK by making it more attractive to potential buyers, thereby preserving more of its value.
A VIN alone does not typically provide fuel economy details directly; however, it can identify the vehicle model and engine type, which you can cross-reference with fuel economy data from other sources.
The depreciation rate can be influenced by factors such as the vehicle's condition, mileage, market demand, and the pace of technological advancements in newer models.


