
BADVIN vehicle history report for
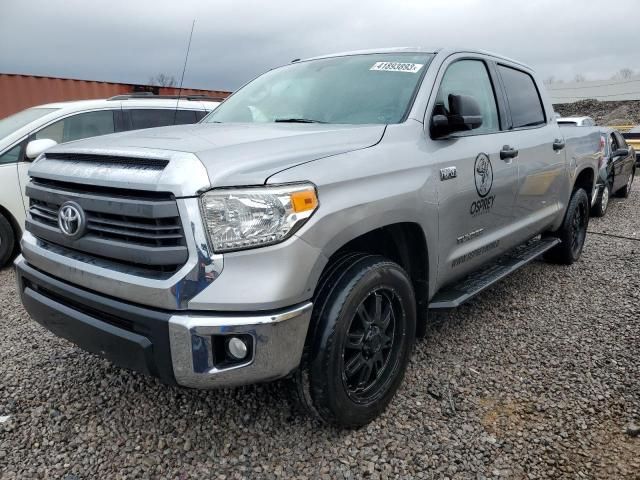
2014 TOYOTA TUNDRAVIN: 5TFUY5F17EX405598
Get FULL ACCESS to the vehicle history report and see all blurred info.
⭐ Read 206+ reviews from our customers who used BADVIN to avoid buying junk vehicles.
Historical Records
54 events
Market report
Price analytics
Historical Records
Historical records may include service and maintenance records, title status (clean, junk, salvage), insurance records, number of owners, registration events and states, and other information.
You can find more information about historical records in BADVIN reports and see more examples here.
Available 54 historical records for VIN 5TFUY5F17EX405598
Latest reported mileage: 2379 mi
Below you can see some examples of what these records could look like.
2023-03-18
a year ago
75,293 mi
Vehicle serviced
40,000 mile service performed
40,000 mile service performed
2021-12-03
3 years ago
21,607 mi
NOT ACTUAL MILEAGE TITLE ISSUED
Titled or registered as lease vehicle
Titled or registered as lease vehicle
2020-03-22
4 years ago
46,062 mi
Damage reported: very minor damage
Damage to rear
Damage to rear
Model Analytics & Market Report
We've analyzed more than 69,000 sales records of this model and here are some numbers.
The average price for new (MSRP) 2014 TOYOTA TUNDRA in 2014 was $50,857.
The average price for used 2014 TOYOTA TUNDRA nowadays in 2024 is $25,606 which is 50% from the original price.
Estimated mileage driven per year is 11,272 miles.
For this model we also have depreciation curve, photos, list of features and options, and other analytics.
Take a look at 2014 TOYOTA TUNDRA model page in BADVIN vehicles catalog.
Depreciation
The graph below is a depreciation curve for 2014 TOYOTA TUNDRA. It shows how much this model looses per year in price. This analytics is calculated using sales records from BADVIN database.
The table below shows average price for used 2014 TOYOTA TUNDRA in each year since the year of manufacturing, current year price and projected price in the future years.
You can scroll the table horizontally to see all columns.
| Year | Average Mileage | Average Price | % Left | % Lost | ||
|---|---|---|---|---|---|---|
| 2014 MSRP | 0 mi | $50,857 | — | — | 100% | 0% |
| 2014 | 11,272 mi | $59,999 | −$9,142 | −17.98% | 117.98% | -17.98% |
| 2015 | 22,544 mi | $56,989 | +$3,010 | +5.02% | 112.06% | -12.06% |
| 2016 | 33,816 mi | $48,974 | +$8,015 | +14.06% | 96.3% | 3.7% |
| 2017 | 45,088 mi | $42,729 | +$6,245 | +12.75% | 84.02% | 15.98% |
| 2018 | 56,360 mi | $40,764 | +$1,965 | +4.6% | 80.15% | 19.85% |
| → Visit 2014 TOYOTA TUNDRA depreciation page to see full data. | ||||||
Price vs Mileage
The graph below shows how mileage affects the price for 2014 TOYOTA TUNDRA. This data was calculated using sales records from BADVIN database.
The table below shows average price for used 2014 TOYOTA TUNDRA by mileage and number of sales.
You can scroll the table horizontally to see all columns.
| Mileage | Average Price | Sample Size |
|---|---|---|
| 20,000 mi | $39,498 | 10 sales |
| 25,000 mi | $35,907 | 23 sales |
| 30,000 mi | $33,238 | 30 sales |
| 35,000 mi | $33,990 | 31 sales |
| 40,000 mi | $33,588 | 69 sales |
| 45,000 mi | $32,995 | 77 sales |
| → Visit 2014 TOYOTA TUNDRA depreciation page to see full data. | ||
Testimonials from our customers
BadVin's vehicle history report is a must-have before buying any used vehicle. It's saved me from a few lemons over the years - cars that looked great on the surface but had hidden issues like accidents or title problems. Well worth the price.

Camila Santos
verified on Trustpilot
Was about to buy a used 2016 Camry but decided to get the badvin report first. Turns out the car had been in a serious crash and was declared a total loss by insurance, even tho carfax showed it as clean! Dodged a bullet on that one. ty badvin
Jessica Nguyen
verified on Trustpilot
Was shopping for a used Range Rover and found one that seemed suspiciously cheap. The badVIN report revealed it had been in a major front end collision, with photos showing the damage. Steered clear of that one and saved myself a ton of headaches!!
Ava Patel
verified on Trustpilot
As a used car dealer, I rely on badvin.org for checking every vehicle I'm considering purchasing at auction. The comprehensive reports give me peace of mind and help me avoid problem cars. Photos of past sales have saved me from overpaying many times. Worth every penny!
Misha
verified on Trustpilot
Compare to other 2014 TOYOTA TUNDRA
Other vehicles sales records

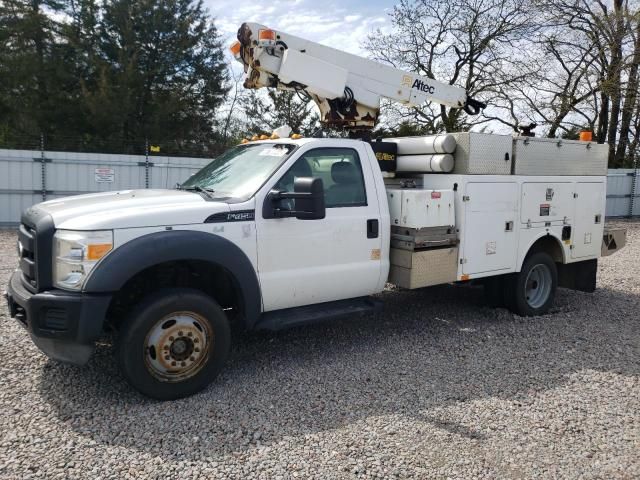
2012 FORD F450
7 days ago, 224,953 mi
est retail value $19,340
buy now price $1,600
VIN 1FDUF4HY2CED10705


2020 FORD EXPLORER
in 4 days, 40,053 mi
est retail value $27,285
buy now price $6,500
VIN 1FMSK8DH2LGB92045


Frequently asked questions
Depreciation directly affects the resale value of a 2014 TOYOTA TUNDRA, with faster depreciating vehicles typically having lower resale values over time.
The average depreciation rate for vehicles over five years can vary, but many models experience a significant portion of their depreciation within the first few years of ownership.
Our reports may include information on any past recalls issued for 2014 TOYOTA vehicles, detailing the nature of the recall and whether it was addressed, if data is available.
The vehicle history report may include a section on theft history, showing if the vehicle was ever reported stolen, depending on the records available.
Market value is generally estimated based on the 2014 TOYOTA vehicle’s history, condition, and comparable sales, helping to provide a guideline for buyers and sellers, though specific values can vary.
Yes, the choice of vehicle color can impact the depreciation rate, with neutral colors typically being easier to sell and potentially holding their value better than more unconventional colors.
While not necessary, decoding a VIN for a routine service appointment can provide the mechanic with precise model information, facilitating accurate service and parts replacement.
Open liens, if reported, are shown with lender details and the date the loan was initiated, important for assessing financial obligations on the 2014 TOYOTA vehicle.


