
BADVIN vehicle history report for
2018 TOYOTA TUNDRAVIN: 5TFUY5F11JX728300
Get FULL ACCESS to the vehicle history report and see all blurred info.
⭐ Read 206+ reviews from our customers who used BADVIN to avoid buying junk vehicles.
Historical Records
events
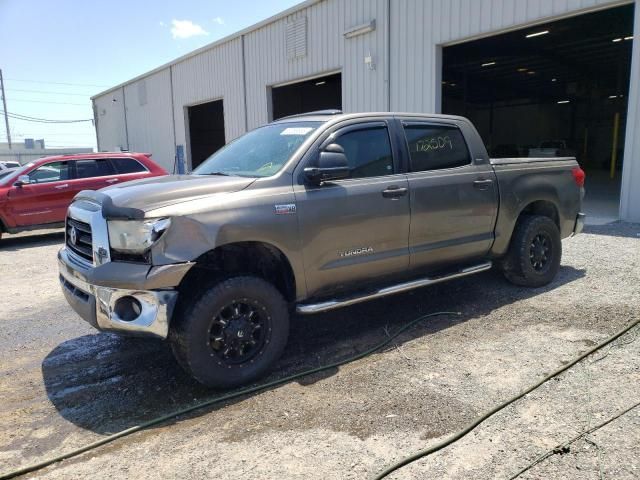
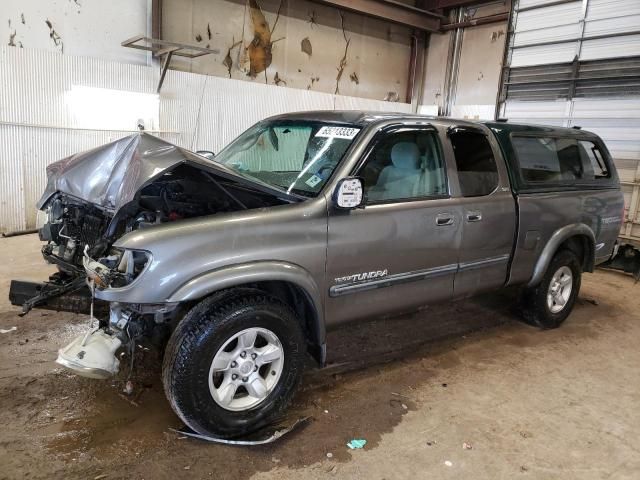
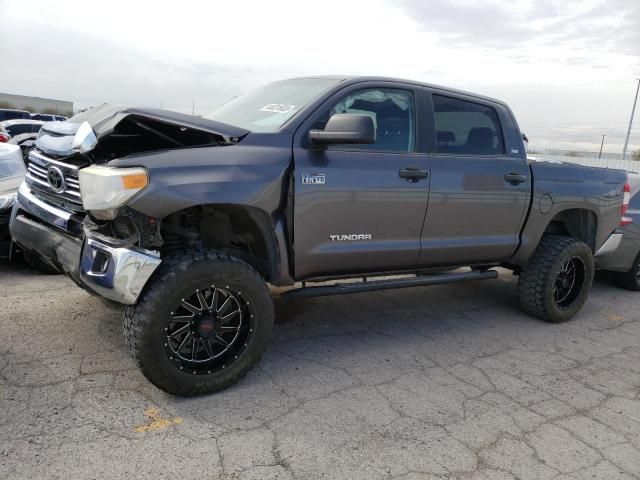
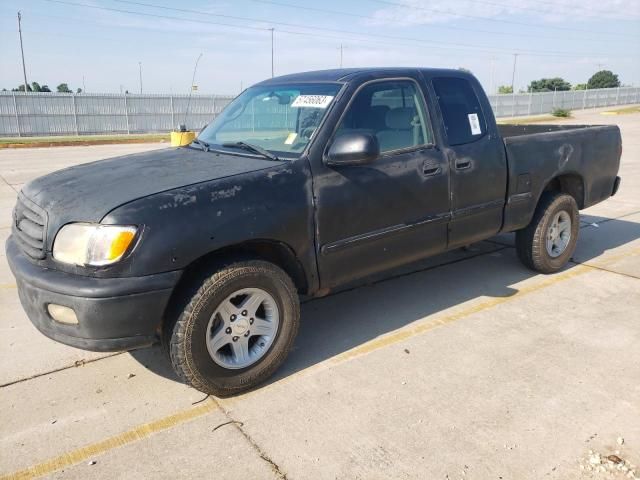
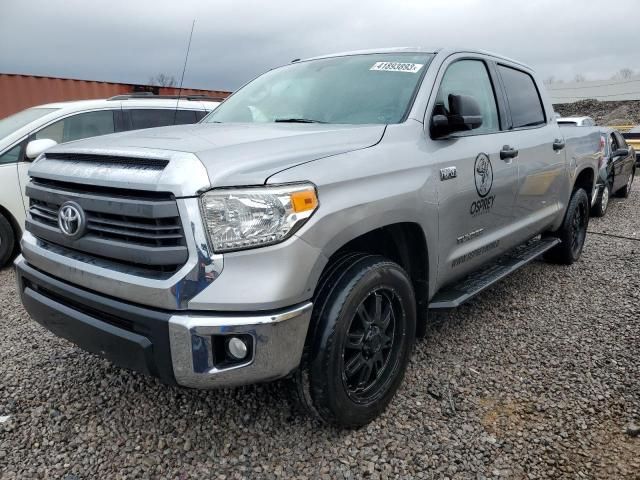
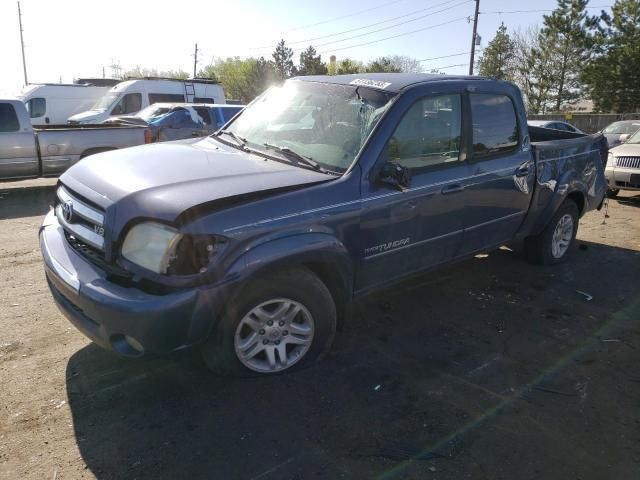
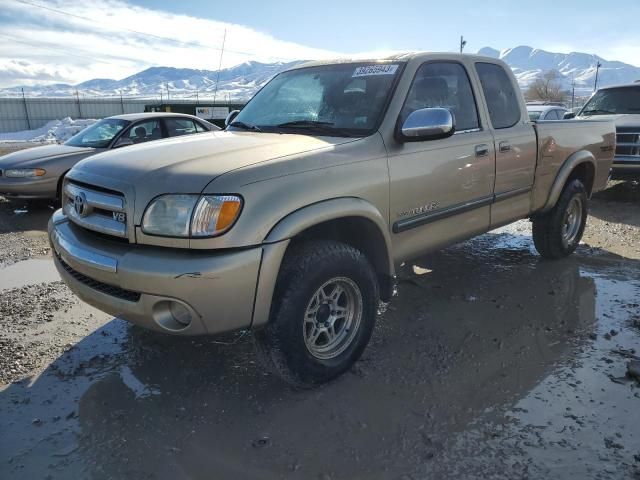
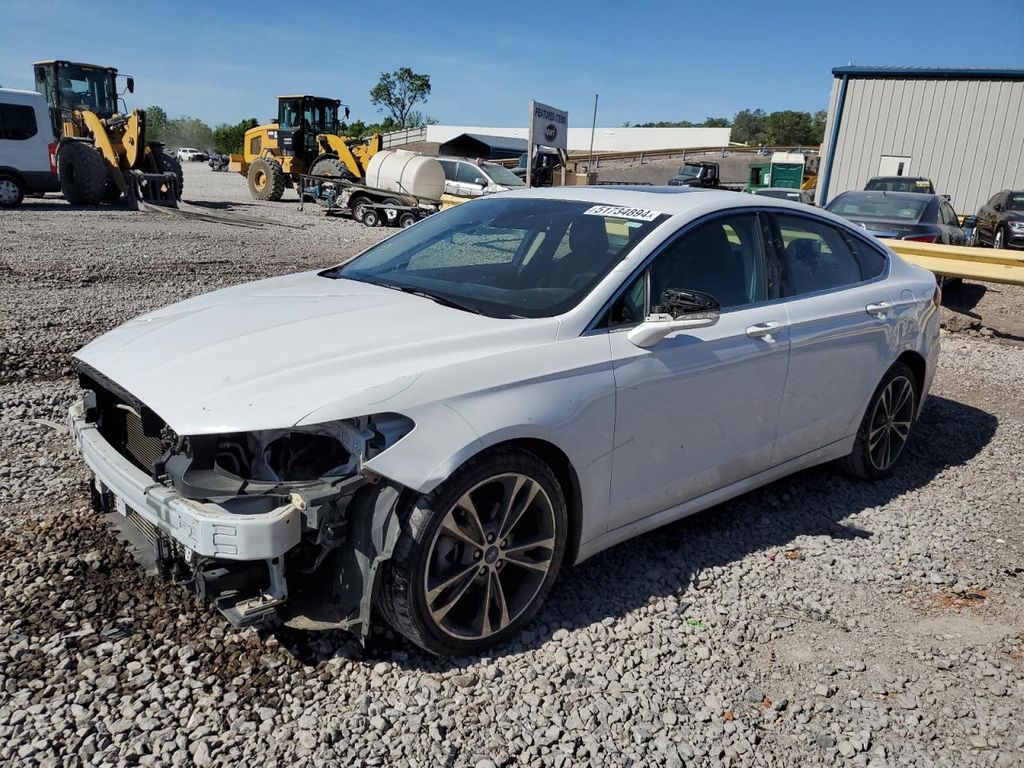
Photos
10 images
Sales History
1 records
Sale Prices
1 records
Market report
Price analytics
Historical Records
Historical records may include service and maintenance records, title status (clean, junk, salvage), insurance records, number of owners, registration events and states, and other information.
You can find more information about historical records in BADVIN reports and see more examples here.
Available historical records for VIN 5TFUY5F11JX728300
Latest reported mileage: 893 mi
Below you can see some examples of what these records could look like.
2023-12-08
7 months ago
120,053 mi
NOT ACTUAL MILEAGE TITLE ISSUED
Titled or registered as lease vehicle
Titled or registered as lease vehicle
2021-11-07
3 years ago
19,515 mi
Sold as a BMW Certified Pre-Owned Vehicle
2020-08-04
4 years ago
40,194 mi
Vehicle serviced
Outer tie rod(s) replaced
Alignment performed
Outer tie rod(s) replaced
Alignment performed
2018 TOYOTA TUNDRA DOUBLE CAB SR/SR5
sold
| Year | 2018 |
| Title | Hidden text (Hidden text) |
| ODO | 5148 mi (Hidden text) |
| Damage | Hidden text, Hidden text |
| Estimated Retail Value | $1325 |
| Estimated Repair Cost | $3298 (363%) |
| Location | Altoona, PA, 16602 |
| Date | ended 2 years ago |
| Sale Website Type | salvage or insurance auction |
sale information provided by user #656602


All photos above are REAL and display ACTUAL car. After you get the report you will see full resolution photos.
Tech Specs
| Color | BLACK |
| Transmission | AUTOMATIC |
| Engine | 5.7L 8 |
| Drive | 4x4 w/Rear Wheel Drv |
| Fuel Type | GAS |
Model Analytics & Market Report
We've analyzed more than 102,800 sales records of this model and here are some numbers.
The average price for new (MSRP) 2018 TOYOTA TUNDRA in 2018 was $50,857.
The average price for used 2018 TOYOTA TUNDRA nowadays in 2024 is $35,499 which is 70% from the original price.
Estimated mileage driven per year is 11,272 miles.
For this model we also have depreciation curve, photos, list of features and options, and other analytics.
Take a look at 2018 TOYOTA TUNDRA model page in BADVIN vehicles catalog.
Depreciation
The graph below is a depreciation curve for 2018 TOYOTA TUNDRA. It shows how much this model looses per year in price. This analytics is calculated using sales records from BADVIN database.
The table below shows average price for used 2018 TOYOTA TUNDRA in each year since the year of manufacturing, current year price and projected price in the future years.
You can scroll the table horizontally to see all columns.
| Year | Average Mileage | Average Price | % Left | % Lost | ||
|---|---|---|---|---|---|---|
| 2018 MSRP | 0 mi | $50,857 | — | — | 100% | 0% |
| 2018 | 11,272 mi | $59,999 | −$9,142 | −17.98% | 117.98% | -17.98% |
| 2019 | 22,544 mi | $56,989 | +$3,010 | +5.02% | 112.06% | -12.06% |
| 2020 | 33,816 mi | $48,974 | +$8,015 | +14.06% | 96.3% | 3.7% |
| 2021 | 45,088 mi | $42,729 | +$6,245 | +12.75% | 84.02% | 15.98% |
| 2022 | 56,360 mi | $40,764 | +$1,965 | +4.6% | 80.15% | 19.85% |
| → Visit 2018 TOYOTA TUNDRA depreciation page to see full data. | ||||||
Price vs Mileage
The graph below shows how mileage affects the price for 2018 TOYOTA TUNDRA. This data was calculated using sales records from BADVIN database.
The table below shows average price for used 2018 TOYOTA TUNDRA by mileage and number of sales.
You can scroll the table horizontally to see all columns.
| Mileage | Average Price | Sample Size |
|---|---|---|
| 5,000 mi | $45,000 | 15 sales |
| 10,000 mi | $45,490 | 19 sales |
| 15,000 mi | $39,938 | 48 sales |
| 20,000 mi | $41,988 | 63 sales |
| 25,000 mi | $42,731 | 124 sales |
| 30,000 mi | $39,958 | 184 sales |
| → Visit 2018 TOYOTA TUNDRA depreciation page to see full data. | ||
Get FULL ACCESS to the vehicle history report and see all blurred info.
⭐ Read 206+ reviews from our customers who used BADVIN to avoid buying junk vehicles.
Testimonials from our customers
Bad Vin's vehicle history report showed that the 2018 Audi A4 I was about to buy had been in a major accident that was not disclosed by the seller. The severity analysis helped me avoid a bad purchase. Great service!

Sophie Dubois
verified on Trustpilot
I buy rebuilt title cars at copart to fix and resell. was hoping BadVin reports wud have more detail on damage history to help me value cars before bidding, Carfax is better for that. but for clean title vehicles it seems pretty useful
Fatima
verified on Trustpilot
As a broke college kid I almost settled for a sketchy 2005 Altima cuz it was cheap. but splurged on the report from badvin 1st. soooo glad I did - turned out it had been totalled and rebuilt. spending a little saved me from wasting $1000s!
Sophie
verified on Trustpilot
I've tried a bunch of different vehicle history reports over the years and badvin.org has been the most comprehensive by far. Stuff like service records, ownership history, lien and repo info that I haven't found elsewhere. Def go-to resource when shopping for used vehicles now.
Levi Johnson
verified on Trustpilot
Compare to other 2018 TOYOTA TUNDRA

2016 TOYOTA TUNDRA CREWMAX
a month ago, 96,247 mi
est retail value $30,999
buy now price $10,900
VIN 5TFDY5F13GX532111
2004 TOYOTA TUNDRA
a month ago, 127,894 mi
est retail value $15,973
buy now price $1,225
VIN 5TBDT44104S439603
Other vehicles sales records


Frequently asked questions
Accident history may include reports of any collisions the 2018 TOYOTA TUNDRA has been involved in, detailing the extent of damage and subsequent repairs, if such incidents are documented.
Our reports may identify vehicles used for commercial purposes, detailing the extent of such use and its impact on the 2018 TOYOTA's condition, if such records are available.
Strategies to reduce the rate of depreciation include regular maintenance, keeping mileage low, avoiding significant modifications, and keeping up with all necessary repairs.
Yes, a VIN decoder can provide detailed specifications for a used 2018 TOYOTA TUNDRA, including its assembly line specifications like engine details and optional equipment.
The window sticker is important for new car buyers as it ensures transparency about the vehicle's origins, features, and costs, helping consumers make informed decisions.
Emission inspection status may show whether the 2018 TOYOTA vehicle has passed required state emissions testing, which is essential for registration in many areas, if such inspections have been documented.
The VIN can provide information about the body style of a 2018 TOYOTA TUNDRA, such as whether it is a sedan, coupe, or SUV, based on specific characters in the VIN sequence.
Use as a police or taxi vehicle, if noted, indicates high-intensity use which may affect the 2018 TOYOTA vehicle's condition and lifespan, if such use is documented.
While not necessary, decoding a VIN for a routine service appointment can provide the mechanic with precise model information, facilitating accurate service and parts replacement.
Sales prices from past transactions may be documented in our reports, providing a price history that aids in determining current market value, if such data is available.


