
BADVIN vehicle history report for
2022 TOYOTA TUNDRAVIN: 5TFLA5DA1NX003465
Get FULL ACCESS to the vehicle history report and see all blurred info.
⭐ Read 206+ reviews from our customers who used BADVIN to avoid buying junk vehicles.
Historical Records
25 events
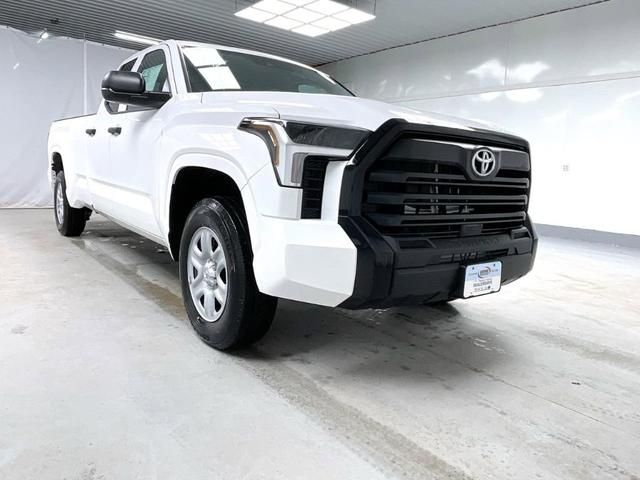
Photos
1 images
Sales History
1 records
Sale Prices
1 records
Market report
Price analytics
Historical Records
Historical records may include service and maintenance records, title status (clean, junk, salvage), insurance records, number of owners, registration events and states, and other information.
You can find more information about historical records in BADVIN reports and see more examples here.
Available 25 historical records for VIN 5TFLA5DA1NX003465
Latest reported mileage: 656 mi
Below you can see some examples of what these records could look like.
2022-11-22
2 years ago
105,208 mi
Sold as a BMW Certified Pre-Owned Vehicle
2021-12-02
3 years ago
9,896 mi
Vehicle sold
MILEAGE INCONSISTENCY
MILEAGE INCONSISTENCY
2019-05-28
5 years ago
26,079 mi
TOTAL LOSS VEHICLE
Collision damage reported
Collision damage reported
| Year | 2022 |
| ODO | 994 mi |
| Seller | Hidden text (Hidden text) |
| MSRP | $8996 |
| Location | Ardmore, PA, 19003 |
| Date | appeared 2 years ago latest price $3096 sale post disappeared 2021-11-26 |
| Sale Website Type | classifieds |
| Notes | |
| Hidden text | |
sale information provided by user #86975

All photos above are REAL and display ACTUAL car. After you get the report you will see full resolution photos.
Tech Specs
| Body Style | Pickup Truck |
| Color | White |
| Color (Interior) | Black |
| Transmission | – |
| Engine | 3.5L V6 24V PDI DOHC Twin Turbo |
| Drive | Four-wheel Drive |
| Fuel Type | Gasoline |
Model Analytics & Market Report
We've analyzed more than 33,900 sales records of this model and here are some numbers.
The average price for new (MSRP) 2022 TOYOTA TUNDRA in 2022 was $50,857.
The average price for used 2022 TOYOTA TUNDRA nowadays in 2024 is $48,974 which is 96% from the original price.
Estimated mileage driven per year is 11,272 miles.
For this model we also have depreciation curve, photos, list of features and options, and other analytics.
Take a look at 2022 TOYOTA TUNDRA model page in BADVIN vehicles catalog.
Depreciation
The graph below is a depreciation curve for 2022 TOYOTA TUNDRA. It shows how much this model looses per year in price. This analytics is calculated using sales records from BADVIN database.
The table below shows average price for used 2022 TOYOTA TUNDRA in each year since the year of manufacturing, current year price and projected price in the future years.
You can scroll the table horizontally to see all columns.
| Year | Average Mileage | Average Price | % Left | % Lost | ||
|---|---|---|---|---|---|---|
| 2022 MSRP | 0 mi | $50,857 | — | — | 100% | 0% |
| 2022 | 11,272 mi | $59,999 | −$9,142 | −17.98% | 117.98% | -17.98% |
| 2023 | 22,544 mi | $56,989 | +$3,010 | +5.02% | 112.06% | -12.06% |
| 2024 | 33,816 mi | $48,974 | +$8,015 | +14.06% | 96.3% | 3.7% |
| 2025 | 45,088 mi | $42,729 | +$6,245 | +12.75% | 84.02% | 15.98% |
| 2026 | 56,360 mi | $40,764 | +$1,965 | +4.6% | 80.15% | 19.85% |
| → Visit 2022 TOYOTA TUNDRA depreciation page to see full data. | ||||||
Price vs Mileage
The graph below shows how mileage affects the price for 2022 TOYOTA TUNDRA. This data was calculated using sales records from BADVIN database.
The table below shows average price for used 2022 TOYOTA TUNDRA by mileage and number of sales.
You can scroll the table horizontally to see all columns.
| Mileage | Average Price | Sample Size |
|---|---|---|
| 0 mi | $52,565 | 34 sales |
| 5,000 mi | $50,998 | 299 sales |
| 10,000 mi | $49,998 | 627 sales |
| 15,000 mi | $49,999 | 943 sales |
| 20,000 mi | $49,998 | 897 sales |
| 25,000 mi | $48,797 | 945 sales |
| → Visit 2022 TOYOTA TUNDRA depreciation page to see full data. | ||
Get FULL ACCESS to the vehicle history report and see all blurred info.
⭐ Read 206+ reviews from our customers who used BADVIN to avoid buying junk vehicles.
Testimonials from our customers
Bad Vin's vehicle history report showed that the 2018 Audi A4 I was about to buy had been in a major accident that was not disclosed by the seller. The severity analysis helped me avoid a bad purchase. Great service!

Sophie Dubois
verified on Trustpilot
I always rely on badvin to check out any used car before I buy. It gives such a complete history, including past accidents, service records, recalls and much more. Feel so much more confident as a used car shopper having this info.
Sofia Garcia
verified on Trustpilot
I've tried a bunch of different vehicle history reports over the years and badvin.org has been the most comprehensive by far. Stuff like service records, ownership history, lien and repo info that I haven't found elsewhere. Def go-to resource when shopping for used vehicles now.
Levi Johnson
verified on Trustpilot
Can't believe what badvin found on a used 2012 chevy silverado I almost bought - odometer had been rolled back 50k miles according to the mileage history! Carfax didnt show nething bout that. So glad I checked here first b4 handing over my hard earned $$
Jackson
verified on Trustpilot
Compare to other 2022 TOYOTA TUNDRA


Other vehicles sales records


Frequently asked questions
Odometer readings in our reports are verified for accuracy, helping protect against fraud and ensuring you get reliable information on the 2022 TOYOTA TUNDRA, if these records are present.
Our reports might include a service history, from oil changes to major overhauls, which can help you gauge the upkeep and condition of the 2022 TOYOTA TUNDRA, depending on the records available.
A VIN decoder can reveal engine details such as the engine size, configuration, and fuel type, which are encoded in specific characters of the VIN.
Accident reports might detail the occurrence, damage severity, and repairs, offering insights into the operational history of the 2022 TOYOTA, if such data is documented.
Our vehicle history reports may indicate if the 2022 TOYOTA vehicle was previously used in commercial services like a taxi or rental car, which may affect its condition and value, if such usage is recorded.
Yes, the Monroney label includes information about the vehicle’s manufacturing origin, specifying where the vehicle was assembled and the origin of its parts.
Some models may depreciate faster due to factors like lower demand, higher maintenance costs, or outdated technology compared to newer versions.


