
BADVIN vehicle history report for
2012 TOYOTA TUNDRAVIN: 5TFDY5F10CX215669
Get FULL ACCESS to the vehicle history report and see all blurred info.
⭐ Read 206+ reviews from our customers who used BADVIN to avoid buying junk vehicles.
Historical Records
events
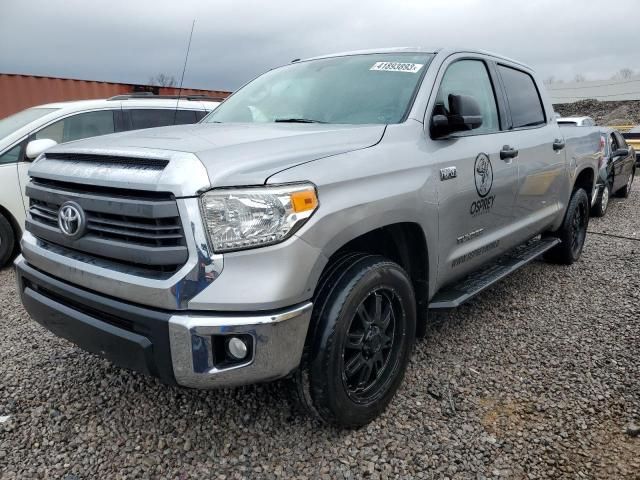
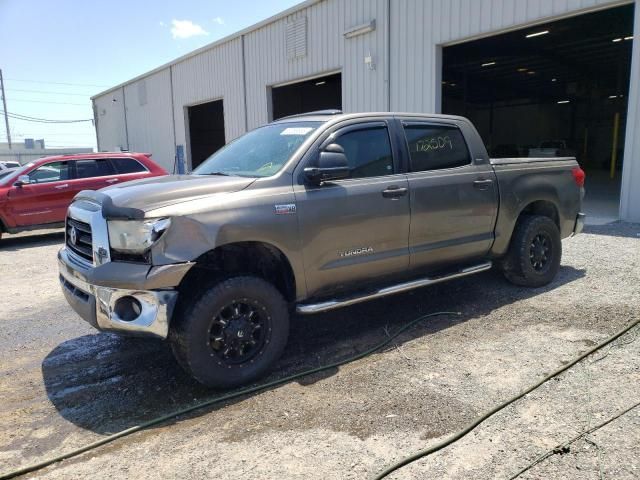
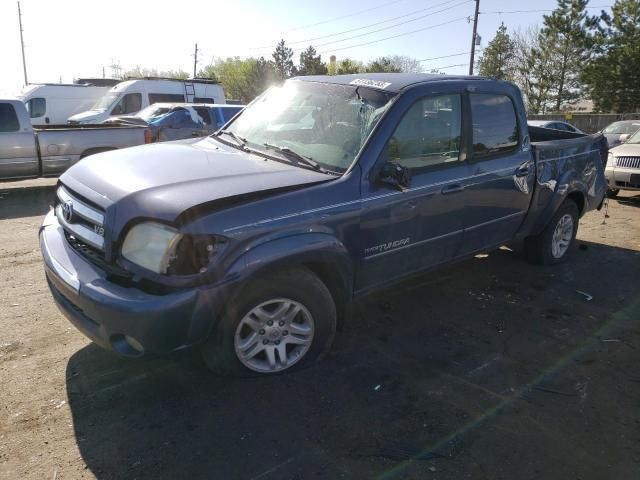
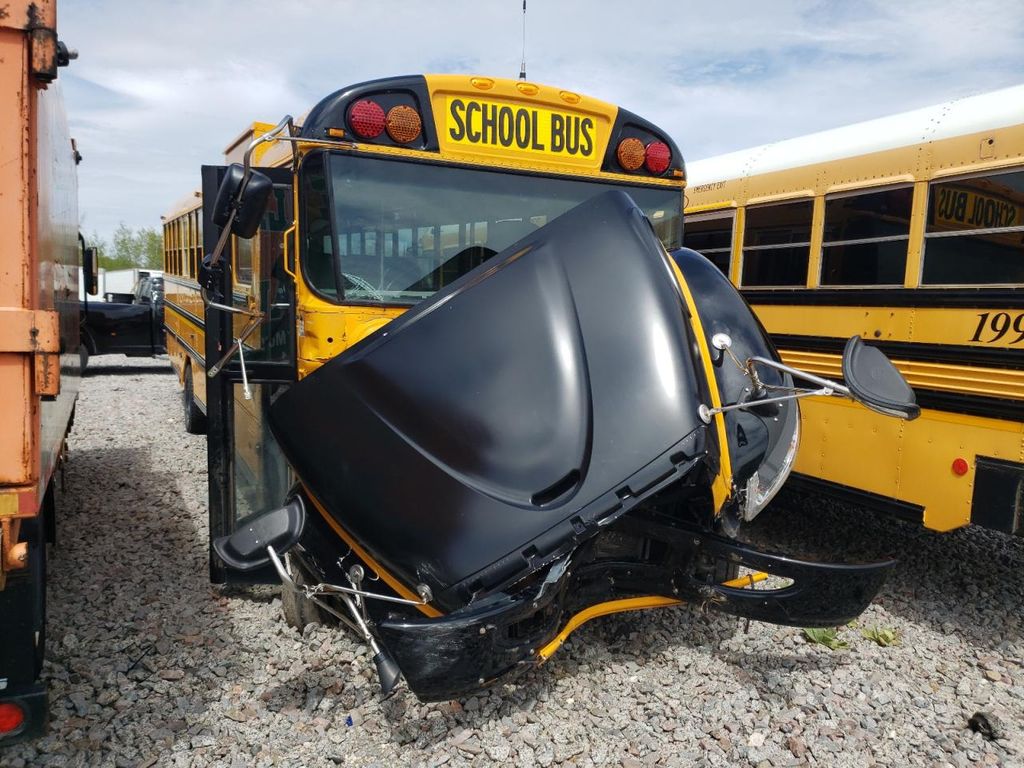
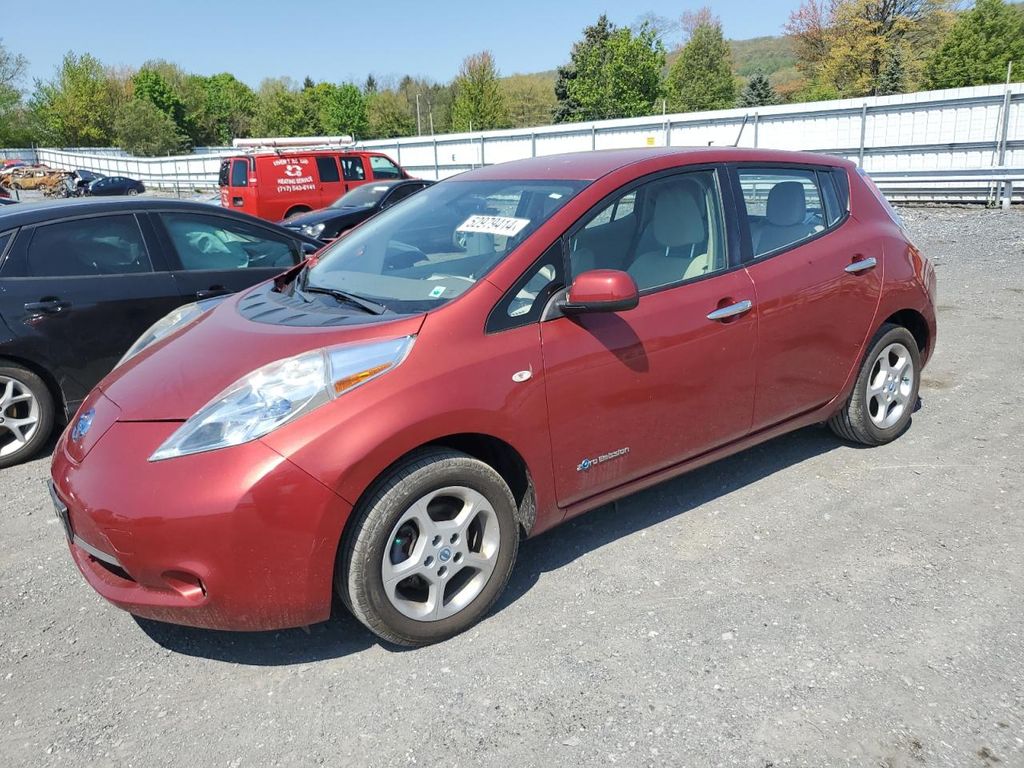
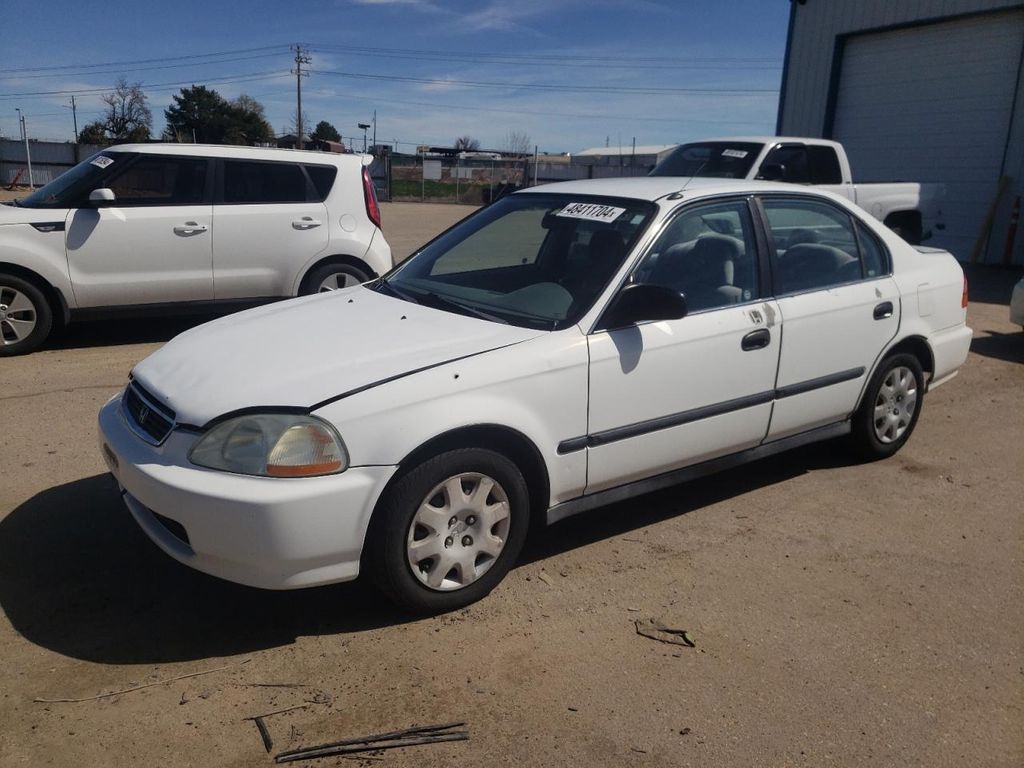
Photos
10 images
Sales History
1 records
Sale Prices
1 records
Market report
Price analytics
Historical Records
Historical records may include service and maintenance records, title status (clean, junk, salvage), insurance records, number of owners, registration events and states, and other information.
You can find more information about historical records in BADVIN reports and see more examples here.
Available historical records for VIN 5TFDY5F10CX215669
Latest reported mileage: 120 mi
Below you can see some examples of what these records could look like.
2023-10-13
8 months ago
38,858 mi
TOTAL LOSS VEHICLE
Collision damage reported
Collision damage reported
2022-07-20
2 years ago
17,926 mi
Damage reported
Damage to front
Damage to front
2021-01-20
3 years ago
31,277 mi
REBUILT TITLE ISSUED
Sale Record
2012 TOYOTA TUNDRA CREWMAX SR5
sold
| Year | 2012 |
| Title | Hidden text (Hidden text) |
| ODO | — (Hidden text) |
| Damage | Hidden text |
| Estimated Retail Value | $5753 |
| Estimated Repair Cost | $7815 (673%) |
| Location | SOUTHERN ILLINOIS, IL |
| Date | ended 2 years ago |
| Sale Website Type | salvage or insurance auction |
sale information provided by user #687083


All photos above are REAL and display ACTUAL car. After you get the report you will see full resolution photos.
Tech Specs
| Color | BLACK |
| Transmission | AUTOMATIC |
| Engine | 5.7L 8 |
| Drive | 4x4 w/Rear Wheel Drv |
| Fuel Type | GAS |
Model Analytics & Market Report
We've analyzed more than 35,000 sales records of this model and here are some numbers.
The average price for new (MSRP) 2012 TOYOTA TUNDRA in 2012 was $50,857.
The average price for used 2012 TOYOTA TUNDRA nowadays in 2024 is $19,980 which is 39% from the original price.
Estimated mileage driven per year is 11,272 miles.
For this model we also have depreciation curve, photos, list of features and options, and other analytics.
Take a look at 2012 TOYOTA TUNDRA model page in BADVIN vehicles catalog.
Depreciation
The graph below is a depreciation curve for 2012 TOYOTA TUNDRA. It shows how much this model looses per year in price. This analytics is calculated using sales records from BADVIN database.
The table below shows average price for used 2012 TOYOTA TUNDRA in each year since the year of manufacturing, current year price and projected price in the future years.
You can scroll the table horizontally to see all columns.
| Year | Average Mileage | Average Price | % Left | % Lost | ||
|---|---|---|---|---|---|---|
| 2012 MSRP | 0 mi | $50,857 | — | — | 100% | 0% |
| 2012 | 11,272 mi | $59,999 | −$9,142 | −17.98% | 117.98% | -17.98% |
| 2013 | 22,544 mi | $56,989 | +$3,010 | +5.02% | 112.06% | -12.06% |
| 2014 | 33,816 mi | $48,974 | +$8,015 | +14.06% | 96.3% | 3.7% |
| 2015 | 45,088 mi | $42,729 | +$6,245 | +12.75% | 84.02% | 15.98% |
| 2016 | 56,360 mi | $40,764 | +$1,965 | +4.6% | 80.15% | 19.85% |
| → Visit 2012 TOYOTA TUNDRA depreciation page to see full data. | ||||||
Price vs Mileage
The graph below shows how mileage affects the price for 2012 TOYOTA TUNDRA. This data was calculated using sales records from BADVIN database.
The table below shows average price for used 2012 TOYOTA TUNDRA by mileage and number of sales.
You can scroll the table horizontally to see all columns.
| Mileage | Average Price | Sample Size |
|---|---|---|
| 25,000 mi | $31,495 | 15 sales |
| 30,000 mi | $29,990 | 11 sales |
| 35,000 mi | $26,991 | 23 sales |
| 40,000 mi | $27,308 | 33 sales |
| 45,000 mi | $26,000 | 31 sales |
| 50,000 mi | $25,940 | 61 sales |
| → Visit 2012 TOYOTA TUNDRA depreciation page to see full data. | ||
Get FULL ACCESS to the vehicle history report and see all blurred info.
⭐ Read 206+ reviews from our customers who used BADVIN to avoid buying junk vehicles.
Testimonials from our customers
Report showed a car I was considering had a prior salvage title from a major accident, even though carfax listed it as clean. Messaged seller asking about it and they made shady excuses. Def avoided a scam thanks to badvin!

Mia Johnson
verified on Trustpilot
Was shopping for a used Range Rover and found one that seemed suspiciously cheap. The badVIN report revealed it had been in a major front end collision, with photos showing the damage. Steered clear of that one and saved myself a ton of headaches!!
Ava Patel
verified on Trustpilot
As a used car dealer, I rely on badvin.org for checking every vehicle I'm considering purchasing at auction. The comprehensive reports give me peace of mind and help me avoid problem cars. Photos of past sales have saved me from overpaying many times. Worth every penny!
Misha
verified on Trustpilot
I almost bought a used Honda but luckily checked the BadVin report first. Turned out it had a salvage title from flood damage that the seller didn't disclose. Phew, dodged a huge issue!
Emily Turner
verified on Trustpilot
Compare to other 2012 TOYOTA TUNDRA
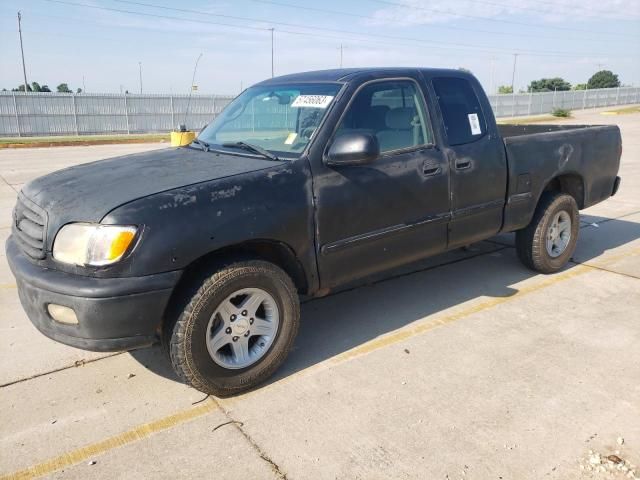
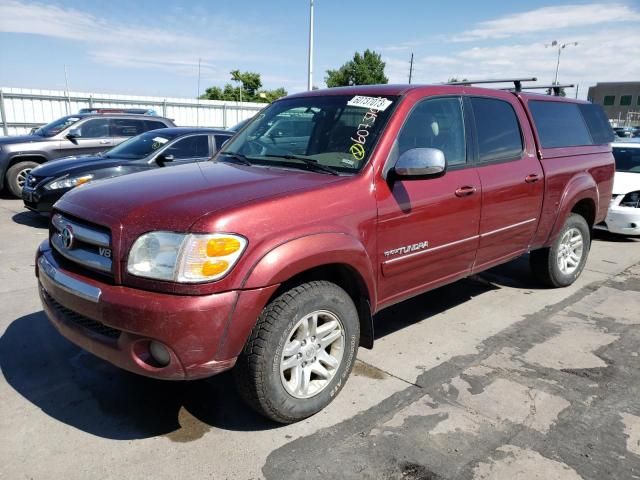
2004 TOYOTA TUNDRA
18 days ago, 127,894 mi
est retail value $15,973
buy now price $1,225
VIN 5TBDT44104S439603
Other vehicles sales records
2021 IC CORPORATION 3000 CE
in 2 days,
est retail value $77,500
buy now price $6,875
VIN 4DRBUC8P4MB273836

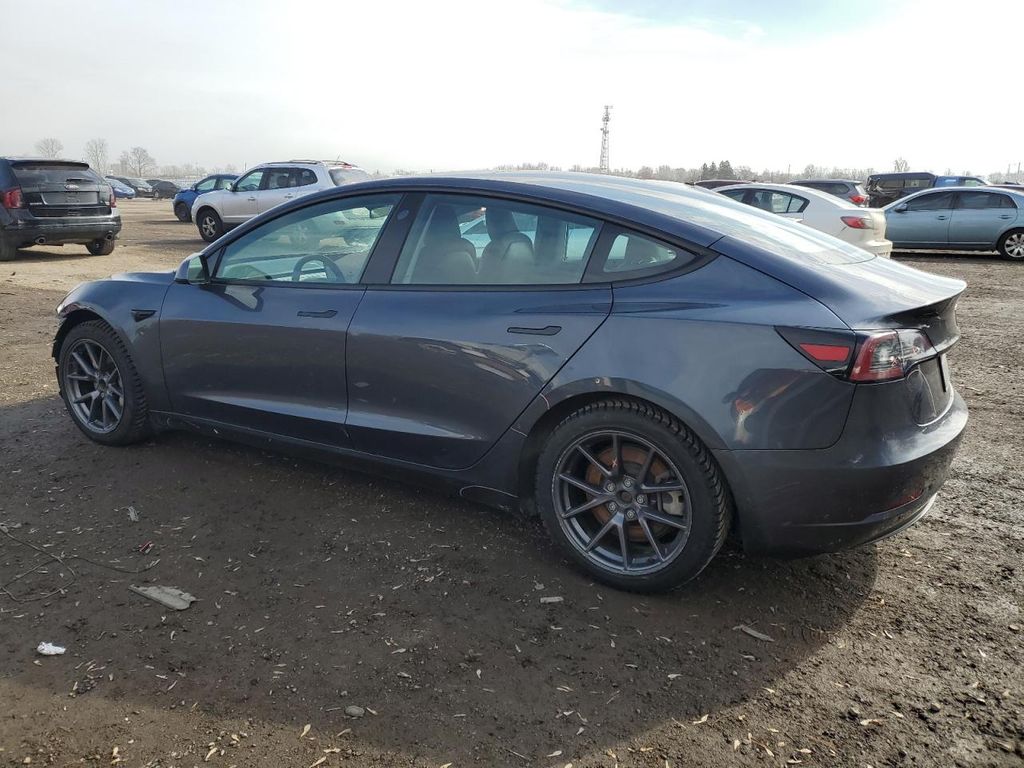
2021 TESLA MODEL 3
in 2 days, 160,186 mi
est retail value $31,422
buy now price $12,700
VIN 5YJ3E1EA2MF973930


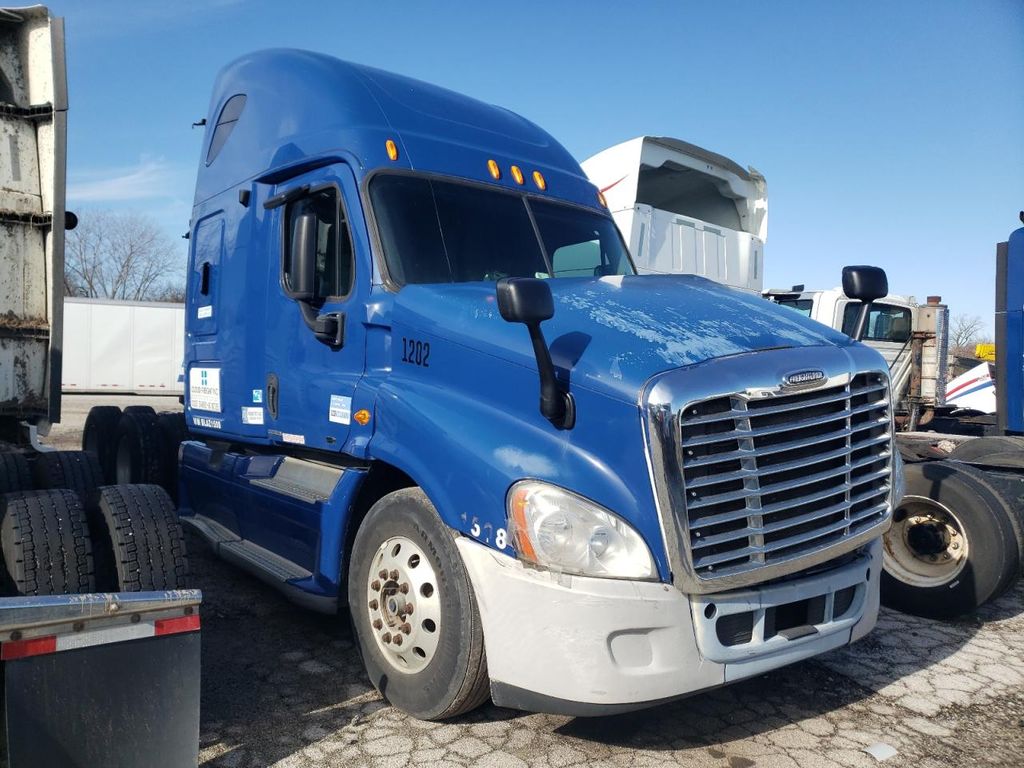
2011 FREIGHTLINER ALL OTHER
in 2 days, 668,674 mi
est retail value $26,875
buy now price $3,950
VIN 1FUJGLDR6BLAZ1508


Frequently asked questions
Test vehicle status, if reported, reveals use in trials or development, which may involve experimental features and adjustments in the 2012 TOYOTA TUNDRA.
The total price on a Monroney label includes the base price of the vehicle, plus the cost of any optional features, packages, and mandatory fees such as destination charges.
Factory warranty information, if available, covers drive train and safety systems as reported by 2012 TOYOTA, detailing the protection available for key vehicle components.
Our reports might specify the point of impact and damage location on the 2012 TOYOTA vehicle, offering a clearer understanding of the accident, if such details are available.
A window sticker provides detailed information about a vehicle's fuel economy, including city, highway, and combined mpg figures, helping buyers understand expected fuel costs.
Yes, the choice of vehicle color can impact the depreciation rate, with neutral colors typically being easier to sell and potentially holding their value better than more unconventional colors.


