
BADVIN vehicle history report for
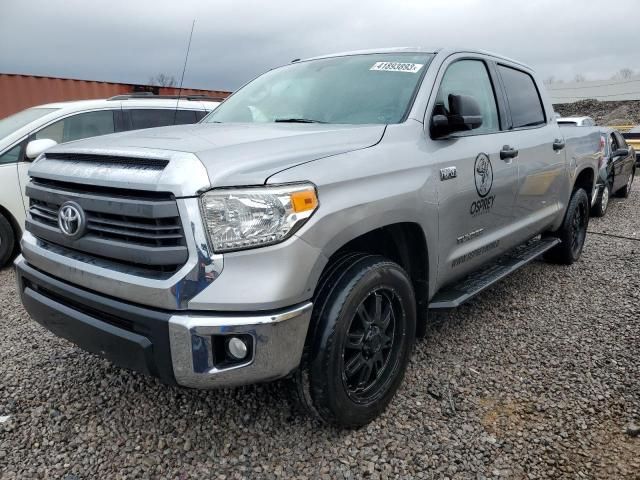
2019 TOYOTA TUNDRAVIN: 5TFDW5F13KX832309
Get FULL ACCESS to the vehicle history report and see all blurred info.
⭐ Read 206+ reviews from our customers who used BADVIN to avoid buying junk vehicles.
Historical Records
events
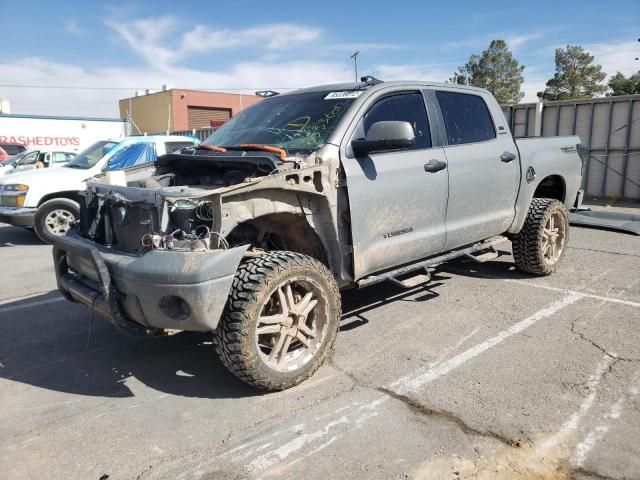
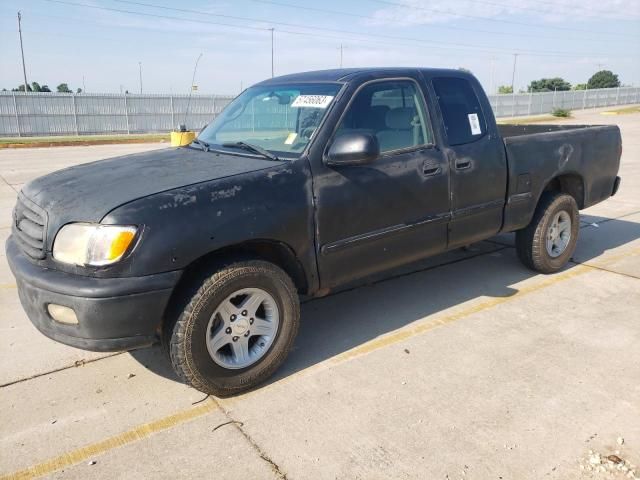
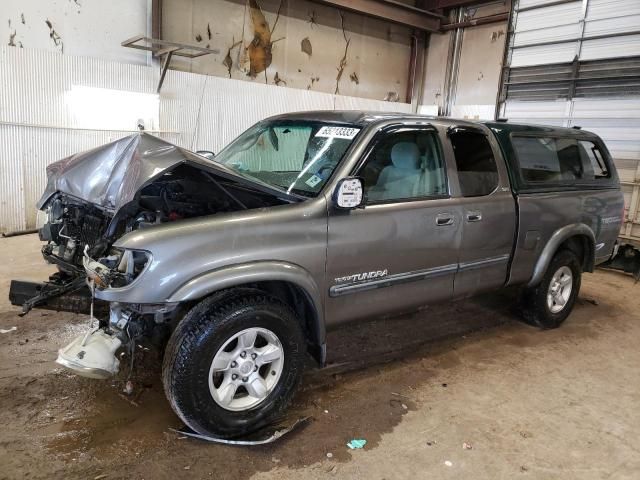
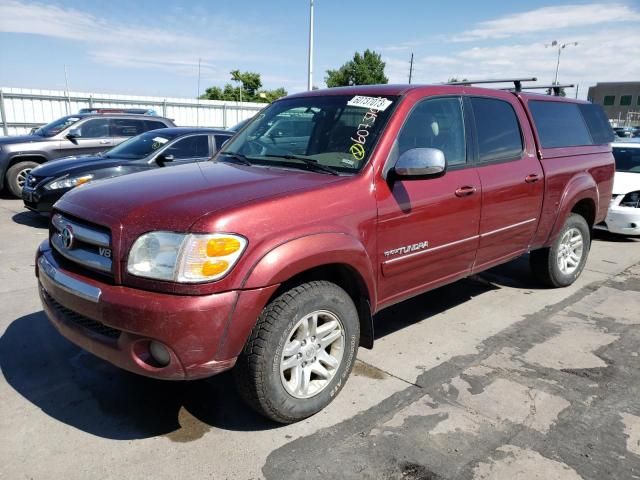
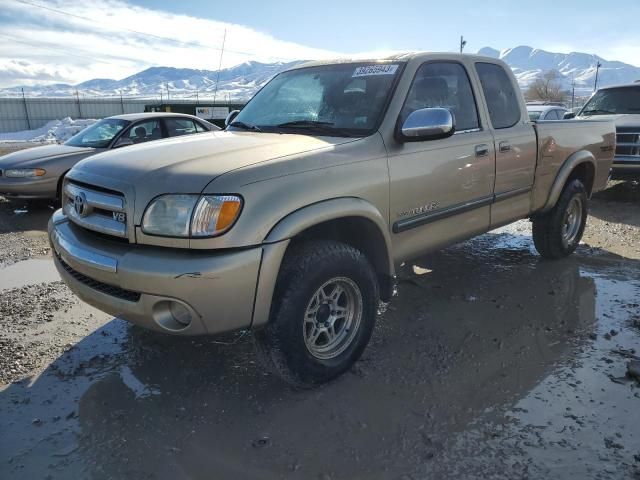
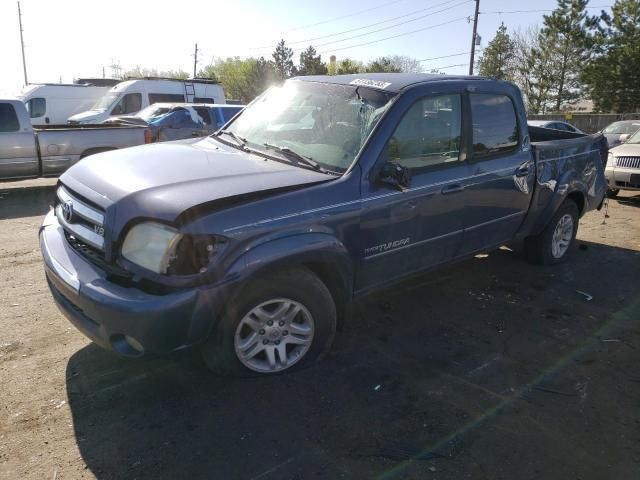
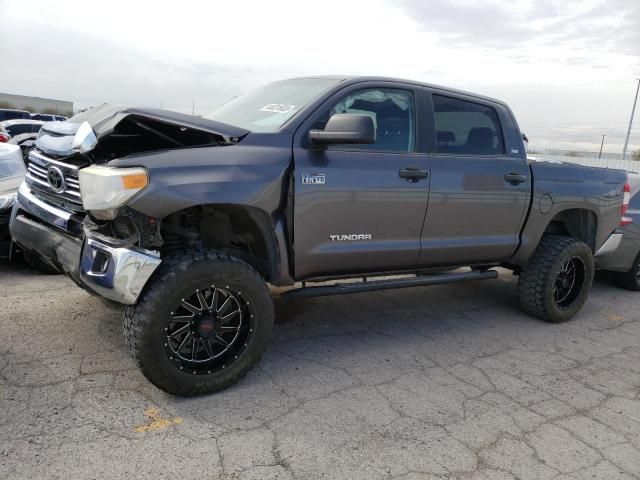
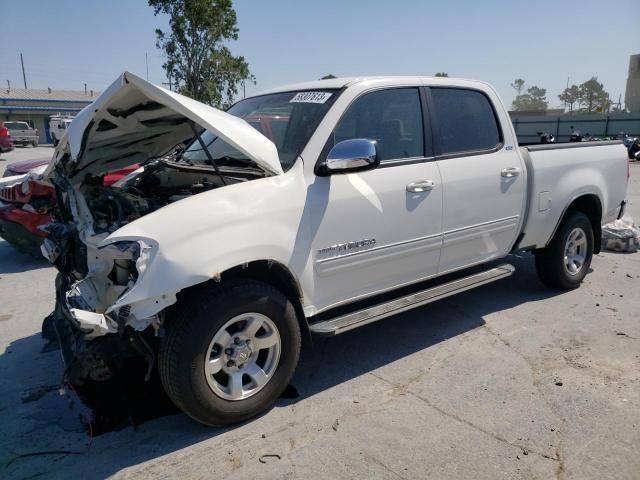
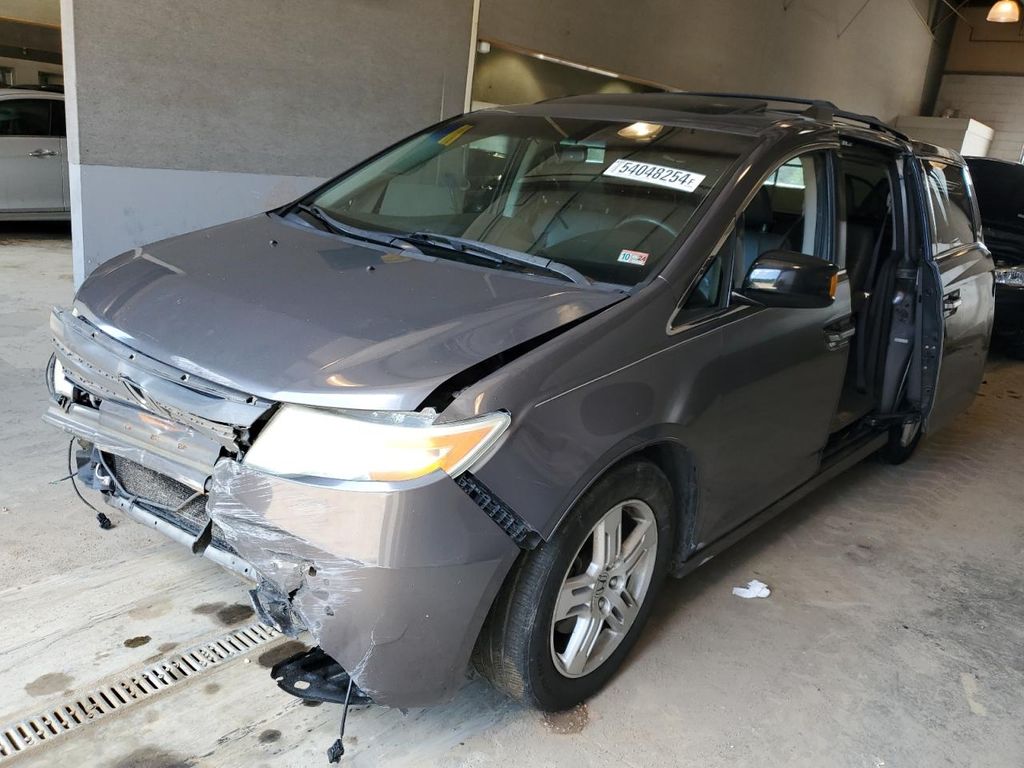
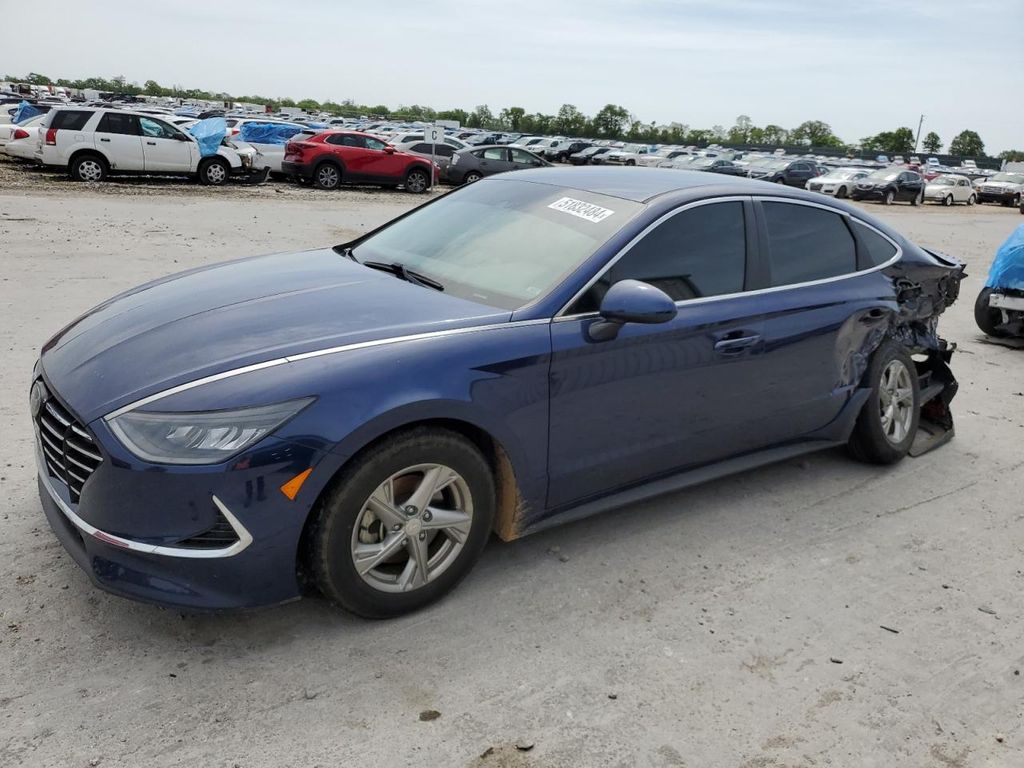
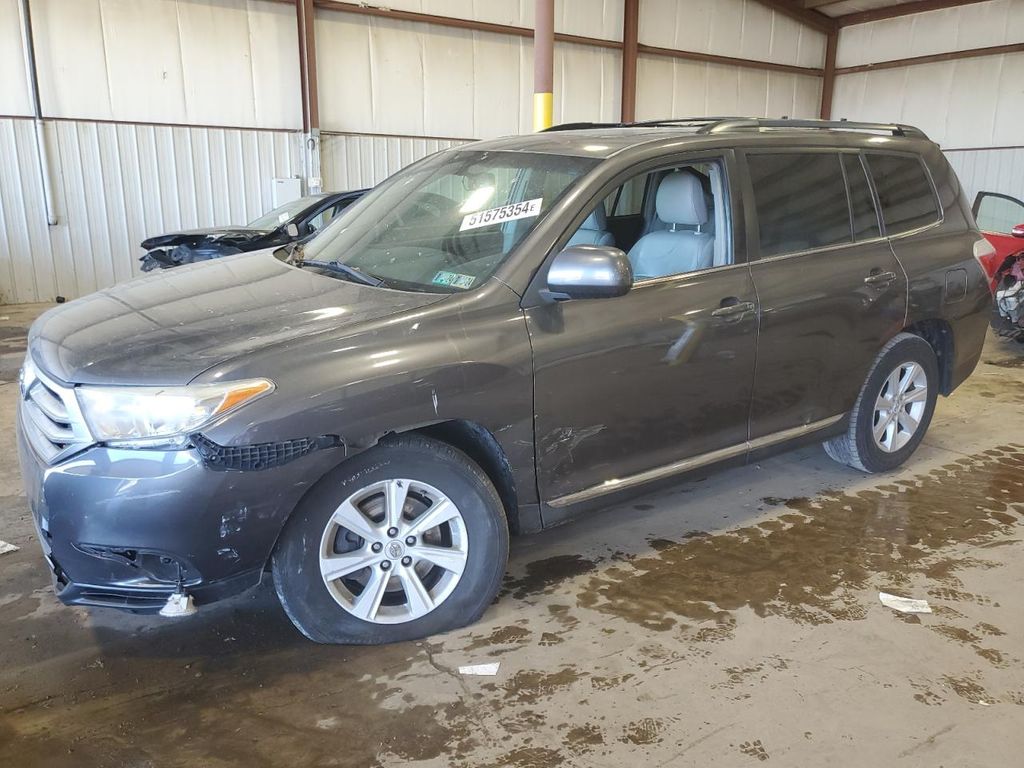
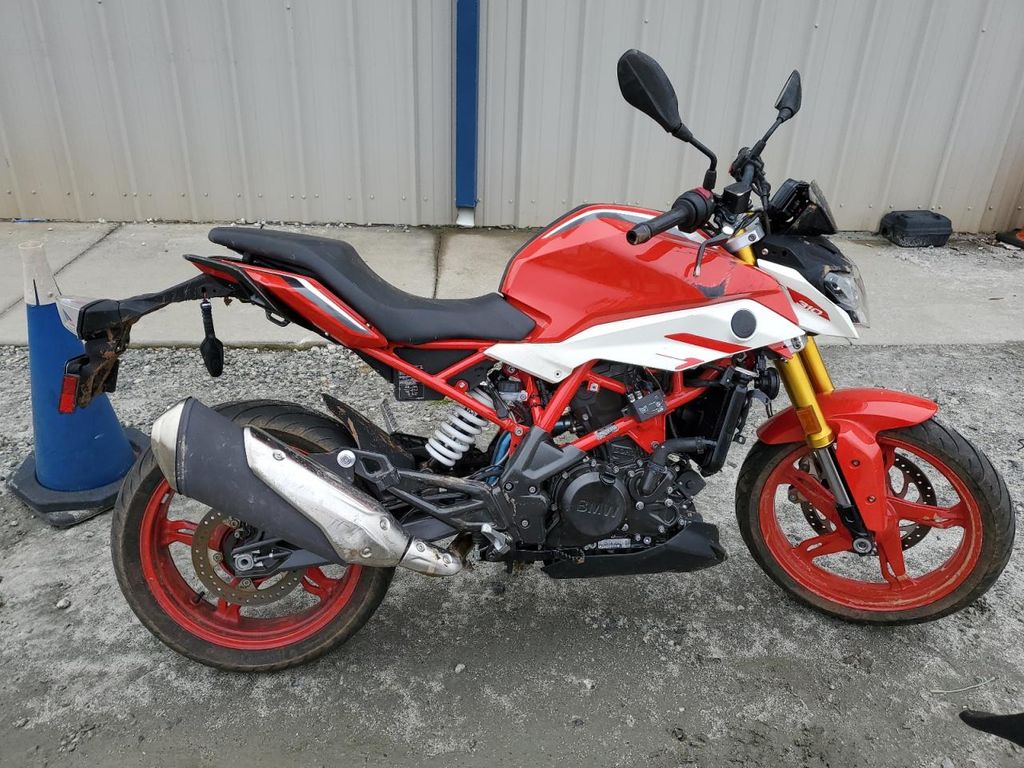
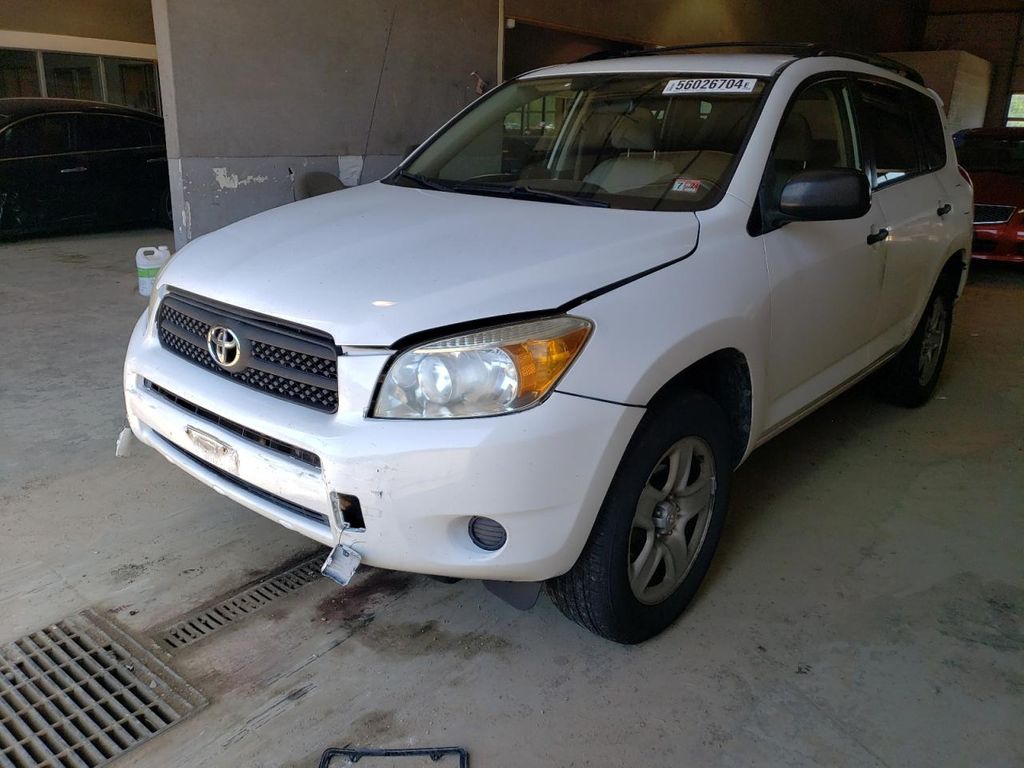
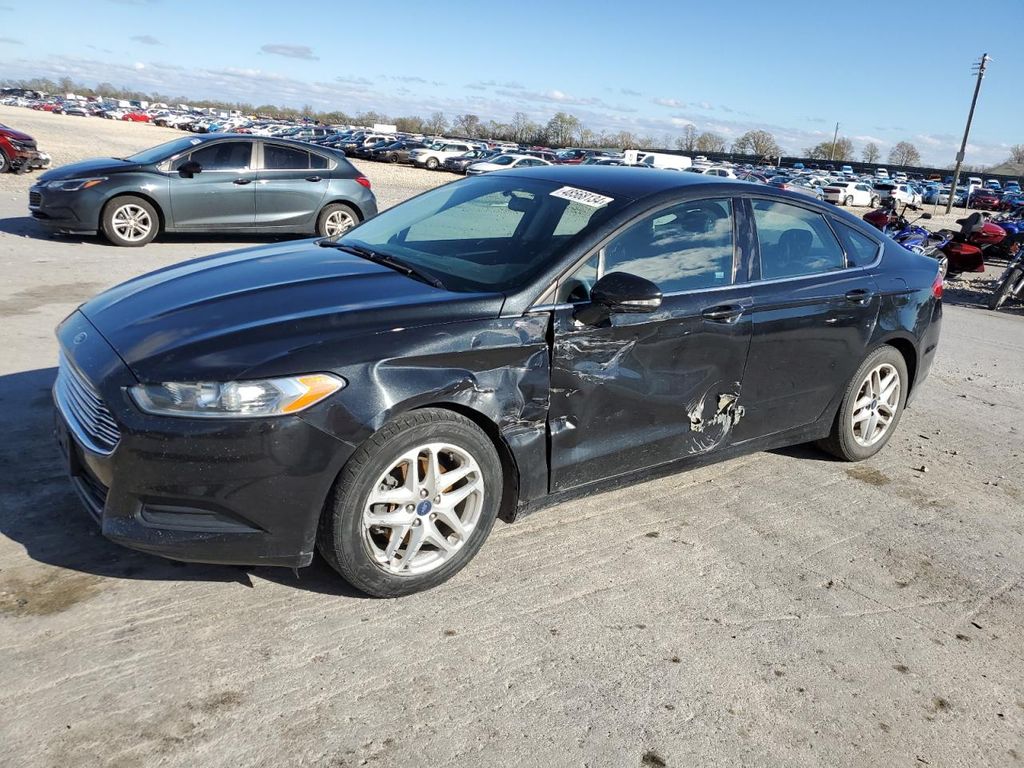
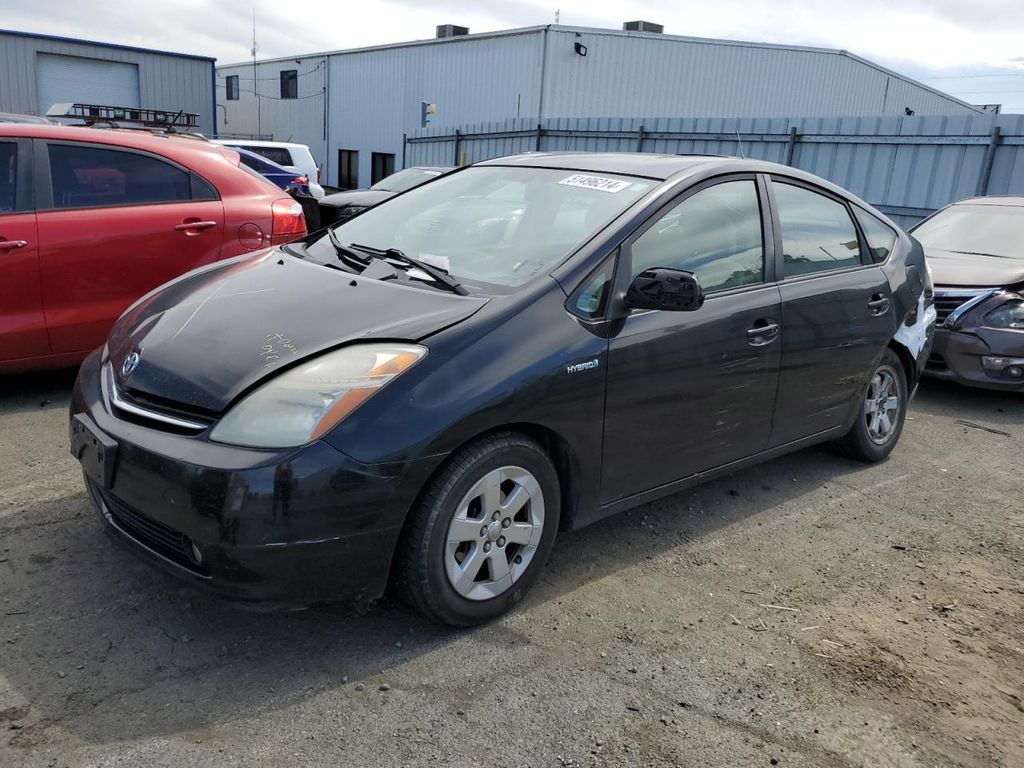
Photos
9 images
Sales History
1 records
Market report
Price analytics
Historical Records
Historical records may include service and maintenance records, title status (clean, junk, salvage), insurance records, number of owners, registration events and states, and other information.
You can find more information about historical records in BADVIN reports and see more examples here.
Available historical records for VIN 5TFDW5F13KX832309
Latest reported mileage: 871 mi
Below you can see some examples of what these records could look like.
2022-09-10
2 years ago
47,395 mi
Vehicle serviced
Outer tie rod(s) replaced
Alignment performed
Outer tie rod(s) replaced
Alignment performed
2021-11-06
3 years ago
21,894 mi
TOTAL LOSS VEHICLE
Collision damage reported
Collision damage reported
2021-08-16
3 years ago
36,692 mi
Damage reported
Damage to front
Damage to front
Sale Record
Sale Date
2 years ago
Location
North Charleston, SC, 29418
2019 TOYOTA TUNDRA CREWMAX SR5
sold
| Year | 2019 |
| ODO | — |
| Location | North Charleston, SC, 29418 |
| Date | ended 2 years ago |
| Sale Website Type | salvage or insurance auction |
sale information provided by user #733616


All photos above are REAL and display ACTUAL car. After you get the report you will see full resolution photos.
Tech Specs
Model Analytics & Market Report
We've analyzed more than 109,700 sales records of this model and here are some numbers.
The average price for new (MSRP) 2019 TOYOTA TUNDRA in 2019 was $50,857.
The average price for used 2019 TOYOTA TUNDRA nowadays in 2024 is $38,500 which is 76% from the original price.
Estimated mileage driven per year is 11,272 miles.
For this model we also have depreciation curve, photos, list of features and options, and other analytics.
Take a look at 2019 TOYOTA TUNDRA model page in BADVIN vehicles catalog.
Depreciation
The graph below is a depreciation curve for 2019 TOYOTA TUNDRA. It shows how much this model looses per year in price. This analytics is calculated using sales records from BADVIN database.
The table below shows average price for used 2019 TOYOTA TUNDRA in each year since the year of manufacturing, current year price and projected price in the future years.
You can scroll the table horizontally to see all columns.
| Year | Average Mileage | Average Price | % Left | % Lost | ||
|---|---|---|---|---|---|---|
| 2019 MSRP | 0 mi | $50,857 | — | — | 100% | 0% |
| 2019 | 11,272 mi | $59,999 | −$9,142 | −17.98% | 117.98% | -17.98% |
| 2020 | 22,544 mi | $56,989 | +$3,010 | +5.02% | 112.06% | -12.06% |
| 2021 | 33,816 mi | $48,974 | +$8,015 | +14.06% | 96.3% | 3.7% |
| 2022 | 45,088 mi | $42,729 | +$6,245 | +12.75% | 84.02% | 15.98% |
| 2023 | 56,360 mi | $40,764 | +$1,965 | +4.6% | 80.15% | 19.85% |
| → Visit 2019 TOYOTA TUNDRA depreciation page to see full data. | ||||||
Price vs Mileage
The graph below shows how mileage affects the price for 2019 TOYOTA TUNDRA. This data was calculated using sales records from BADVIN database.
The table below shows average price for used 2019 TOYOTA TUNDRA by mileage and number of sales.
You can scroll the table horizontally to see all columns.
| Mileage | Average Price | Sample Size |
|---|---|---|
| 5,000 mi | $49,977 | 16 sales |
| 10,000 mi | $45,000 | 39 sales |
| 15,000 mi | $44,599 | 105 sales |
| 20,000 mi | $42,755 | 156 sales |
| 25,000 mi | $43,925 | 234 sales |
| 30,000 mi | $42,011 | 316 sales |
| → Visit 2019 TOYOTA TUNDRA depreciation page to see full data. | ||
Get FULL ACCESS to the vehicle history report and see all blurred info.
⭐ Read 206+ reviews from our customers who used BADVIN to avoid buying junk vehicles.
Testimonials from our customers
Purchased a badvin report before buying a used Lexus RX 350. It revealed a minor accident the seller hadn't mentioned. I still bought the car but used the info to negotiate a lower price. Well worth the cost for the leverage it gave me!

Aiden Patel
verified on Trustpilot
I almost bought a 2019 Malibu that seemed like a great deal - low miles and price. But the badvin report showed it used to be a rental fleet vehicle, which the seller didn't disclose. Glad I found out before buying someone else's abused rental!
Benjamin Torres
verified on Trustpilot
I've tried many vehicle reports but badvin's is by far the most comprehensive. It shows accident photos, past sales, repairs and so much more. I won't buy a car now without getting a report first. It's a must-have.
Alexander Hunt
verified on Trustpilot
I buy rebuilt title cars at copart to fix and resell. was hoping BadVin reports wud have more detail on damage history to help me value cars before bidding, Carfax is better for that. but for clean title vehicles it seems pretty useful
Fatima
verified on Trustpilot
Compare to other 2019 TOYOTA TUNDRA
2004 TOYOTA TUNDRA
16 days ago, 127,894 mi
est retail value $15,973
buy now price $1,225
VIN 5TBDT44104S439603
2016 TOYOTA TUNDRA CREWMAX
a month ago, 96,247 mi
est retail value $30,999
buy now price $10,900
VIN 5TFDY5F13GX532111
Other vehicles sales records


Frequently asked questions
Gray market status, if noted, indicates the 2019 TOYOTA was imported outside official channels, potentially affecting its compliance with local regulations and parts availability.
Most VIN decoders do not provide color information as this is not typically encoded in the VIN; color information is usually obtained from vehicle registration documents or manufacturer records.
A VIN decoder reveals the vehicle's trim level by decoding specific characters of the VIN that relate to the vehicle's series and equipment levels.
If available, auction photos may be included in our reports, providing a glimpse into the 2019 TOYOTA vehicle’s condition and appearance at the time of sale.
Our vehicle history reports may specify if the 2019 TOYOTA has been used as a rental vehicle, which might affect its condition and value, if such information is recorded.
A VIN plays a crucial role in vehicle recalls for 2019 TOYOTA by helping identify specific vehicles affected by manufacturing issues, ensuring that recall notices are sent to the correct owners.


