BADVIN vehicle history report for
2018 TOYOTA TUNDRAVIN: 5TFDW5F10JX682934
Get FULL ACCESS to the vehicle history report and see all blurred info.
⭐ Read 205+ reviews from our customers who used BADVIN to avoid buying junk vehicles.
Historical Records
events
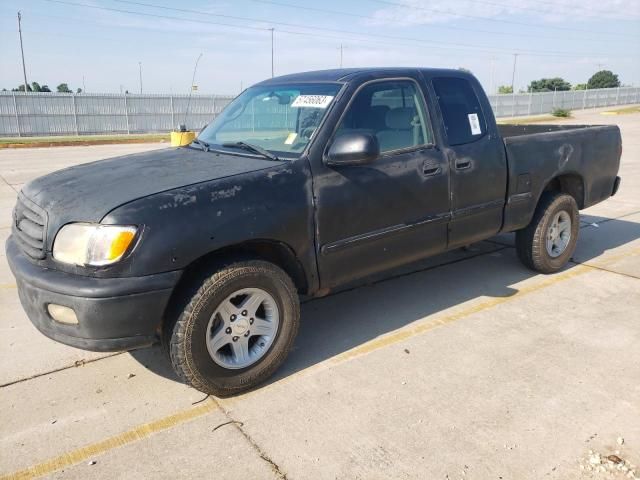
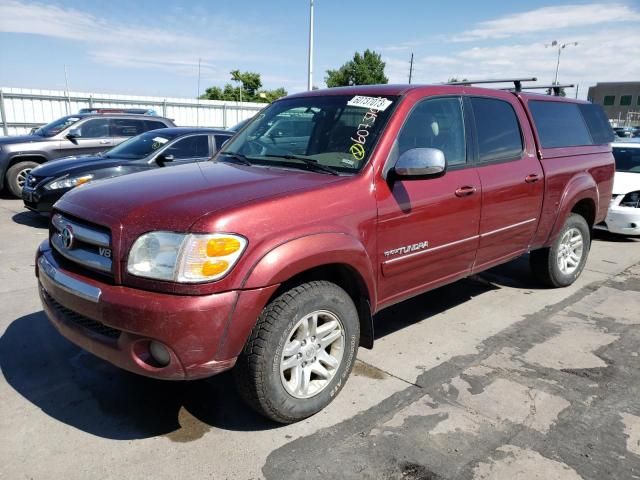
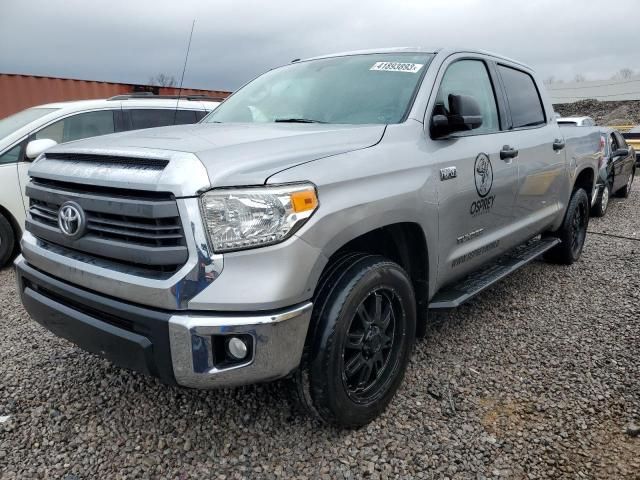
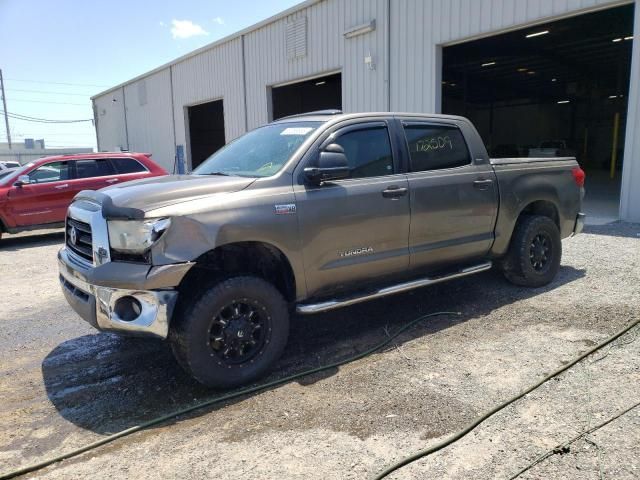
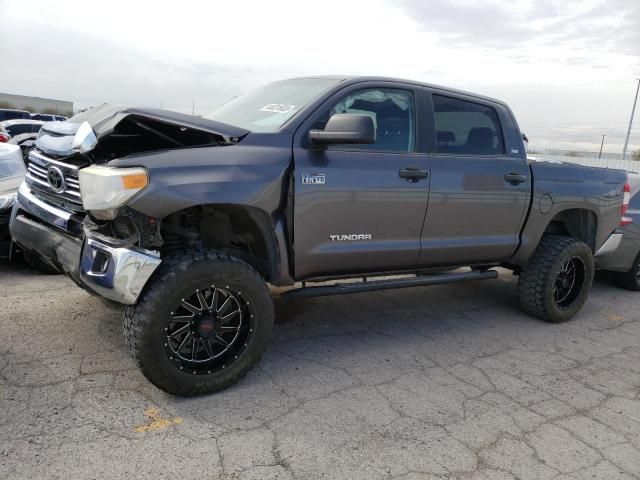
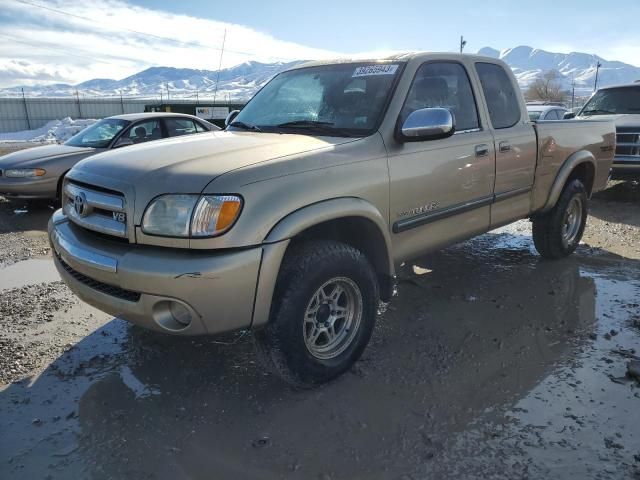
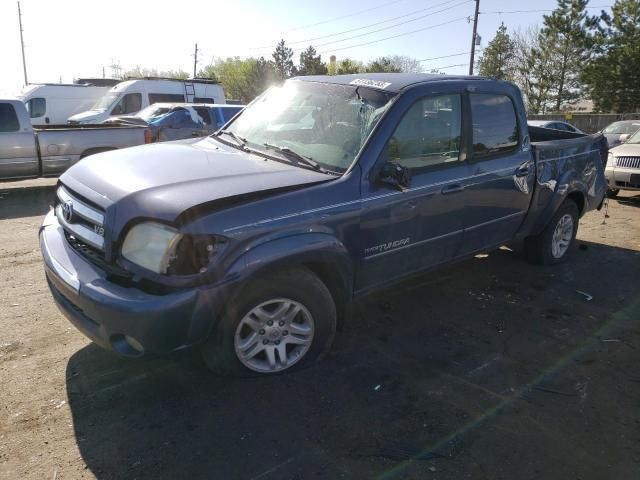
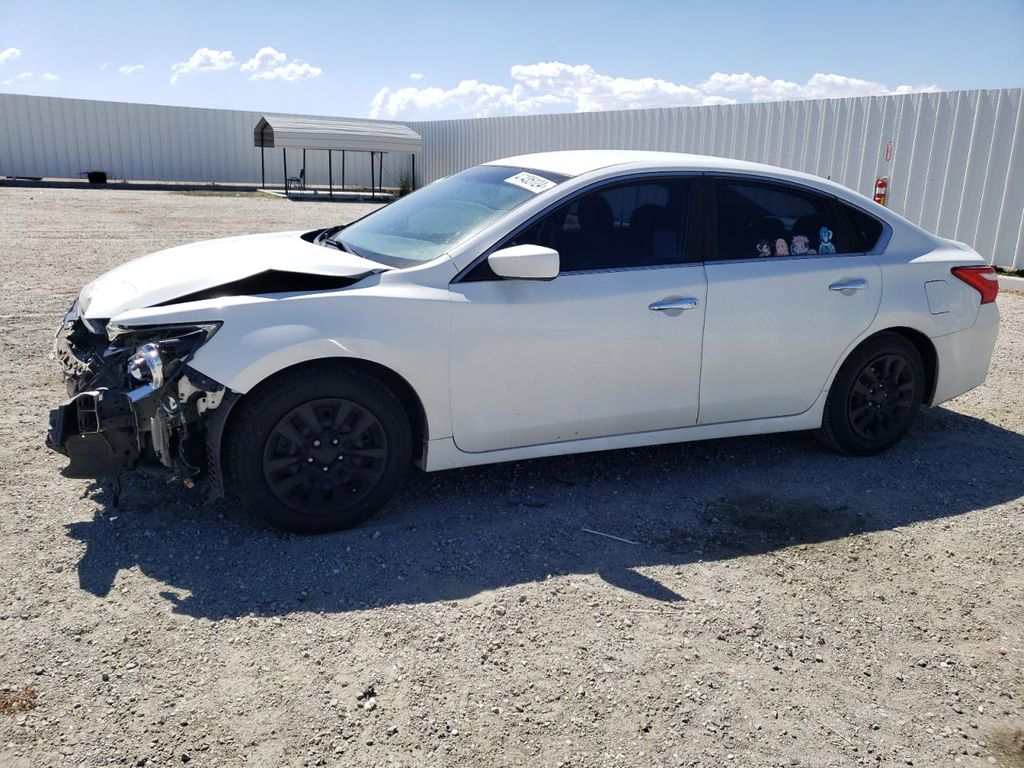
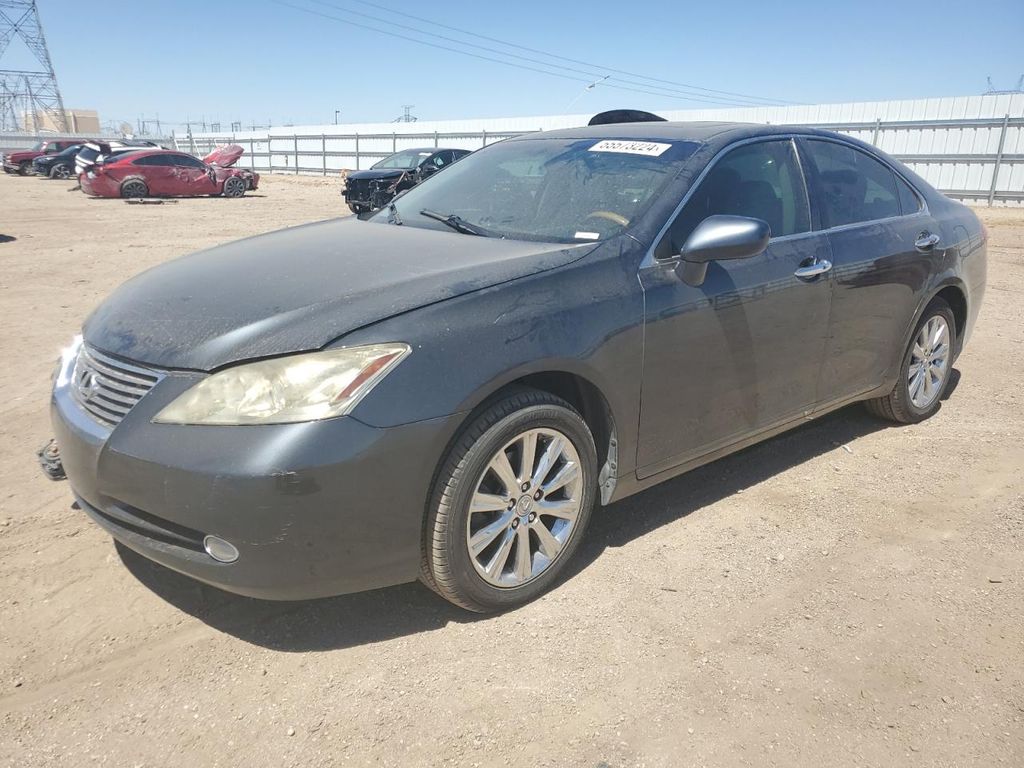
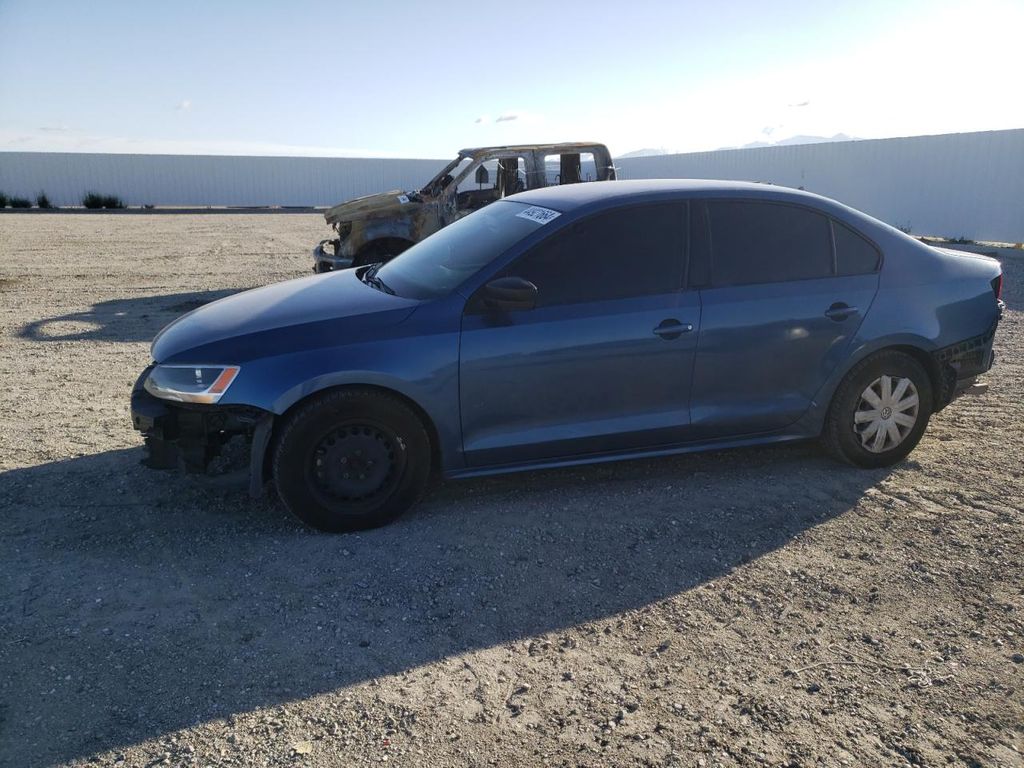
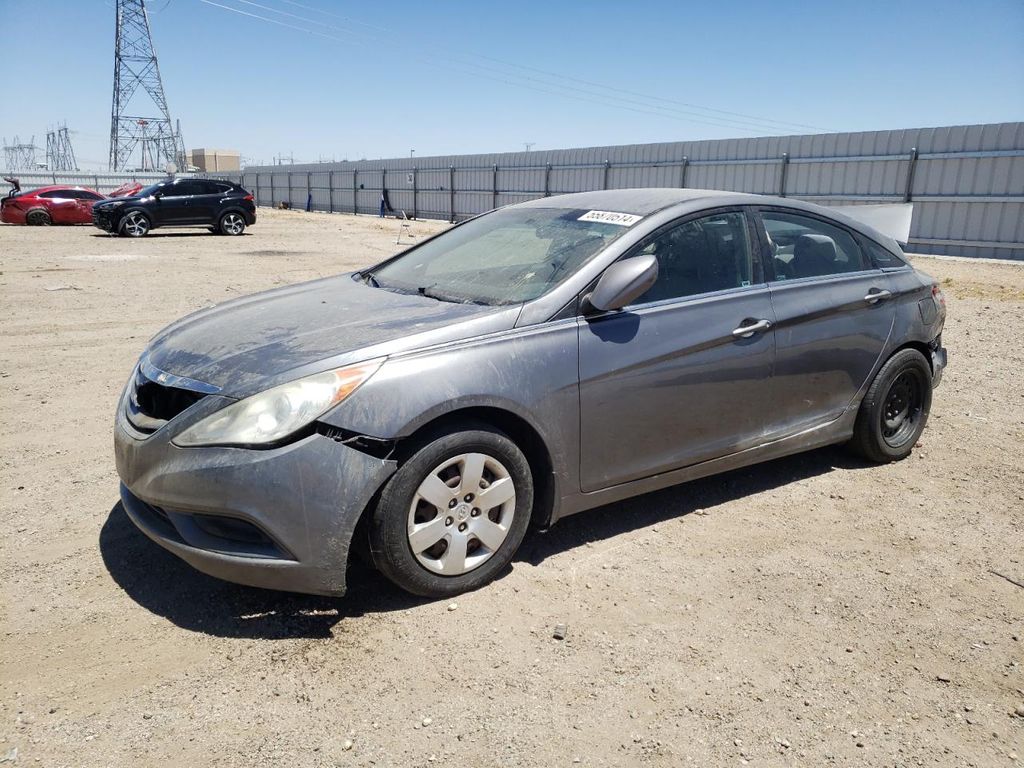
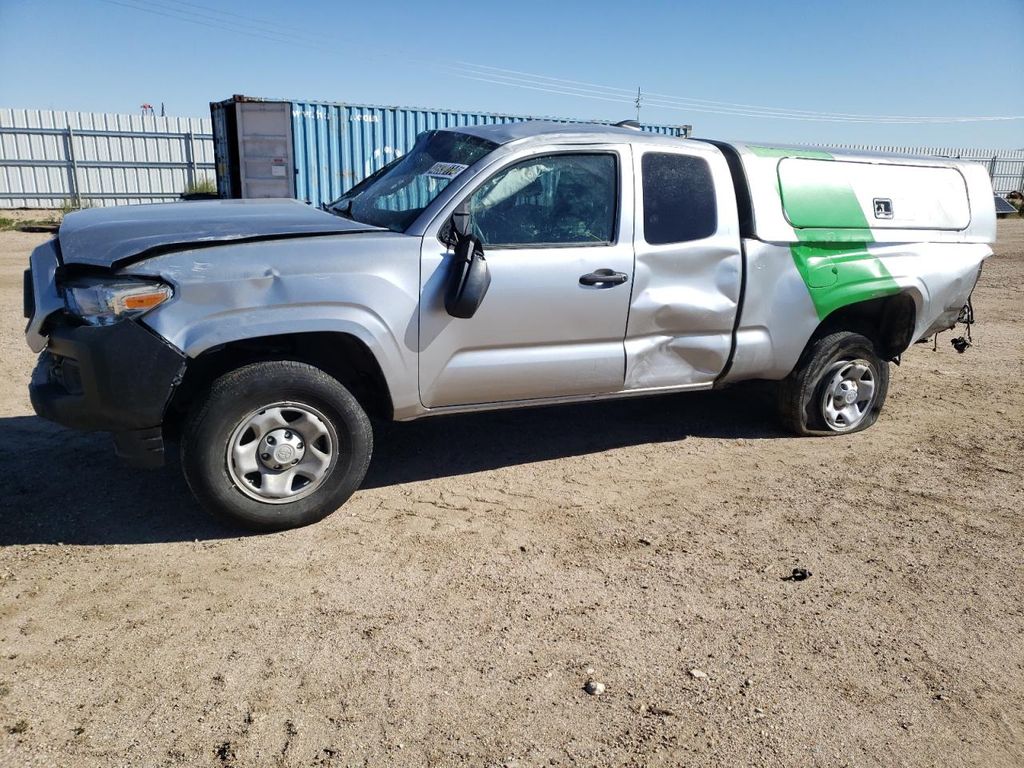
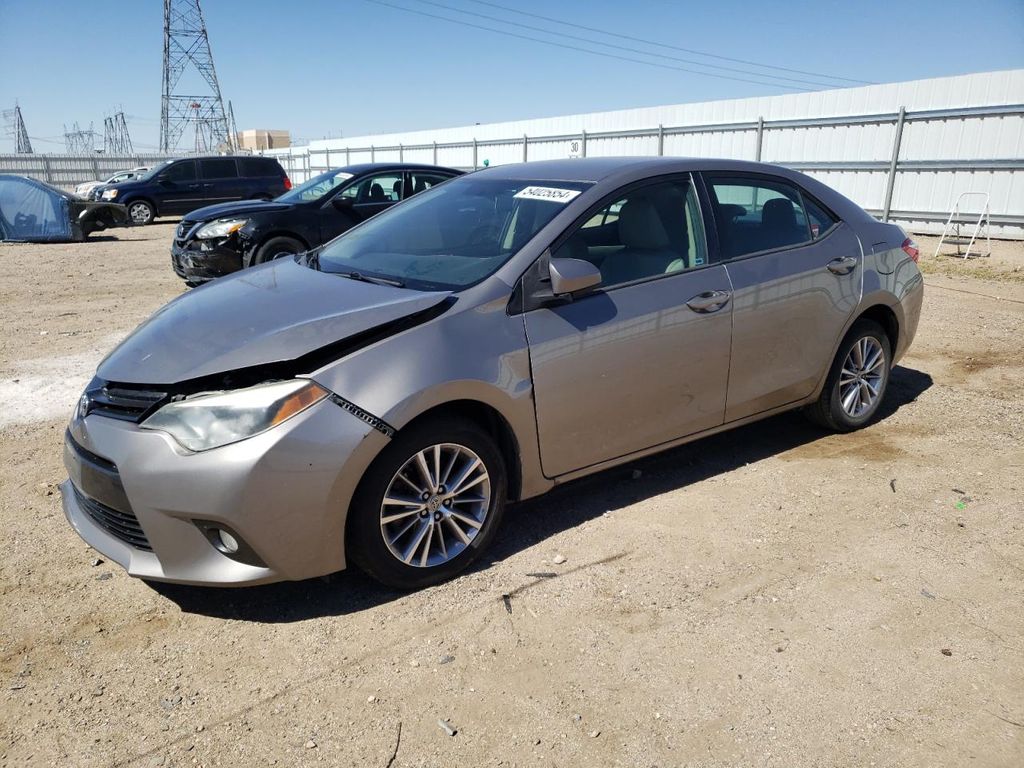
Photos
10 images
Sales History
1 records
Sale Prices
1 records
Market report
Price analytics
Historical Records
Historical records may include service and maintenance records, title status (clean, junk, salvage), insurance records, number of owners, registration events and states, and other information.
You can find more information about historical records in BADVIN reports and see more examples here.
Available historical records for VIN 5TFDW5F10JX682934
Latest reported mileage: 630 mi
Below you can see some examples of what these records could look like.
2023-10-28
7 months ago
152,888 mi
Vehicle serviced
Tire repaired
Tire repaired
2021-11-02
3 years ago
17,230 mi
New owner reported
REBUILT TITLE ISSUED
REBUILT TITLE ISSUED
2021-01-31
3 years ago
41,454 mi
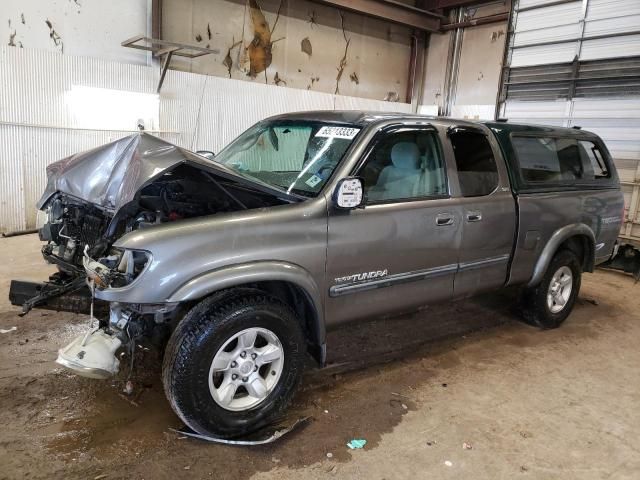
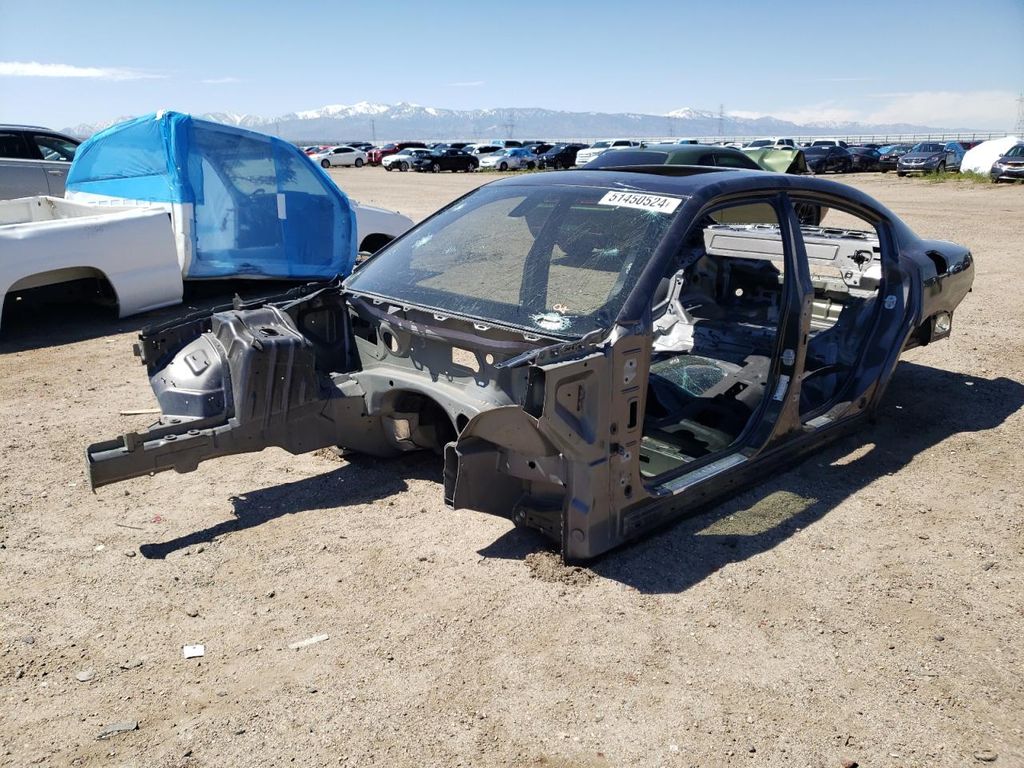
Damage reported
Damage to front
Damage to front
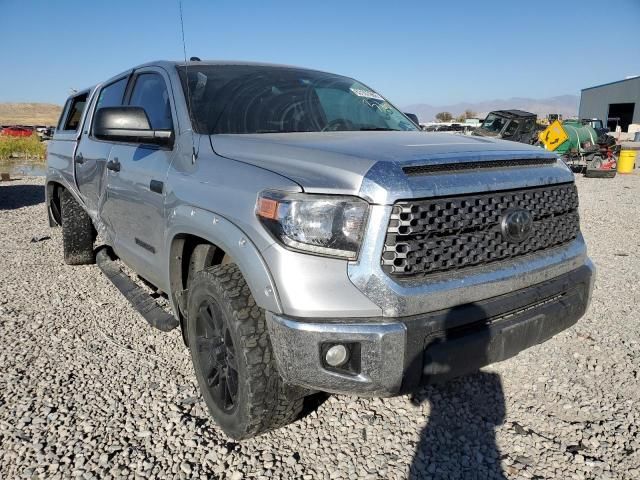
2018 TOYOTA TUNDRA CREWMAX SR5
sold
| Year | 2018 |
| Title | Hidden text (Hidden text) |
| ODO | 8817 mi (Hidden text) |
| Damage | Hidden text |
| Estimated Retail Value | $3009 |
| Estimated Repair Cost | $1857 (164%) |
| Location | Salt Lake City, UT, 84101 |
| Date | ended a year ago |
| Sale Website Type | salvage or insurance auction |
sale information provided by user #213994
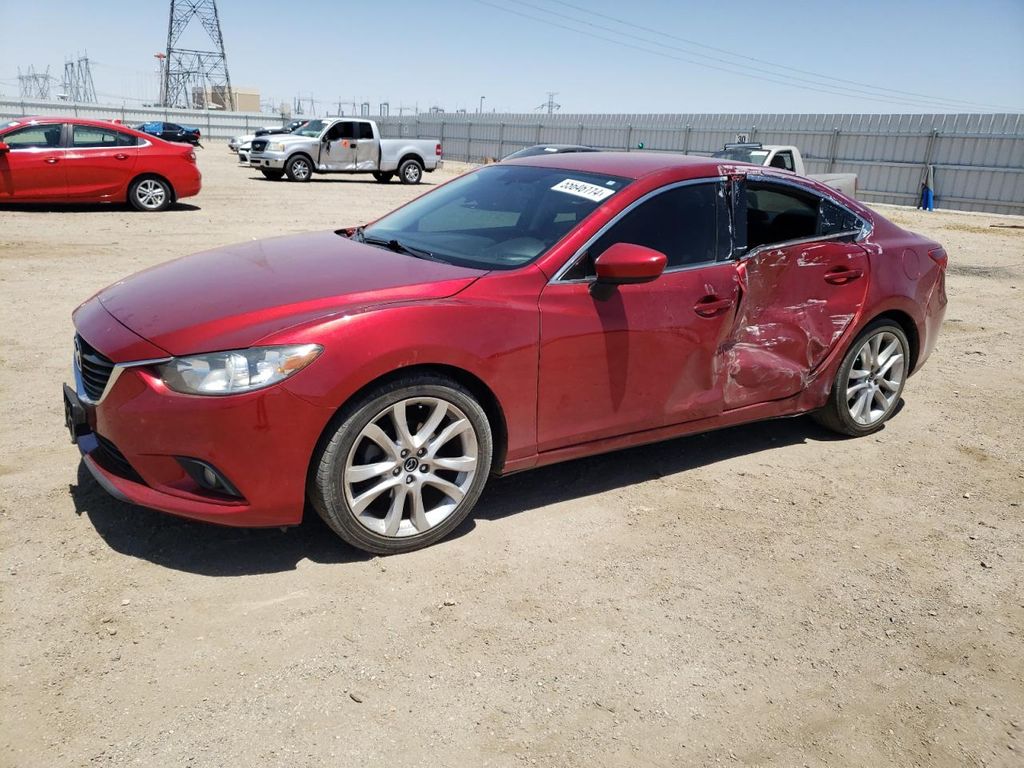
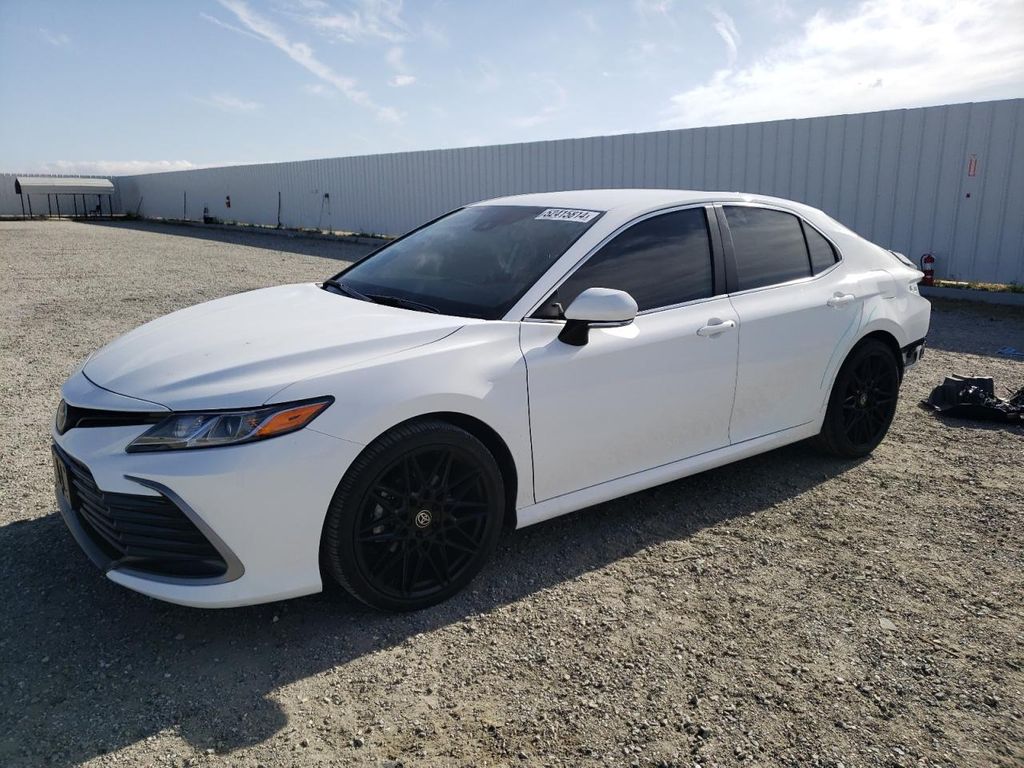
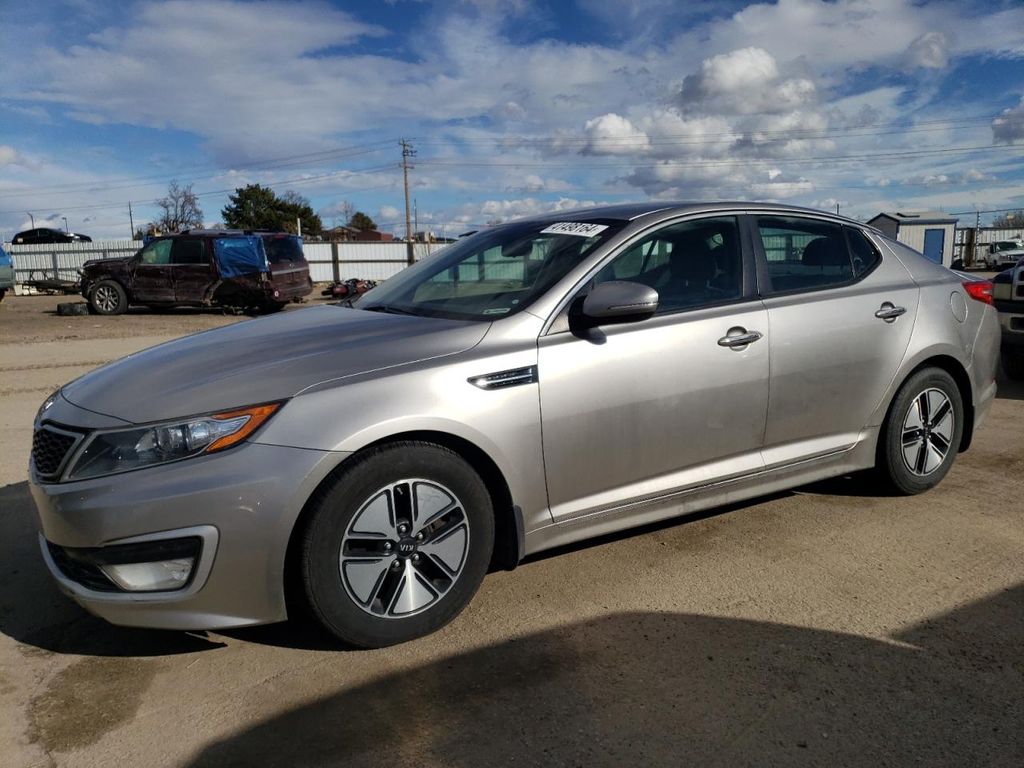
All photos above are REAL and display ACTUAL car. After you get the report you will see full resolution photos.
Tech Specs
| Color | GRAY |
| Transmission | AUTOMATIC |
| Engine | 5.7L 8 |
| Drive | 4x4 w/Rear Wheel Drv |
| Fuel Type | FLEXIBLE FUEL |
Model Analytics & Market Report
We've analyzed more than 102,800 sales records of this model and here are some numbers.
The average price for new (MSRP) 2018 TOYOTA TUNDRA in 2018 was $50,857.
The average price for used 2018 TOYOTA TUNDRA nowadays in 2024 is $35,499 which is 70% from the original price.
Estimated mileage driven per year is 11,272 miles.
For this model we also have depreciation curve, photos, list of features and options, and other analytics.
Take a look at 2018 TOYOTA TUNDRA model page in BADVIN vehicles catalog.
Depreciation
The graph below is a depreciation curve for 2018 TOYOTA TUNDRA. It shows how much this model looses per year in price. This analytics is calculated using sales records from BADVIN database.
The table below shows average price for used 2018 TOYOTA TUNDRA in each year since the year of manufacturing, current year price and projected price in the future years.
You can scroll the table horizontally to see all columns.
| Year | Average Mileage | Average Price | % Left | % Lost | ||
|---|---|---|---|---|---|---|
| 2018 MSRP | 0 mi | $50,857 | — | — | 100% | 0% |
| 2018 | 11,272 mi | $59,999 | −$9,142 | −17.98% | 117.98% | -17.98% |
| 2019 | 22,544 mi | $56,989 | +$3,010 | +5.02% | 112.06% | -12.06% |
| 2020 | 33,816 mi | $48,974 | +$8,015 | +14.06% | 96.3% | 3.7% |
| 2021 | 45,088 mi | $42,729 | +$6,245 | +12.75% | 84.02% | 15.98% |
| 2022 | 56,360 mi | $40,764 | +$1,965 | +4.6% | 80.15% | 19.85% |
| → Visit 2018 TOYOTA TUNDRA depreciation page to see full data. | ||||||
Price vs Mileage
The graph below shows how mileage affects the price for 2018 TOYOTA TUNDRA. This data was calculated using sales records from BADVIN database.
The table below shows average price for used 2018 TOYOTA TUNDRA by mileage and number of sales.
You can scroll the table horizontally to see all columns.
| Mileage | Average Price | Sample Size |
|---|---|---|
| 5,000 mi | $45,000 | 15 sales |
| 10,000 mi | $45,490 | 19 sales |
| 15,000 mi | $39,938 | 48 sales |
| 20,000 mi | $41,988 | 63 sales |
| 25,000 mi | $42,731 | 124 sales |
| 30,000 mi | $39,958 | 184 sales |
| → Visit 2018 TOYOTA TUNDRA depreciation page to see full data. | ||
Get FULL ACCESS to the vehicle history report and see all blurred info.
⭐ Read 205+ reviews from our customers who used BADVIN to avoid buying junk vehicles.
Testimonials from our customers
I import used luxury cars from US auctions to resell in Russia. The vehicle history reports from badVIN are essential for avoiding problem cars. For a BMW I was bidding on, it uncovered a salvage title from flood damage that other reports missed! That alone pays for the service.

Dmitry Volkov
verified on Trustpilot
I always rely on badvin to check out any used car before I buy. It gives such a complete history, including past accidents, service records, recalls and much more. Feel so much more confident as a used car shopper having this info.
Sofia Garcia
verified on Trustpilot
I buy rebuilt title cars at copart to fix and resell. was hoping BadVin reports wud have more detail on damage history to help me value cars before bidding, Carfax is better for that. but for clean title vehicles it seems pretty useful
Fatima
verified on Trustpilot
As a used car dealer, I rely on badvin.org for checking every vehicle I'm considering purchasing at auction. The comprehensive reports give me peace of mind and help me avoid problem cars. Photos of past sales have saved me from overpaying many times. Worth every penny!
Misha
verified on Trustpilot
Compare to other 2018 TOYOTA TUNDRA
2016 TOYOTA TUNDRA CREWMAX
23 days ago, 96,247 mi
est retail value $30,999
buy now price $10,900
VIN 5TFDY5F13GX532111
2004 TOYOTA TUNDRA
11 days ago, 127,894 mi
est retail value $15,973
buy now price $1,225
VIN 5TBDT44104S439603
Other vehicles sales records


2022 TOYOTA TACOMA
in 2 days, 17,022 mi
est retail value $24,520
buy now price $18,000
VIN 3TYRX5GN2NT058377
Frequently asked questions
While a VIN decoder can provide the model year that can suggest warranty status, verifying the actual warranty status usually requires direct contact with the manufacturer or dealer.
These records, if available, show if the 2018 TOYOTA has been reported stolen or recovered, impacting its legal status and potential purchase risk.
The last known odometer reading, if recorded, is noted in our reports, providing a snapshot of the 2018 TOYOTA TUNDRA's usage up to that point.
Damage severity, if reported, is classified as minor, moderate, or severe, and may provide insights into the extent of damage the 2018 TOYOTA vehicle has sustained.
Our reports may include records of tire rotations, indicating how regularly they were performed and at what intervals for the 2018 TOYOTA, if data is available.
Safety recall reports, if available, detail the nature of the defect, risk severity, and recommended actions, ensuring the safety and reliability of the 2018 TOYOTA vehicle.
A window sticker provides detailed information about a vehicle's fuel economy, including city, highway, and combined mpg figures, helping buyers understand expected fuel costs.


