
BADVIN vehicle history report for
2010 TOYOTA TUNDRAVIN: 5TFDW5F10AX151121
Get FULL ACCESS to the vehicle history report and see all blurred info.
⭐ Read 206+ reviews from our customers who used BADVIN to avoid buying junk vehicles.
Historical Records
56 events
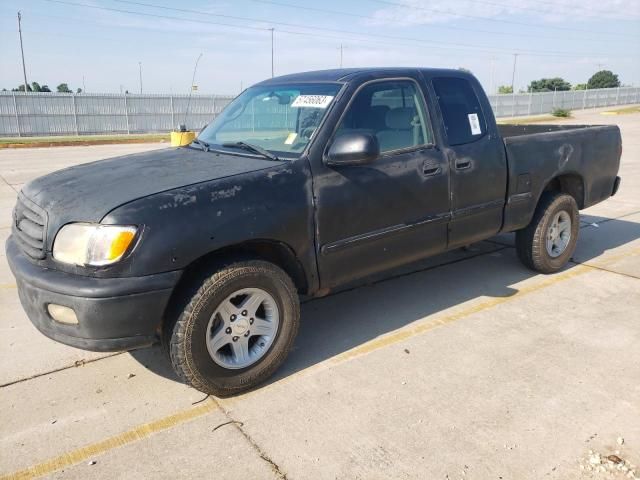
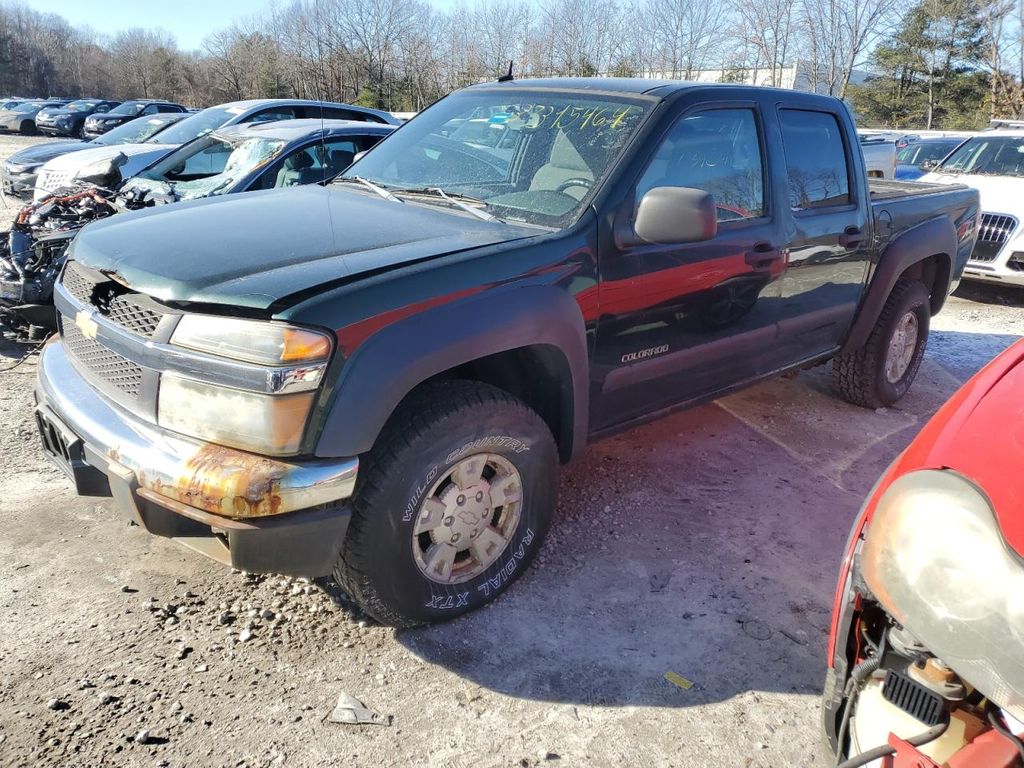
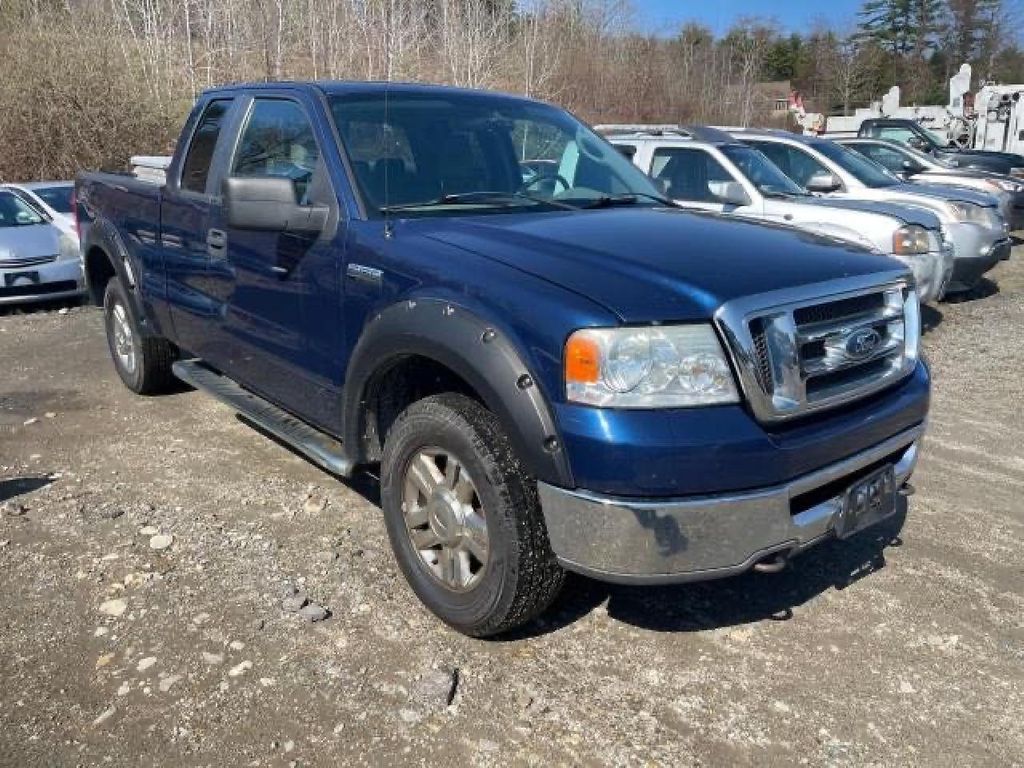
Photos
20 images
Sales History
2 records
Sale Prices
1 records
Market report
Price analytics
Historical Records
Historical records may include service and maintenance records, title status (clean, junk, salvage), insurance records, number of owners, registration events and states, and other information.
You can find more information about historical records in BADVIN reports and see more examples here.
Available 56 historical records for VIN 5TFDW5F10AX151121
Latest reported mileage: 655 mi
Below you can see some examples of what these records could look like.
2023-11-08
7 months ago
72,281 mi
Vehicle serviced
Tire repaired
Tire repaired
2021-10-21
3 years ago
5,548 mi
Fire damage reported: minor damage
Vandalism damage reported
Damage to front
Vandalism damage reported
Damage to front
2020-10-05
4 years ago
27,051 mi
Vehicle serviced
40,000 mile service performed
40,000 mile service performed
Sale Record
2010 TOYOTA TUNDRA CREWMAX SR5
sold
| Year | 2010 |
| Title | Hidden text (Hidden text) |
| ODO | 2241 mi (Hidden text) |
| Damage | Hidden text, Hidden text |
| Estimated Retail Value | $6325 |
| Estimated Repair Cost | $1215 (911%) |
| Location | Long Beach, CA, 90806 |
| Date | ended 2 years ago |
| Sale Website Type | salvage or insurance auction |
sale information provided by user #75847


All photos above are REAL and display ACTUAL car. After you get the report you will see full resolution photos.
Tech Specs
| Color | GRAY |
| Transmission | AUTOMATIC |
| Engine | 5.7L 8 |
| Drive | 4x4 w/Rear Wheel Drv |
| Fuel Type | FLEXIBLE FUEL |
| Year | 2010 |
| ODO | 9478 mi |
| Condition | Hidden text |
| Seller | Hidden text |
| Location | Sacramento, CA, 95821 |
| Date | appeared 3 years ago latest price $1356 |
| Sale Website Type | classifieds |
sale information provided by user #125868


All photos above are REAL and display ACTUAL car. After you get the report you will see full resolution photos.
Tech Specs
| Body Style | Pickup |
| Color | Gray |
| Color (Interior) | Gray |
| Transmission | Automatic |
| Engine | 5.7 L |
| Cylinders | 8 Cyl |
| Drive | 4WD |
| Fuel Type | Flexible-Fuel |
Extra Features
- Keyless Entry
- Hidden text
- Front Bench Seat
- Hidden text
- Independent Suspension
- Hidden text
- Front Stabilizer Bar
Standard Features
All these features are based on a model in general. This specific vehicle may differ.
- 12V Power Outlet
- 7137
- 3-Point Seat Belts
- 2506
- AM/FM
- Hidden text
- Adjustable Seats
- Hidden text
- Air Conditioning
- Hidden text
- Antenna
- Hidden text
- Auto Climate Control
- Hidden text
- Body Colored Bumpers
- Hidden text
- CD (Single Disc)
- Hidden text
- Child Safety Locks
- Hidden text
- Chrome Bumpers
- Hidden text
- Cloth Upholstery
- Hidden text
- Cruise Control
- Hidden text
- Door Pockets
- Hidden text
- Dual-Zone Climate Control
- Hidden text
- Floor Mats
- Hidden text
- Front Airbags (Passenger)
- Hidden text
- Front Knee Airbags (Driver)
- Hidden text
- Front Side Airbags (Driver)
- Hidden text
- Front Ventilated Disc Brakes
- Hidden text
- Leaf Rear Spring
- Hidden text
- Overhead Console
- Hidden text
- Power Mirrors
- Hidden text
- Power Windows
- Hidden text
- Rear Headrests
- Hidden text
- Rear Window Defroster
- Hidden text
- Side Curtain Airbags w/Rollover Sensor
- Hidden text
- Split/Folding Seats
- Hidden text
- Tachometer
- Hidden text
- Tire Pressure Monitoring System
- Hidden text
- Vanity Mirror/Light
- Hidden text
Model Analytics & Market Report
We've analyzed more than 28,400 sales records of this model and here are some numbers.
The average price for new (MSRP) 2010 TOYOTA TUNDRA in 2010 was $50,857.
The average price for used 2010 TOYOTA TUNDRA nowadays in 2024 is $16,635 which is 33% from the original price.
Estimated mileage driven per year is 11,272 miles.
For this model we also have depreciation curve, photos, list of features and options, and other analytics.
Take a look at 2010 TOYOTA TUNDRA model page in BADVIN vehicles catalog.
Depreciation
The graph below is a depreciation curve for 2010 TOYOTA TUNDRA. It shows how much this model looses per year in price. This analytics is calculated using sales records from BADVIN database.
The table below shows average price for used 2010 TOYOTA TUNDRA in each year since the year of manufacturing, current year price and projected price in the future years.
You can scroll the table horizontally to see all columns.
| Year | Average Mileage | Average Price | % Left | % Lost | ||
|---|---|---|---|---|---|---|
| 2010 MSRP | 0 mi | $50,857 | — | — | 100% | 0% |
| 2010 | 11,272 mi | $59,999 | −$9,142 | −17.98% | 117.98% | -17.98% |
| 2011 | 22,544 mi | $56,989 | +$3,010 | +5.02% | 112.06% | -12.06% |
| 2012 | 33,816 mi | $48,974 | +$8,015 | +14.06% | 96.3% | 3.7% |
| 2013 | 45,088 mi | $42,729 | +$6,245 | +12.75% | 84.02% | 15.98% |
| 2014 | 56,360 mi | $40,764 | +$1,965 | +4.6% | 80.15% | 19.85% |
| → Visit 2010 TOYOTA TUNDRA depreciation page to see full data. | ||||||
Price vs Mileage
The graph below shows how mileage affects the price for 2010 TOYOTA TUNDRA. This data was calculated using sales records from BADVIN database.
The table below shows average price for used 2010 TOYOTA TUNDRA by mileage and number of sales.
You can scroll the table horizontally to see all columns.
| Mileage | Average Price | Sample Size |
|---|---|---|
| 25,000 mi | $24,999 | 13 sales |
| 35,000 mi | $22,996 | 12 sales |
| 40,000 mi | $22,849 | 13 sales |
| 45,000 mi | $24,950 | 19 sales |
| 50,000 mi | $23,999 | 30 sales |
| 55,000 mi | $23,495 | 22 sales |
| → Visit 2010 TOYOTA TUNDRA depreciation page to see full data. | ||
Get FULL ACCESS to the vehicle history report and see all blurred info.
⭐ Read 206+ reviews from our customers who used BADVIN to avoid buying junk vehicles.
Testimonials from our customers
After a bad experience buying a used car that turned out to have major issues, I now use Bad VIN to thoroughly check every vehicle i consider. It costs a bit more than other services but the detailed records and photos of past sales are wotrh it for the added peace of mind.

Olivia Johnson
verified on Trustpilot
Ich hätte fast einen 2017 Mercedes-Benz C300 gekauft, bis der Bad Vin-Bericht zeigte, dass er als durch Überschwemmung beschädigt gemeldet wurde. Die detaillierten Schadensaufzeichnungen haben mich vor einem großen Fehler bewahrt!
Sophia Müller
verified on Trustpilot
I almost bought a used Honda but luckily checked the BadVin report first. Turned out it had a salvage title from flood damage that the seller didn't disclose. Phew, dodged a huge issue!
Emily Turner
verified on Trustpilot
I always rely on badvin to check out any used car before I buy. It gives such a complete history, including past accidents, service records, recalls and much more. Feel so much more confident as a used car shopper having this info.
Sofia Garcia
verified on Trustpilot
Compare to other 2010 TOYOTA TUNDRA

Other vehicles sales records


1956 CADILLAC ALL OTHER
in 4 days, 47,728 mi
est retail value $8,261
buy now price $5,550
VIN 5662142295


Frequently asked questions
VIN decoding does not directly reveal maintenance history; however, it can identify the vehicle model and year, which you can use to access maintenance records through service databases with the VIN.
A flood or lemon title, if reported, indicates significant past issues, which are detailed in our reports to inform potential buyers of the risks associated with such vehicles.
Understanding depreciation is important for car owners to manage financial expectations and make informed decisions about selling or trading in their vehicles at the right time.
Emission inspection status may show whether the 2010 TOYOTA vehicle has passed required state emissions testing, which is essential for registration in many areas, if such inspections have been documented.
The Monroney label helps you understand the added features on a 2010 TOYOTA TUNDRA by listing optional equipment and packages included in the vehicle, along with their pricing.
The parts content information on a window sticker shows the percentage of vehicle components sourced from specific countries, important for consumers interested in the origin of their vehicle's parts.
Yes, the choice of vehicle color can impact the depreciation rate, with neutral colors typically being easier to sell and potentially holding their value better than more unconventional colors.


