
BADVIN vehicle history report for
2017 TOYOTA TUNDRAVIN: 5TFBW5F19HX635175
Get FULL ACCESS to the vehicle history report and see all blurred info.
⭐ Read 206+ reviews from our customers who used BADVIN to avoid buying junk vehicles.
Historical Records
events
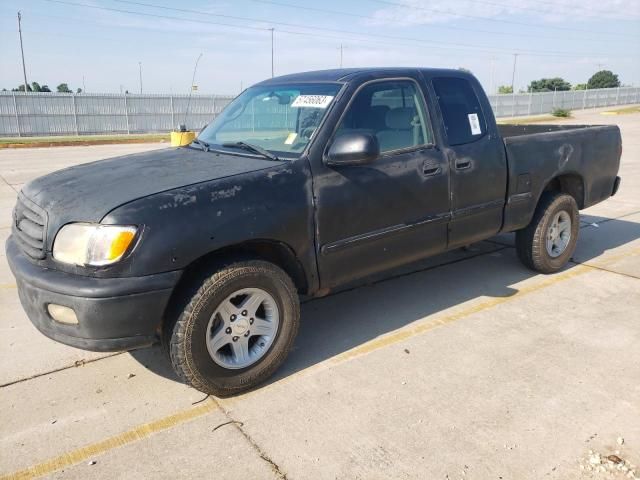
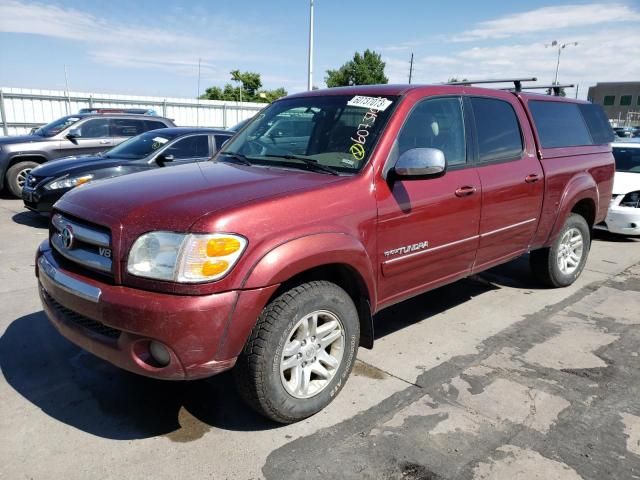
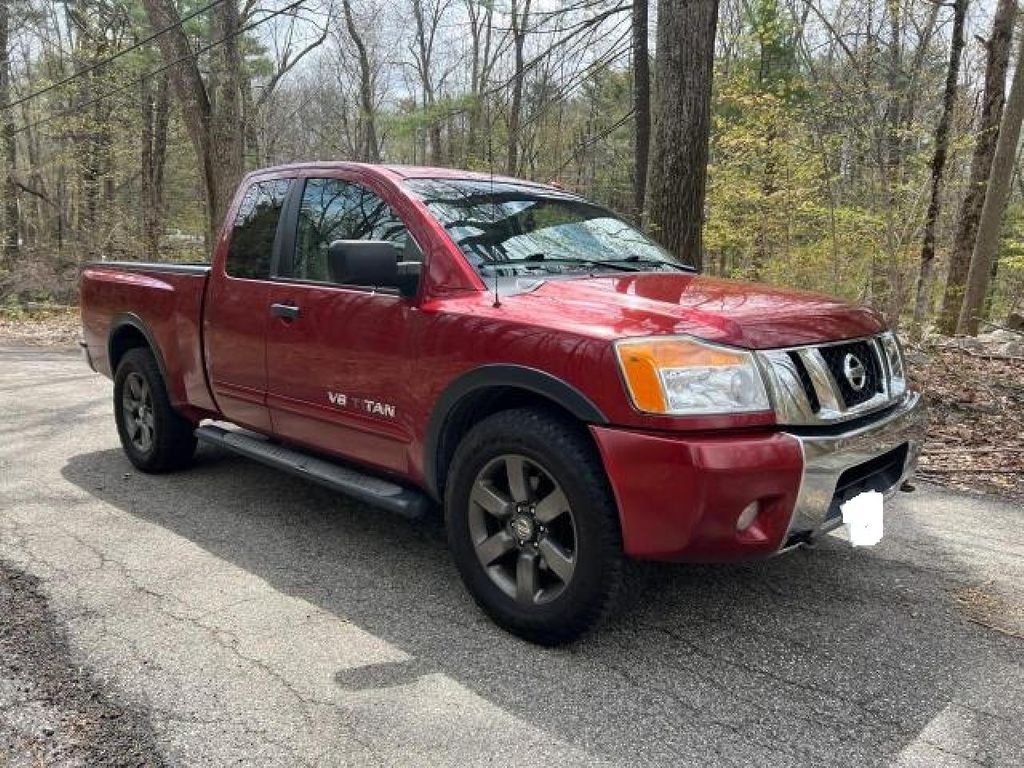
Photos
7 images
Sales History
1 records
Sale Prices
1 records
Market report
Price analytics
Historical Records
Historical records may include service and maintenance records, title status (clean, junk, salvage), insurance records, number of owners, registration events and states, and other information.
You can find more information about historical records in BADVIN reports and see more examples here.
Available historical records for VIN 5TFBW5F19HX635175
Latest reported mileage: 678 mi
Below you can see some examples of what these records could look like.
2023-05-21
a year ago
149,849 mi
Accident reported: minor damage with another motor vehicle
Damage to rear
Damage to rear
2022-07-10
2 years ago
18,969 mi
Vehicle serviced
40,000 mile service performed
40,000 mile service performed
2020-03-08
4 years ago
35,120 mi
SALVAGE TITLE/CERTIFICATE ISSUED
2017 TOYOTA TUNDRA DOUBLE CAB LIMITED
sold
| Year | 2017 |
| Title | Hidden text (Hidden text) |
| ODO | 4496 mi (Hidden text) |
| Damage | Hidden text, Hidden text |
| Estimated Retail Value | $3456 |
| Estimated Repair Cost | $3616 (995%) |
| Location | Salt Lake City, UT, 84101 |
| Date | ended 4 years ago |
| Sale Website Type | salvage or insurance auction |
sale information provided by user #904414


All photos above are REAL and display ACTUAL car. After you get the report you will see full resolution photos.
Tech Specs
| Body Style | CREW PIC |
| Color | WHITE |
| Transmission | AUTOMATIC |
| Engine | 5.7L 8 |
| Drive | 4x4 w/Rear Wheel Drv |
| Fuel Type | FLEXIBLE FUEL |
Sales & Winner Bids
This car appeared in sales 805 times.
| Location | Date | Highest Bid |
|---|---|---|
| Hidden text | 2023-08-09 | $4638 (FL, USA) 302+ bids in total |
Model Analytics & Market Report
We've analyzed more than 89,700 sales records of this model and here are some numbers.
The average price for new (MSRP) 2017 TOYOTA TUNDRA in 2017 was $50,857.
The average price for used 2017 TOYOTA TUNDRA nowadays in 2024 is $32,990 which is 65% from the original price.
Estimated mileage driven per year is 11,272 miles.
For this model we also have depreciation curve, photos, list of features and options, and other analytics.
Take a look at 2017 TOYOTA TUNDRA model page in BADVIN vehicles catalog.
Depreciation
The graph below is a depreciation curve for 2017 TOYOTA TUNDRA. It shows how much this model looses per year in price. This analytics is calculated using sales records from BADVIN database.
The table below shows average price for used 2017 TOYOTA TUNDRA in each year since the year of manufacturing, current year price and projected price in the future years.
You can scroll the table horizontally to see all columns.
| Year | Average Mileage | Average Price | % Left | % Lost | ||
|---|---|---|---|---|---|---|
| 2017 MSRP | 0 mi | $50,857 | — | — | 100% | 0% |
| 2017 | 11,272 mi | $59,999 | −$9,142 | −17.98% | 117.98% | -17.98% |
| 2018 | 22,544 mi | $56,989 | +$3,010 | +5.02% | 112.06% | -12.06% |
| 2019 | 33,816 mi | $48,974 | +$8,015 | +14.06% | 96.3% | 3.7% |
| 2020 | 45,088 mi | $42,729 | +$6,245 | +12.75% | 84.02% | 15.98% |
| 2021 | 56,360 mi | $40,764 | +$1,965 | +4.6% | 80.15% | 19.85% |
| → Visit 2017 TOYOTA TUNDRA depreciation page to see full data. | ||||||
Price vs Mileage
The graph below shows how mileage affects the price for 2017 TOYOTA TUNDRA. This data was calculated using sales records from BADVIN database.
The table below shows average price for used 2017 TOYOTA TUNDRA by mileage and number of sales.
You can scroll the table horizontally to see all columns.
| Mileage | Average Price | Sample Size |
|---|---|---|
| 10,000 mi | $38,499 | 10 sales |
| 15,000 mi | $40,496 | 28 sales |
| 20,000 mi | $38,554 | 28 sales |
| 25,000 mi | $38,225 | 94 sales |
| 30,000 mi | $38,427 | 93 sales |
| 35,000 mi | $36,900 | 163 sales |
| → Visit 2017 TOYOTA TUNDRA depreciation page to see full data. | ||
Get FULL ACCESS to the vehicle history report and see all blurred info.
⭐ Read 206+ reviews from our customers who used BADVIN to avoid buying junk vehicles.
Testimonials from our customers
Bad Vin's vehicle history report showed that the 2018 Audi A4 I was about to buy had been in a major accident that was not disclosed by the seller. The severity analysis helped me avoid a bad purchase. Great service!

Sophie Dubois
verified on Trustpilot
As a car dealer importing vehicles from the US to Mexico, I rely on badvin for comprehensive history reports before bidding at auctions. Their info has helped me avoid several salvage vehicles and is more thorough than carfax. A must-have service!
Javier Ramirez
verified on Trustpilot
Was shopping for a used Range Rover and found one that seemed suspiciously cheap. The badVIN report revealed it had been in a major front end collision, with photos showing the damage. Steered clear of that one and saved myself a ton of headaches!!
Ava Patel
verified on Trustpilot
As a used car dealer, I rely on badvin.org for checking every vehicle I'm considering purchasing at auction. The comprehensive reports give me peace of mind and help me avoid problem cars. Photos of past sales have saved me from overpaying many times. Worth every penny!
Misha
verified on Trustpilot
Compare to other 2017 TOYOTA TUNDRA

Other vehicles sales records

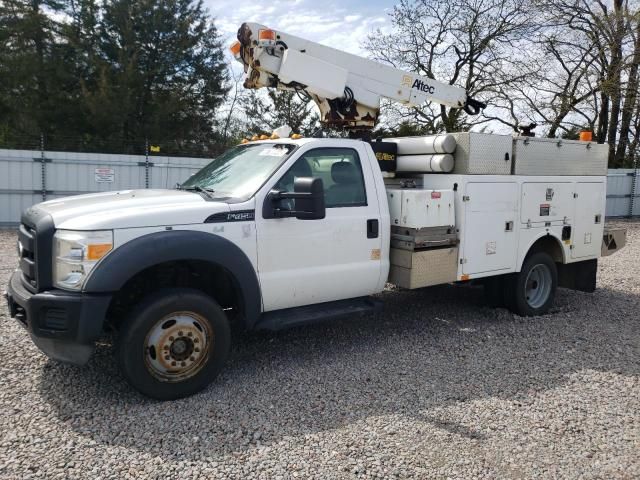
2012 FORD F450
16 days ago, 224,953 mi
est retail value $19,340
buy now price $1,600
VIN 1FDUF4HY2CED10705


Frequently asked questions
The exterior and interior condition of vehicles significantly affects their depreciation, as well-maintained vehicles generally retain more value.
Our reports may identify vehicles used for commercial purposes, detailing the extent of such use and its impact on the 2017 TOYOTA's condition, if such records are available.
Mileage data, collected over time, helps verify the actual use and condition of the 2017 TOYOTA vehicle, indicating wear and potential issues, if accurately recorded.
The frequency of oil changes, a crucial aspect of vehicle maintenance, might be documented in the service history section of our reports, if records are available.
Depreciation directly affects the resale value of a 2017 TOYOTA TUNDRA, with faster depreciating vehicles typically having lower resale values over time.
Our reports may include records of tire rotations, indicating how regularly they were performed and at what intervals for the 2017 TOYOTA, if data is available.


