
BADVIN vehicle history report for
2016 TOYOTA SIENNAVIN: 5TDXK3DC1GS748973
Get FULL ACCESS to the vehicle history report and see all blurred info.
⭐ Read 206+ reviews from our customers who used BADVIN to avoid buying junk vehicles.
Historical Records
12 events
Market report
Price analytics
Historical Records
Historical records may include service and maintenance records, title status (clean, junk, salvage), insurance records, number of owners, registration events and states, and other information.
You can find more information about historical records in BADVIN reports and see more examples here.
Available 12 historical records for VIN 5TDXK3DC1GS748973
Latest reported mileage: 302 mi
Below you can see some examples of what these records could look like.
2023-09-28
9 months ago
127,050 mi
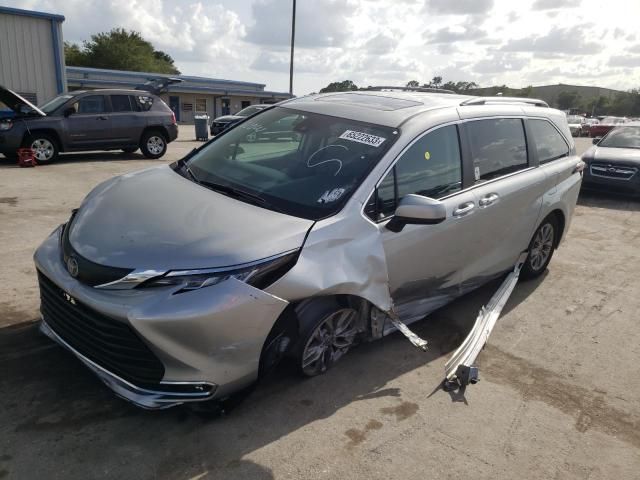
Accident reported
Vehicle involved in a sideswipe collision with another motor vehicle
Airbag deployed
Vehicle involved in a sideswipe collision with another motor vehicle
Airbag deployed
2022-02-22
2 years ago
13,544 mi
TOTAL LOSS VEHICLE
Collision damage reported
Collision damage reported
2020-04-29
4 years ago
32,351 mi
Odometer reading reported
Model Analytics & Market Report
We've analyzed more than 37,400 sales records of this model and here are some numbers.
The average price for new (MSRP) 2016 TOYOTA SIENNA in 2016 was $38,660.
The average price for used 2016 TOYOTA SIENNA nowadays in 2024 is $20,991 which is 54% from the original price.
Estimated mileage driven per year is 11,772 miles.
For this model we also have depreciation curve, photos, list of features and options, and other analytics.
Take a look at 2016 TOYOTA SIENNA model page in BADVIN vehicles catalog.
Depreciation
The graph below is a depreciation curve for 2016 TOYOTA SIENNA. It shows how much this model looses per year in price. This analytics is calculated using sales records from BADVIN database.
The table below shows average price for used 2016 TOYOTA SIENNA in each year since the year of manufacturing, current year price and projected price in the future years.
You can scroll the table horizontally to see all columns.
| Year | Average Mileage | Average Price | % Left | % Lost | ||
|---|---|---|---|---|---|---|
| 2016 MSRP | 0 mi | $38,660 | — | — | 100% | 0% |
| 2016 | 11,772 mi | $51,246 | −$12,586 | −32.56% | 132.56% | -32.56% |
| 2017 | 23,544 mi | $43,995 | +$7,251 | +14.15% | 113.8% | -13.8% |
| 2018 | 35,316 mi | $41,457 | +$2,538 | +5.77% | 107.23% | -7.23% |
| 2019 | 47,088 mi | $39,998 | +$1,459 | +3.52% | 103.46% | -3.46% |
| 2020 | 58,860 mi | $32,933 | +$7,065 | +17.66% | 85.19% | 14.81% |
| → Visit 2016 TOYOTA SIENNA depreciation page to see full data. | ||||||
Price vs Mileage
The graph below shows how mileage affects the price for 2016 TOYOTA SIENNA. This data was calculated using sales records from BADVIN database.
The table below shows average price for used 2016 TOYOTA SIENNA by mileage and number of sales.
You can scroll the table horizontally to see all columns.
| Mileage | Average Price | Sample Size |
|---|---|---|
| 15,000 mi | $32,995 | 35 sales |
| 20,000 mi | $32,994 | 32 sales |
| 25,000 mi | $31,366 | 40 sales |
| 30,000 mi | $30,990 | 98 sales |
| 35,000 mi | $28,806 | 71 sales |
| 40,000 mi | $28,944 | 110 sales |
| → Visit 2016 TOYOTA SIENNA depreciation page to see full data. | ||
Testimonials from our customers
Was shopping for a used Range Rover and found one that seemed suspiciously cheap. The badVIN report revealed it had been in a major front end collision, with photos showing the damage. Steered clear of that one and saved myself a ton of headaches!!

Ava Patel
verified on Trustpilot
Bad Vin's vehicle history report showed that the 2018 Audi A4 I was about to buy had been in a major accident that was not disclosed by the seller. The severity analysis helped me avoid a bad purchase. Great service!
Sophie Dubois
verified on Trustpilot
BadVin's vehicle history report is a must-have before buying any used vehicle. It's saved me from a few lemons over the years - cars that looked great on the surface but had hidden issues like accidents or title problems. Well worth the price.
Camila Santos
verified on Trustpilot
I've tried many vehicle reports but badvin's is by far the most comprehensive. It shows accident photos, past sales, repairs and so much more. I won't buy a car now without getting a report first. It's a must-have.
Alexander Hunt
verified on Trustpilot
Compare to other 2016 TOYOTA SIENNA
2013 TOYOTA RAV4
in 4 days, 78,711 mi
est retail value $16,947
buy now price $5,900
VIN JTMBFREV6DD039738
2022 TOYOTA COROLLA
in 2 days, 21,671 mi
est retail value $23,805
buy now price $5,600
VIN JTNB4MBE2N3160704
2018 TOYOTA CAMRY
in 5 days, 108,499 mi
est retail value $17,624
buy now price $7,300
VIN JTNB11HK6J3041133
2016 TOYOTA AVALON
in 5 days, 20,289 mi
est retail value $29,472
buy now price $9,300
VIN 4T1BK1EB9GU225521
Other vehicles sales records


2011 CHEVROLET EXPRESS
in 16 days, 162,708 mi
est retail value $9,741
buy now price $2,800
VIN 1GB0G2CG4B1115007
Frequently asked questions
Dismantled status, if noted, shows the vehicle has been taken apart for parts or salvage, significantly impacting the 2016 TOYOTA's value and functionality.
Our reports may identify vehicles used for commercial purposes, detailing the extent of such use and its impact on the 2016 TOYOTA's condition, if such records are available.
You can use a Monroney label to compare different 2016 TOYOTA models by reviewing their features, fuel economy, safety equipment, and pricing directly on the sticker.
MSRP on a Monroney label stands for Manufacturer's Suggested Retail Price, which is the recommended selling price for a vehicle.
The report may include detailed records of previous repairs, including parts replaced, to give you a clear picture of the 2016 TOYOTA vehicle's repair history, depending on the records available.
You can find your vehicle's VIN on the dashboard on the driver's side, visible through the windshield, and on your vehicle's registration documents.


