
BADVIN vehicle history report for
2018 TOYOTA CAMRYVIN: 4T1BZ1HK1JU002176
Get FULL ACCESS to the vehicle history report and see all blurred info.
⭐ Read 206+ reviews from our customers who used BADVIN to avoid buying junk vehicles.
Historical Records
events
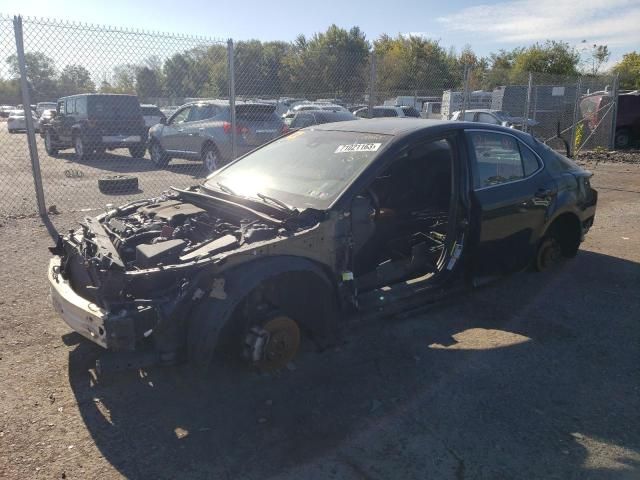
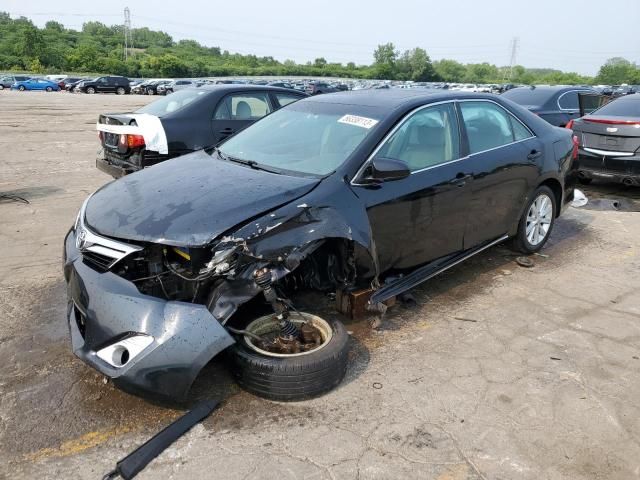
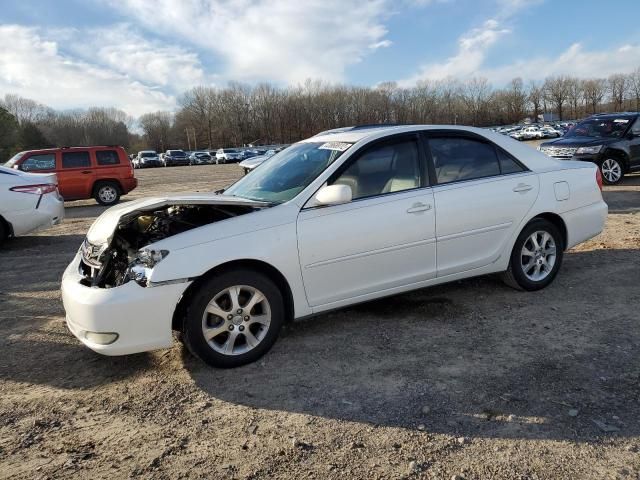
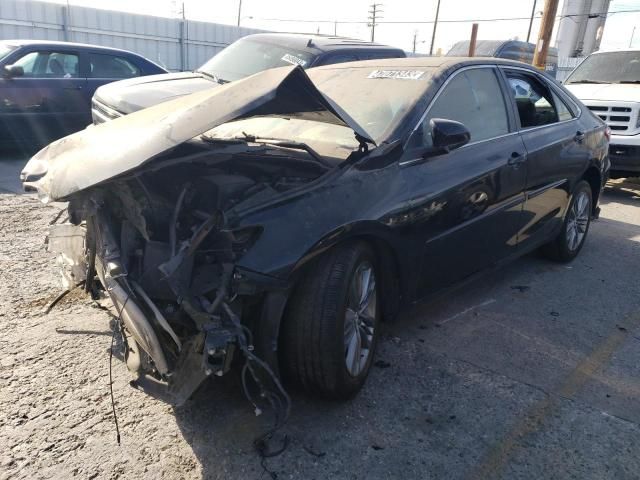
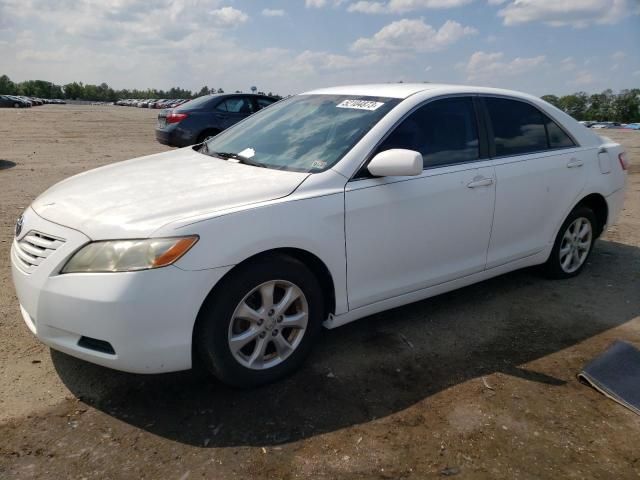
Photos
8 images
Sales History
1 records
Market report
Price analytics
Historical Records
Historical records may include service and maintenance records, title status (clean, junk, salvage), insurance records, number of owners, registration events and states, and other information.
You can find more information about historical records in BADVIN reports and see more examples here.
Available historical records for VIN 4T1BZ1HK1JU002176
Latest reported mileage: 207 mi
Below you can see some examples of what these records could look like.
2023-11-22
7 months ago
149,360 mi
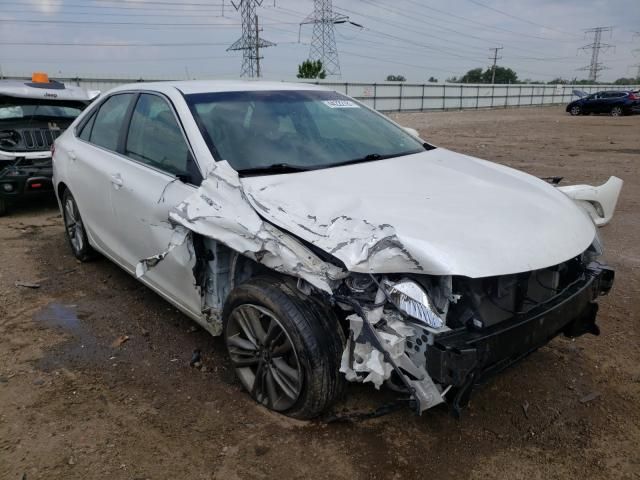
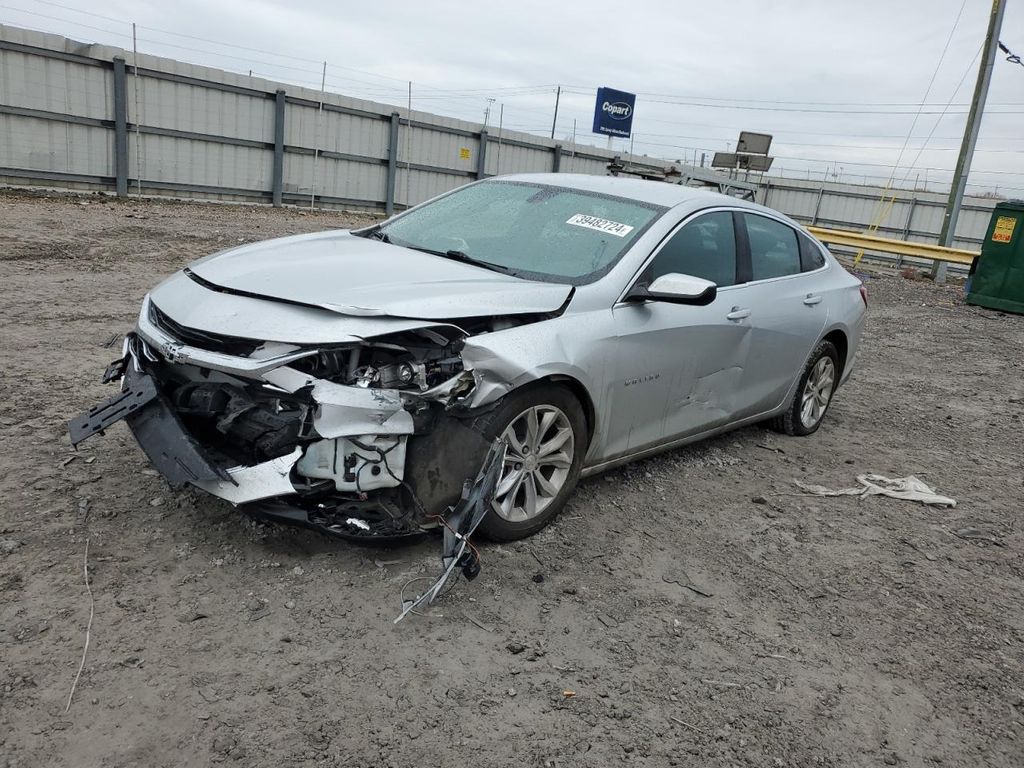
Damage reported
Damage to front
Damage to front
2022-02-02
2 years ago
21,355 mi
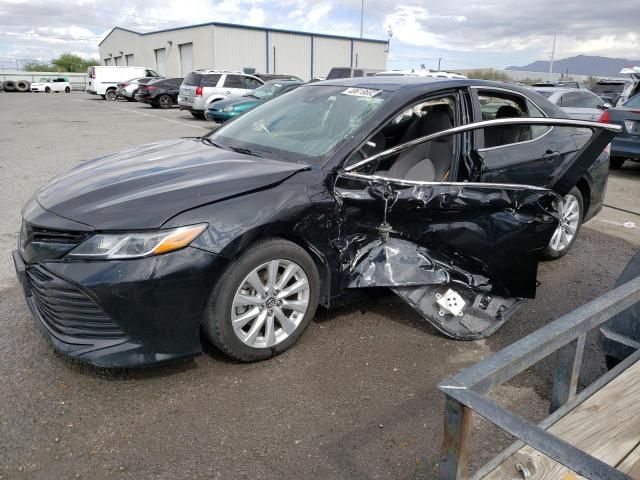
TOTAL LOSS VEHICLE
Vehicle declared a total loss by an insurance company
Collision damage reported
Vehicle declared a total loss by an insurance company
Collision damage reported
2021-06-30
3 years ago
41,206 mi
Vehicle serviced
Outer tie rod(s) replaced
Alignment performed
Outer tie rod(s) replaced
Alignment performed
Sale Record
2018 TOYOTA CAMRY XSE
sold
| Year | 2018 |
| Title | Hidden text (Hidden text) |
| ODO | 8740 mi (Hidden text) |
| Damage | Hidden text, Hidden text |
| Estimated Retail Value | $7800 |
| Estimated Repair Cost | $4244 (959%) |
| Location | Houston, TX, 77041 |
| Date | ended 2 years ago |
| Sale Website Type | salvage or insurance auction |
sale information provided by user #399264


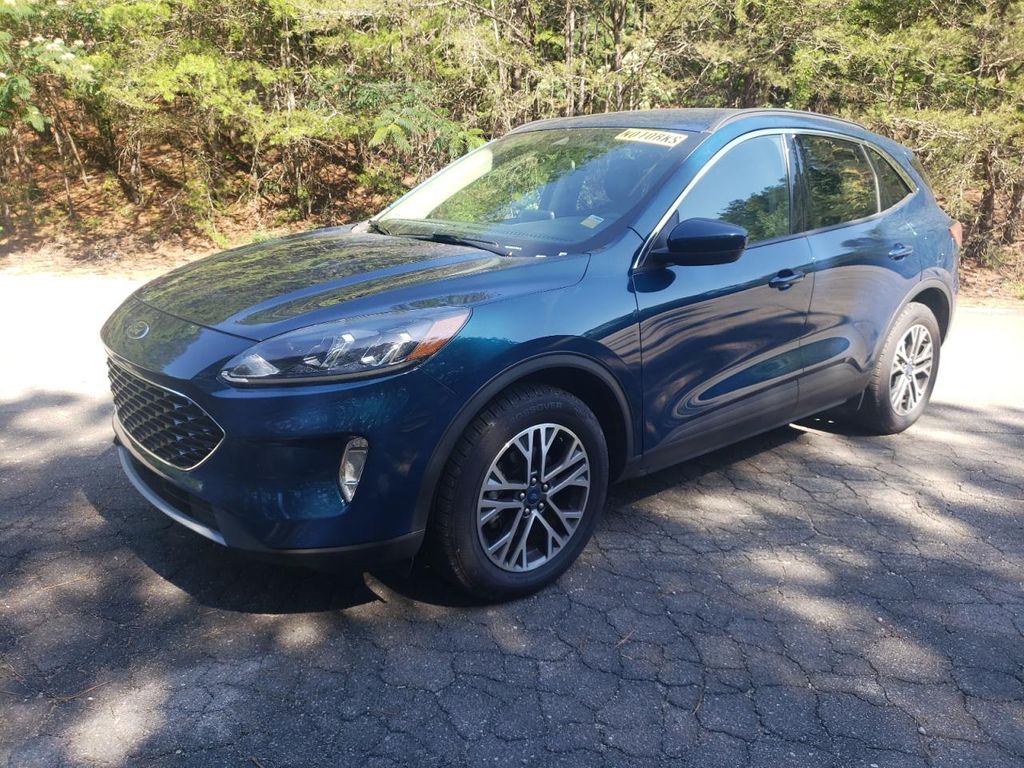
All photos above are REAL and display ACTUAL car. After you get the report you will see full resolution photos.
Tech Specs
| Color | BLACK |
| Transmission | AUTOMATIC |
| Engine | 3.5L 6 |
| Drive | Front-wheel Drive |
| Fuel Type | GAS |
Model Analytics & Market Report
We've analyzed more than 279,300 sales records of this model and here are some numbers.
The average price for new (MSRP) 2018 TOYOTA CAMRY in 2018 was $27,765.
The average price for used 2018 TOYOTA CAMRY nowadays in 2024 is $19,988 which is 72% from the original price.
Estimated mileage driven per year is 9,684 miles.
For this model we also have depreciation curve, photos, list of features and options, and other analytics.
Take a look at 2018 TOYOTA CAMRY model page in BADVIN vehicles catalog.
Depreciation
The graph below is a depreciation curve for 2018 TOYOTA CAMRY. It shows how much this model looses per year in price. This analytics is calculated using sales records from BADVIN database.
The table below shows average price for used 2018 TOYOTA CAMRY in each year since the year of manufacturing, current year price and projected price in the future years.
You can scroll the table horizontally to see all columns.
| Year | Average Mileage | Average Price | % Left | % Lost | ||
|---|---|---|---|---|---|---|
| 2018 MSRP | 0 mi | $27,765 | — | — | 100% | 0% |
| 2018 | 9,684 mi | $28,990 | −$1,225 | −4.41% | 104.41% | -4.41% |
| 2019 | 19,368 mi | $25,949 | +$3,041 | +10.49% | 93.46% | 6.54% |
| 2020 | 29,052 mi | $24,900 | +$1,049 | +4.04% | 89.68% | 10.32% |
| 2021 | 38,736 mi | $23,726 | +$1,174 | +4.71% | 85.45% | 14.55% |
| 2022 | 48,420 mi | $22,910 | +$816 | +3.44% | 82.51% | 17.49% |
| → Visit 2018 TOYOTA CAMRY depreciation page to see full data. | ||||||
Price vs Mileage
The graph below shows how mileage affects the price for 2018 TOYOTA CAMRY. This data was calculated using sales records from BADVIN database.
The table below shows average price for used 2018 TOYOTA CAMRY by mileage and number of sales.
You can scroll the table horizontally to see all columns.
| Mileage | Average Price | Sample Size |
|---|---|---|
| 5,000 mi | $25,998 | 12 sales |
| 10,000 mi | $23,931 | 44 sales |
| 15,000 mi | $23,998 | 56 sales |
| 20,000 mi | $22,998 | 78 sales |
| 25,000 mi | $22,999 | 87 sales |
| 30,000 mi | $22,000 | 160 sales |
| → Visit 2018 TOYOTA CAMRY depreciation page to see full data. | ||
Get FULL ACCESS to the vehicle history report and see all blurred info.
⭐ Read 206+ reviews from our customers who used BADVIN to avoid buying junk vehicles.
Testimonials from our customers
As a broke college kid I almost settled for a sketchy 2005 Altima cuz it was cheap. but splurged on the report from badvin 1st. soooo glad I did - turned out it had been totalled and rebuilt. spending a little saved me from wasting $1000s!

Sophie
verified on Trustpilot
I buy rebuilt title cars at copart to fix and resell. was hoping BadVin reports wud have more detail on damage history to help me value cars before bidding, Carfax is better for that. but for clean title vehicles it seems pretty useful
Fatima
verified on Trustpilot
I've tried many vehicle reports but badvin's is by far the most comprehensive. It shows accident photos, past sales, repairs and so much more. I won't buy a car now without getting a report first. It's a must-have.
Alexander Hunt
verified on Trustpilot
As a used car dealer, I rely on badvin.org for checking every vehicle I'm considering purchasing at auction. The comprehensive reports give me peace of mind and help me avoid problem cars. Photos of past sales have saved me from overpaying many times. Worth every penny!
Misha
verified on Trustpilot
Compare to other 2018 TOYOTA CAMRY


2018 TOYOTA CAMRY
in 2 days, 108,499 mi
est retail value $17,624
buy now price $6,500
VIN JTNB11HK6J3041133

Other vehicles sales records

2004 VOLVO XC90
in 21 hours, 206,042 mi
est retail value $5,651
buy now price $125
VIN YV1CY59H041084388

2022 HYUNDAI TUCSON
in 21 hours, 28,068 mi
est retail value $25,325
buy now price $10,500
VIN 5NMJFCAE2NH063588

2020 CHEVROLET MALIBU
7 days ago, 58,254 mi
est retail value $21,713
buy now price $2,875
VIN 1G1ZD5ST9LF115156


2021 RAM 3500
in 21 hours, 100,815 mi
est retail value $51,559
buy now price $25,000
VIN 3C63RRJL6MG666742

2012 VOLKSWAGEN PASSAT
in 21 hours, 240,668 mi
est retail value $3,023
buy now price $450
VIN 1VWBP7A38CC031857
Frequently asked questions
Information on structural damage, including the extent and location of the damage, may be detailed in our vehicle history reports for 2018 TOYOTA vehicles, if available.
The best time of year to sell your car to minimize depreciation might be just before the release of a new model, when demand for used models could be higher.
Leasing history, if included, may detail the duration and terms under which the 2018 TOYOTA CAMRY was leased, which can influence its maintenance and condition, depending on the data provided.
A flood or lemon title, if reported, indicates significant past issues, which are detailed in our reports to inform potential buyers of the risks associated with such vehicles.
Our reports may include photos from previous sales, offering a visual history that helps assess the 2018 TOYOTA vehicle’s condition over time, if such photos are available.
The VIN (Vehicle Identification Number) is a unique code for identifying a specific vehicle. It can reveal the 2018 TOYOTA car's manufacturer, model year, and place of assembly, depending on the data encoded.
Damage severity, if reported, is classified as minor, moderate, or severe, and may provide insights into the extent of damage the 2018 TOYOTA vehicle has sustained.
Some models may depreciate faster due to factors like lower demand, higher maintenance costs, or outdated technology compared to newer versions.
Transmission replacement history, if applicable, might be detailed in our reports, providing insights into major repairs and vehicle reliability, if available.


