
BADVIN vehicle history report for
2018 TOYOTA CAMRYVIN: 4T1B11HK8JU012176
Get FULL ACCESS to the vehicle history report and see all blurred info.
⭐ Read 205+ reviews from our customers who used BADVIN to avoid buying junk vehicles.
Historical Records
events
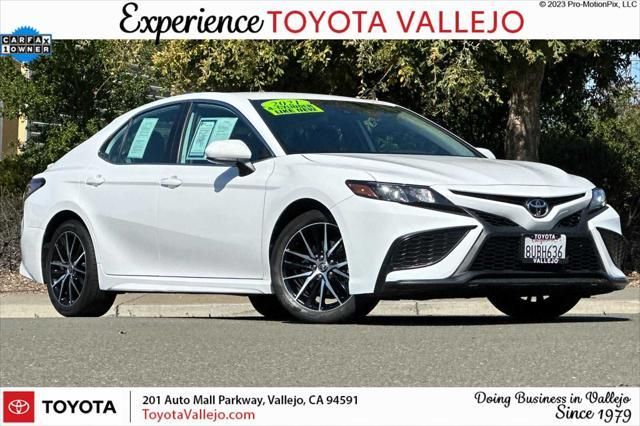
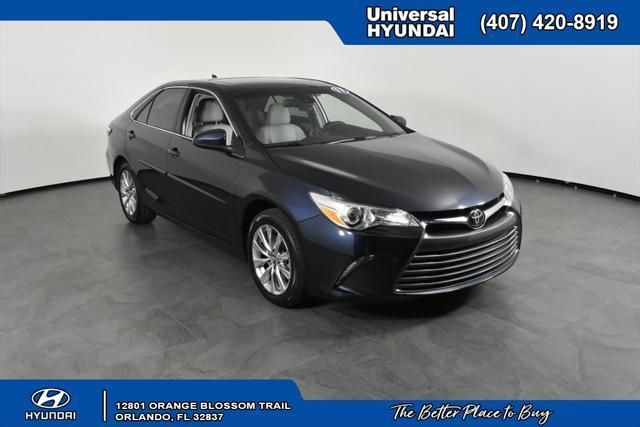
Photos
12 images
Sales History
1 records
Sale Prices
1 records
Market report
Price analytics
Historical Records
Historical records may include service and maintenance records, title status (clean, junk, salvage), insurance records, number of owners, registration events and states, and other information.
You can find more information about historical records in BADVIN reports and see more examples here.
Available historical records for VIN 4T1B11HK8JU012176
Latest reported mileage: 199 mi
Below you can see some examples of what these records could look like.
2023-02-27
a year ago
126,502 mi
Damage reported: very minor damage
Damage to rear
Damage to rear
2022-03-08
2 years ago
22,381 mi
TOTAL LOSS VEHICLE
Vehicle declared a total loss by an insurance company
Collision damage reported
Vehicle declared a total loss by an insurance company
Collision damage reported
2020-06-20
4 years ago
27,317 mi
Passed emissions inspection
| Year | 2018 |
| ODO | 2415 mi |
| Seller | Hidden text (Hidden text) |
| Location | Mobile, AL, 36606 |
| Date | appeared 4 years ago latest price $3519 sale post disappeared 2019-07-04 |
| Price History | |
| Sale Website Type | classifieds |
| Notes | |
| Hidden text | |
sale information provided by user #529500


All photos above are REAL and display ACTUAL car. After you get the report you will see full resolution photos.
Tech Specs
| Body Style | Sedan |
| Color | Celestial Silver Metallic |
| Color (Interior) | Black |
| Transmission | Automatic |
| Engine | Regular Unleaded I-4 2.5 L/152 |
| Drive | FWD |
| Fuel Type | Gasoline |
Extra Features
- Black
- Hidden text
- Celestial Silver Metallic
Standard Features
All these features are based on a model in general. This specific vehicle may differ.
- Hidden text
- Back-Up Camera
- Hidden text
- Driver Adjustable Lumbar
- Hidden text
- Aluminum Wheels
- Hidden text
- Climate Control
- Hidden text
- Front Wheel Drive
- Hidden text
- BLACK FABRIC SEAT TRIM W/SOFTEX
- Hidden text
- Daytime Running Lights
- Hidden text
- Knee Air Bag
- Hidden text
- Automatic Headlights
- Hidden text
- Cloth Seats
- Hidden text
- Intermittent Wipers
- Hidden text
- Passenger Vanity Mirror
- Hidden text
- Auxiliary Audio Input
- Hidden text
- Cruise Control
- Hidden text
- Keyless Entry
- Hidden text
- Lane Departure Warning
- Hidden text
- Passenger Air Bag Sensor
- Hidden text
- Pass-Through Rear Seat
- Hidden text
- Rear Bench Seat
- Hidden text
- Rear Side Air Bag
- Hidden text
- Passenger Air Bag
- Hidden text
- Rear Head Air Bag
- Hidden text
- Tires - Rear Performance
- Hidden text
- Power Door Locks
- Hidden text
- Smart Device Integration
- Hidden text
- Premium Synthetic Seats
- Hidden text
- Trip Computer
- Hidden text
- Rear Spoiler
- Hidden text
- Steering Wheel Audio Controls
- Hidden text
- Variable Speed Intermittent Wipers
Model Analytics & Market Report
We've analyzed more than 279,300 sales records of this model and here are some numbers.
The average price for new (MSRP) 2018 TOYOTA CAMRY in 2018 was $27,765.
The average price for used 2018 TOYOTA CAMRY nowadays in 2024 is $19,988 which is 72% from the original price.
Estimated mileage driven per year is 9,684 miles.
For this model we also have depreciation curve, photos, list of features and options, and other analytics.
Take a look at 2018 TOYOTA CAMRY model page in BADVIN vehicles catalog.
Depreciation
The graph below is a depreciation curve for 2018 TOYOTA CAMRY. It shows how much this model looses per year in price. This analytics is calculated using sales records from BADVIN database.
The table below shows average price for used 2018 TOYOTA CAMRY in each year since the year of manufacturing, current year price and projected price in the future years.
You can scroll the table horizontally to see all columns.
| Year | Average Mileage | Average Price | % Left | % Lost | ||
|---|---|---|---|---|---|---|
| 2018 MSRP | 0 mi | $27,765 | — | — | 100% | 0% |
| 2018 | 9,684 mi | $28,990 | −$1,225 | −4.41% | 104.41% | -4.41% |
| 2019 | 19,368 mi | $25,949 | +$3,041 | +10.49% | 93.46% | 6.54% |
| 2020 | 29,052 mi | $24,900 | +$1,049 | +4.04% | 89.68% | 10.32% |
| 2021 | 38,736 mi | $23,726 | +$1,174 | +4.71% | 85.45% | 14.55% |
| 2022 | 48,420 mi | $22,910 | +$816 | +3.44% | 82.51% | 17.49% |
| → Visit 2018 TOYOTA CAMRY depreciation page to see full data. | ||||||
Price vs Mileage
The graph below shows how mileage affects the price for 2018 TOYOTA CAMRY. This data was calculated using sales records from BADVIN database.
The table below shows average price for used 2018 TOYOTA CAMRY by mileage and number of sales.
You can scroll the table horizontally to see all columns.
| Mileage | Average Price | Sample Size |
|---|---|---|
| 5,000 mi | $25,998 | 12 sales |
| 10,000 mi | $23,931 | 44 sales |
| 15,000 mi | $23,998 | 56 sales |
| 20,000 mi | $22,998 | 78 sales |
| 25,000 mi | $22,999 | 87 sales |
| 30,000 mi | $22,000 | 160 sales |
| → Visit 2018 TOYOTA CAMRY depreciation page to see full data. | ||
Get FULL ACCESS to the vehicle history report and see all blurred info.
⭐ Read 205+ reviews from our customers who used BADVIN to avoid buying junk vehicles.
Testimonials from our customers
I've tried many vehicle reports but badvin's is by far the most comprehensive. It shows accident photos, past sales, repairs and so much more. I won't buy a car now without getting a report first. It's a must-have.

Alexander Hunt
verified on Trustpilot
Purchased a badvin report before buying a used Lexus RX 350. It revealed a minor accident the seller hadn't mentioned. I still bought the car but used the info to negotiate a lower price. Well worth the cost for the leverage it gave me!
Aiden Patel
verified on Trustpilot
Was shopping for a used Range Rover and found one that seemed suspiciously cheap. The badVIN report revealed it had been in a major front end collision, with photos showing the damage. Steered clear of that one and saved myself a ton of headaches!!
Ava Patel
verified on Trustpilot
I almost bought a used Honda but luckily checked the BadVin report first. Turned out it had a salvage title from flood damage that the seller didn't disclose. Phew, dodged a huge issue!
Emily Turner
verified on Trustpilot
Compare to other 2018 TOYOTA CAMRY


Other vehicles sales records


Frequently asked questions
The market value of a vehicle is calculated based on its historical depreciation trends, current condition, mileage, and market trends.
Mileage is considered a major factor in the depreciation of vehicles because it directly correlates with the amount of use and potential wear and tear the vehicle has undergone.
Use as a police or taxi vehicle, if noted, indicates high-intensity use which may affect the 2018 TOYOTA vehicle's condition and lifespan, if such use is documented.
High mileage typically accelerates the depreciation of a vehicle, as it may indicate increased wear and tear and potential future repairs.
Our vehicle history reports may include records of repairs undertaken after accidents, detailing the nature of the damage and the types of repairs, if this information is available.
Flood damage, if reported, can compromise key systems and reduce the 2018 TOYOTA CAMRY's reliability and value, detailed in the report for potential buyers.
Remanufactured status, if detailed, includes major overhauls and replacements, offering a new lease on life for the 2018 TOYOTA, but with considerations for its past use.
While not necessary, decoding a VIN for a routine service appointment can provide the mechanic with precise model information, facilitating accurate service and parts replacement.
The Monroney label helps you understand the added features on a 2018 TOYOTA CAMRY by listing optional equipment and packages included in the vehicle, along with their pricing.


