
BADVIN vehicle history report for
2013 FORD FUSIONVIN: 3FA6P0K97DR108077
Get FULL ACCESS to the vehicle history report and see all blurred info.
⭐ Read 205+ reviews from our customers who used BADVIN to avoid buying junk vehicles.
Historical Records
events
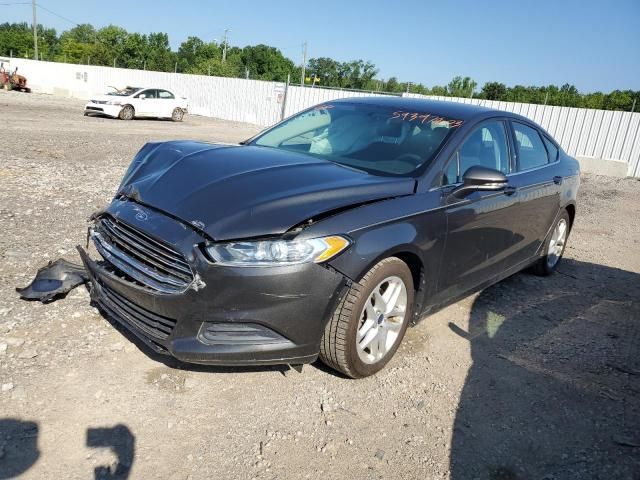
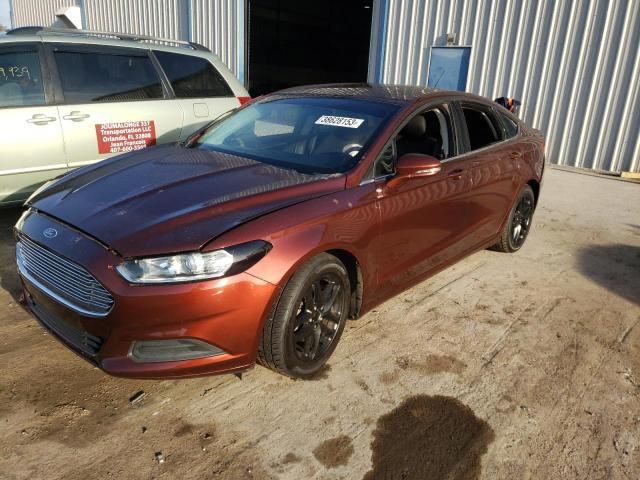
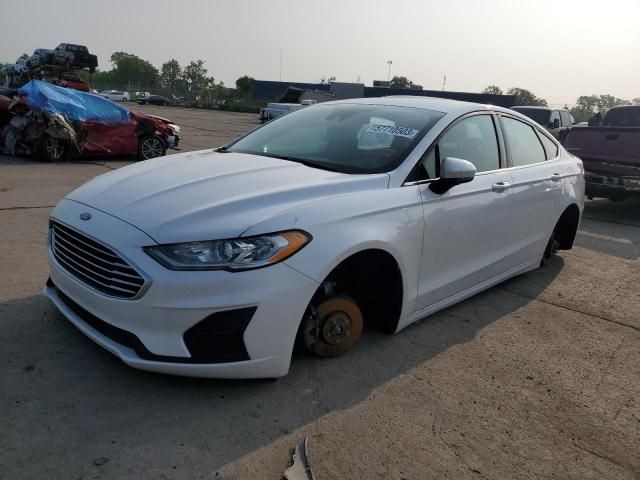
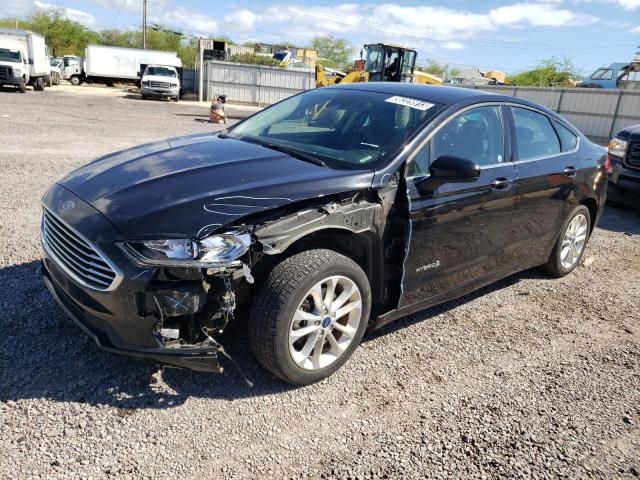
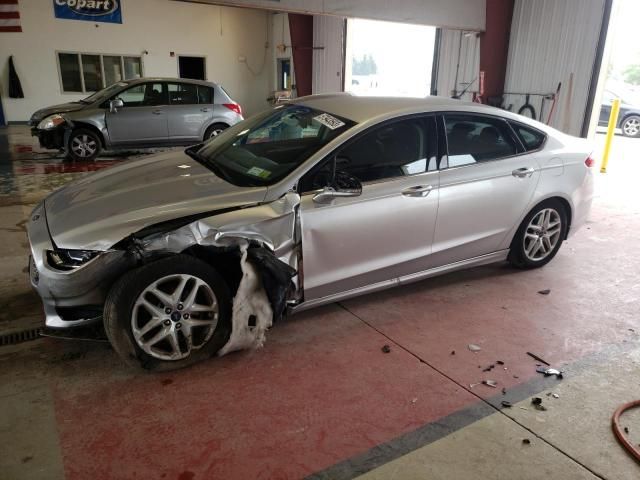
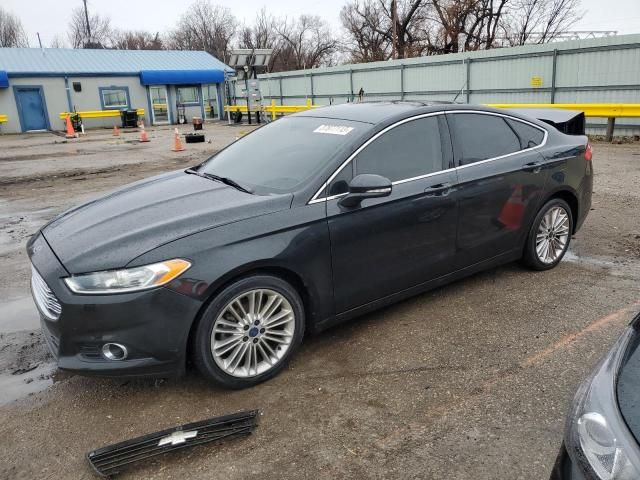
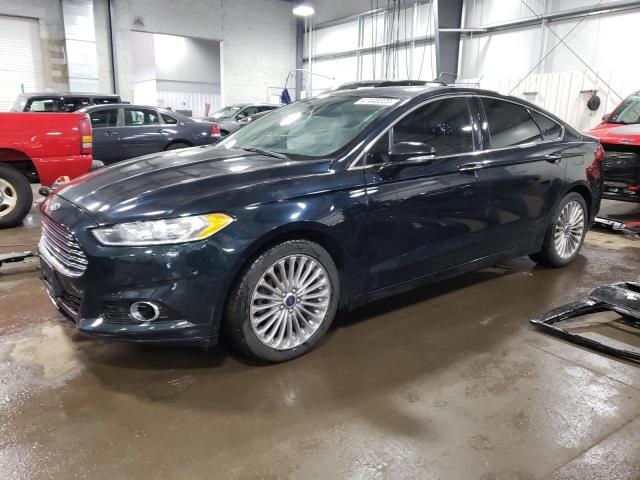
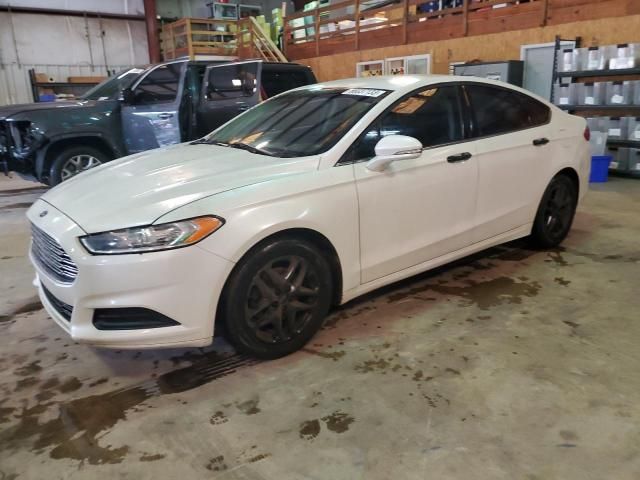
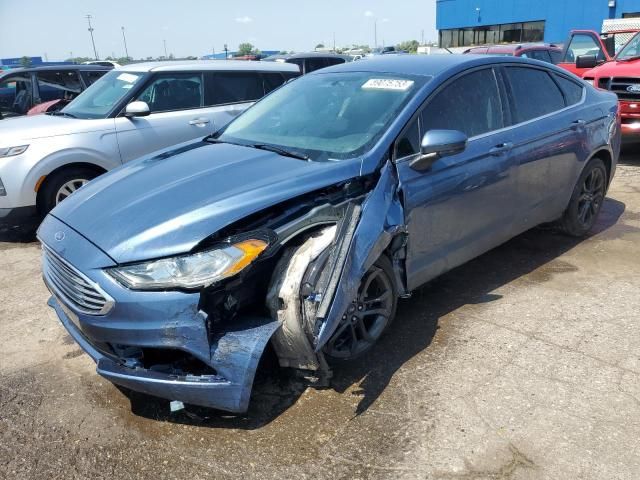
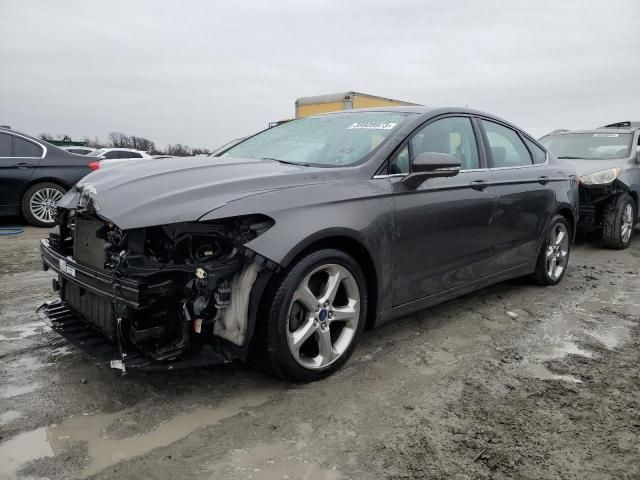
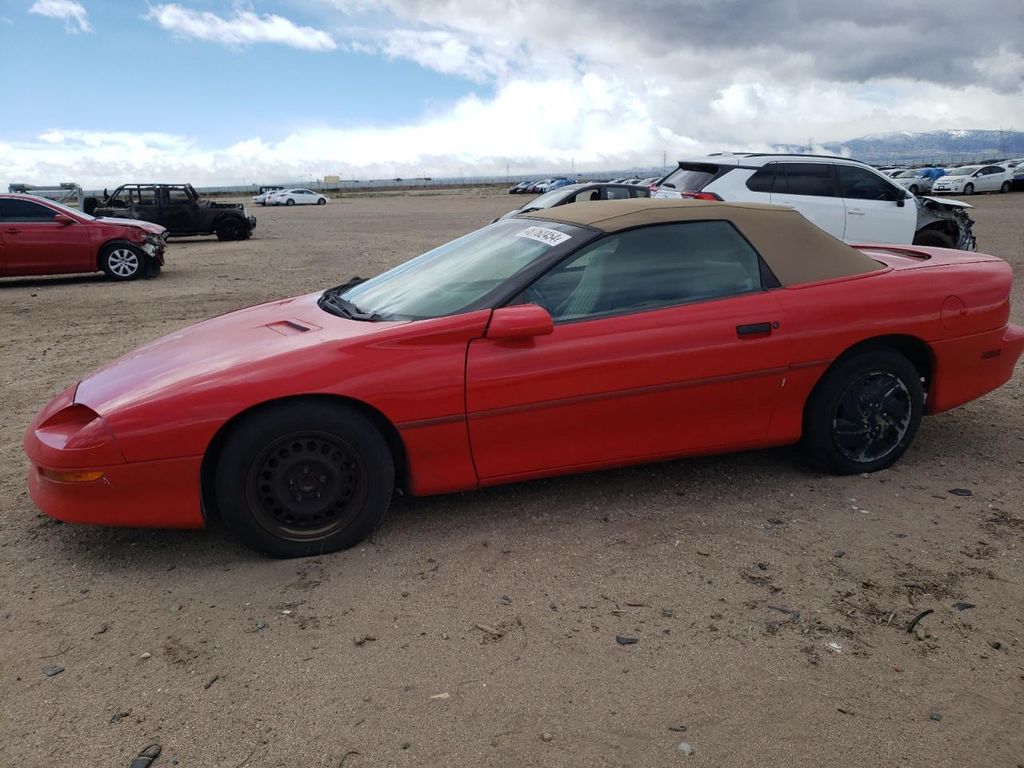
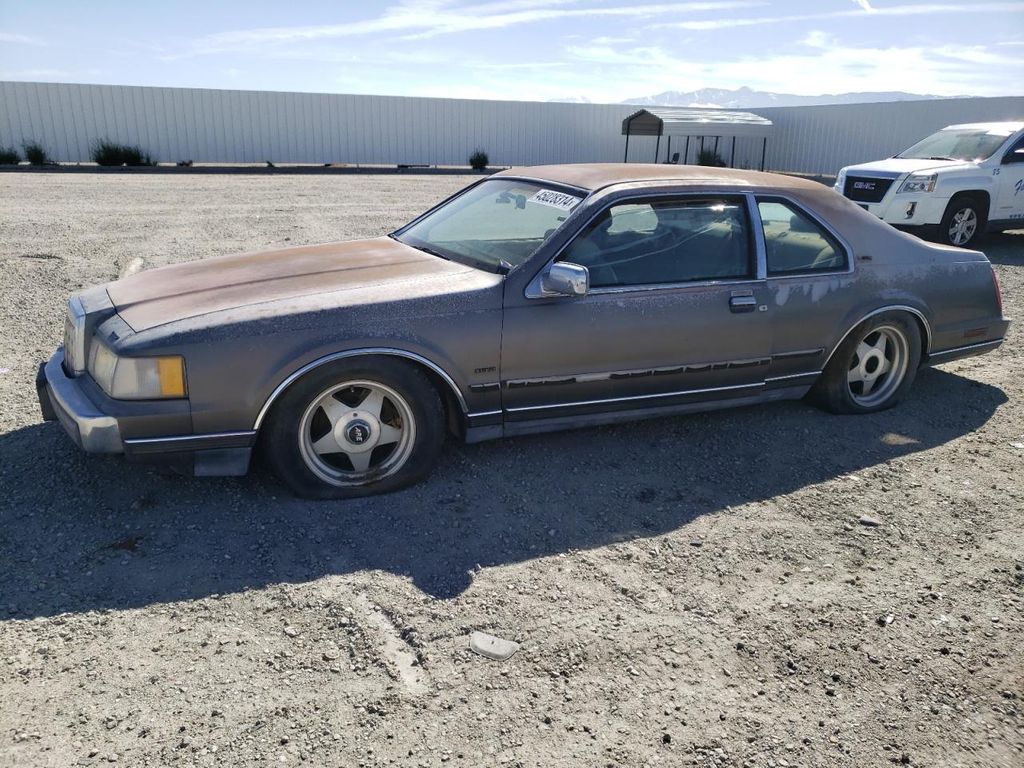
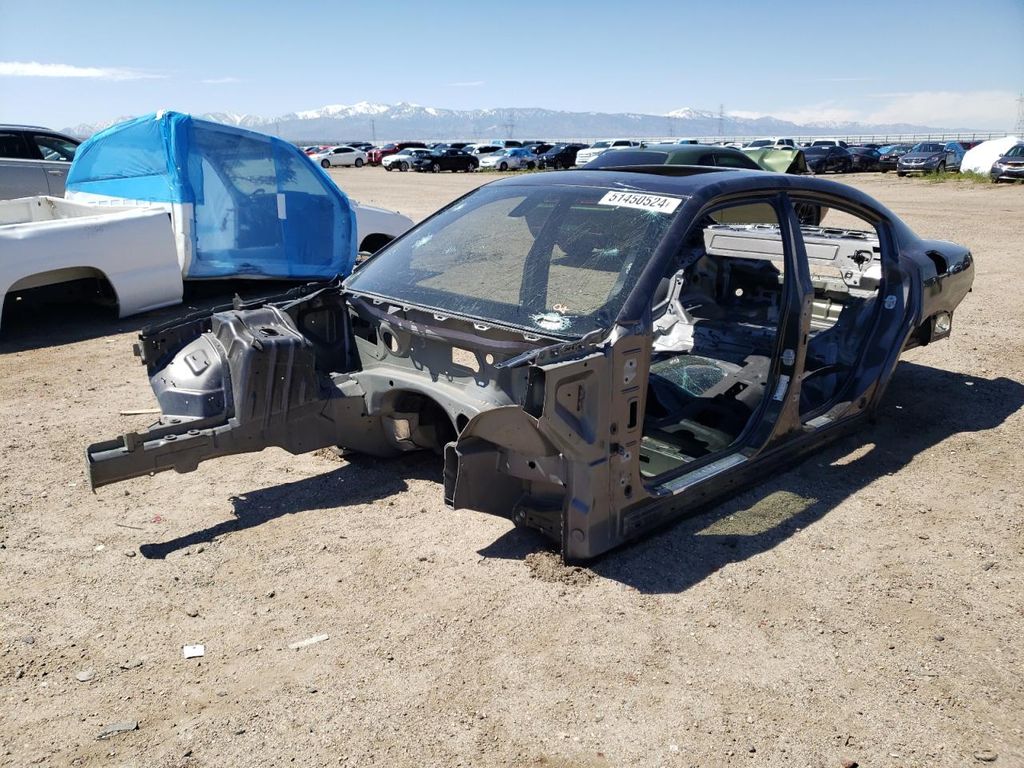
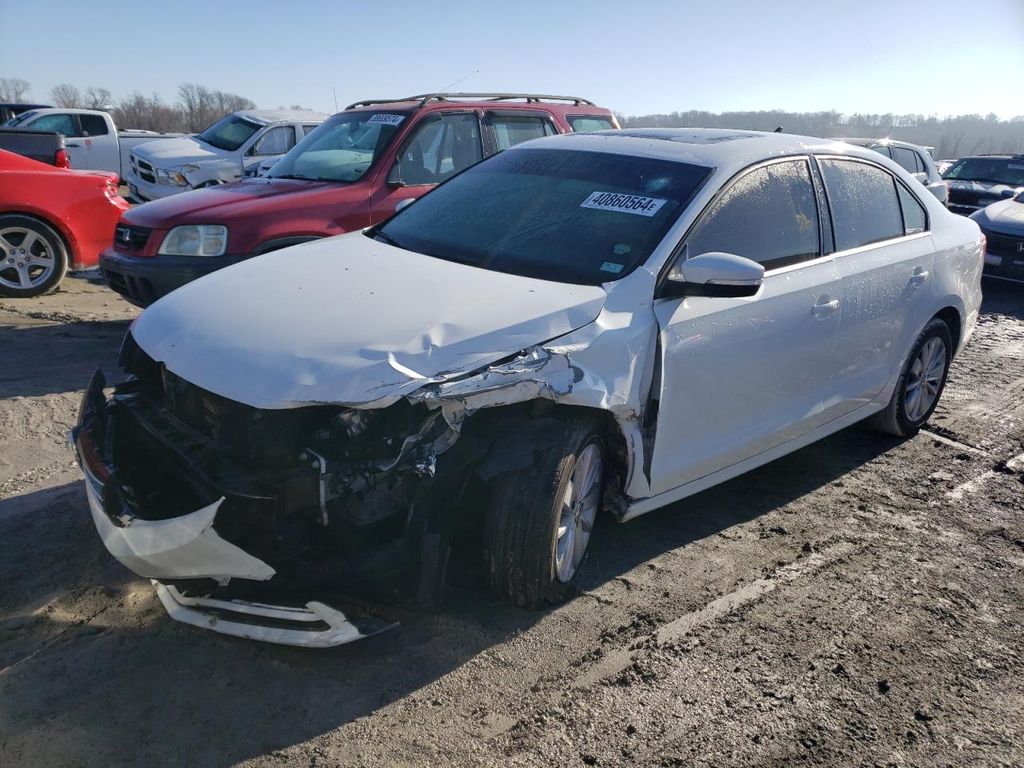
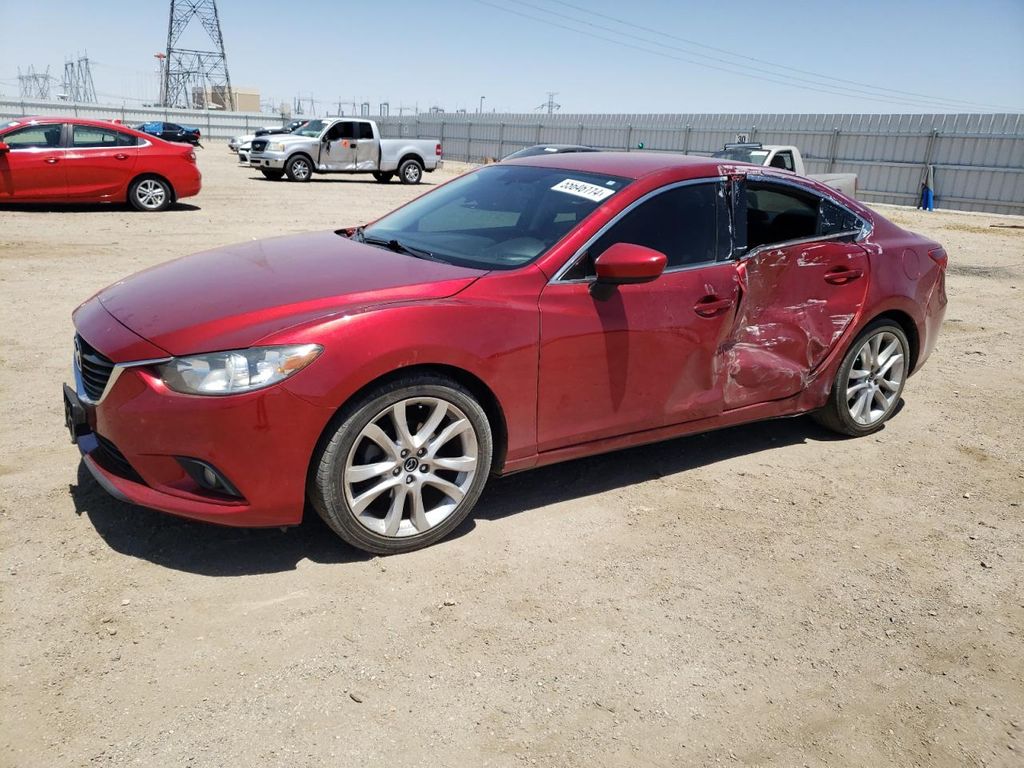
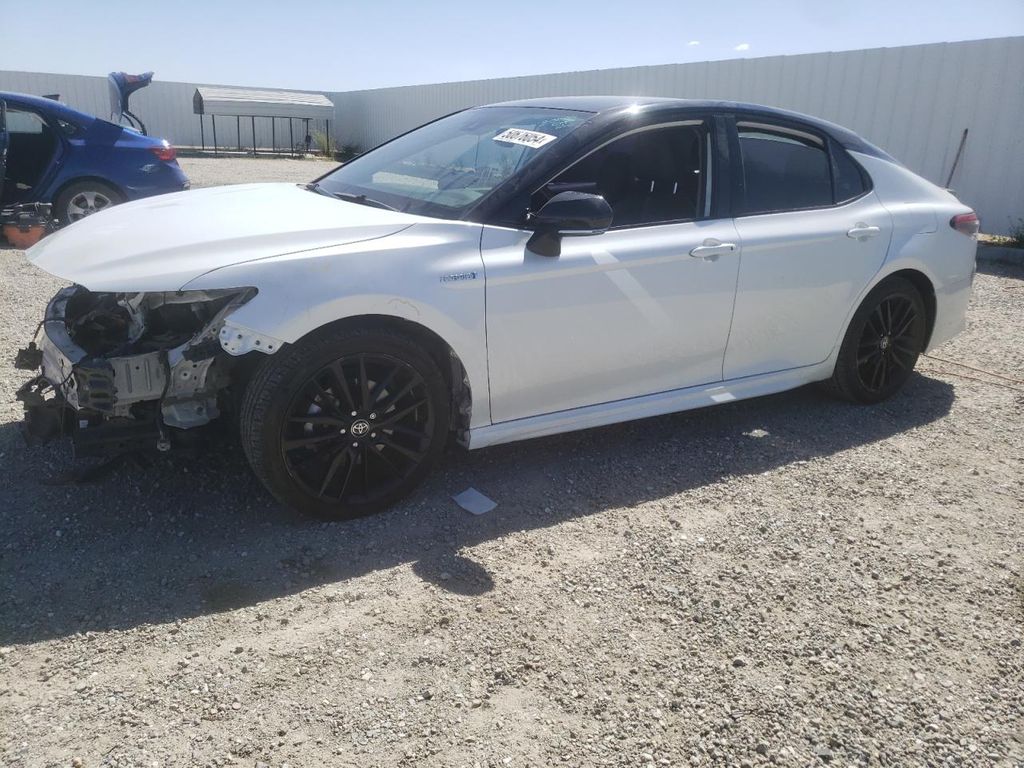
Photos
10 images
Sales History
1 records
Sale Prices
1 records
Market report
Price analytics
Historical Records
Historical records may include service and maintenance records, title status (clean, junk, salvage), insurance records, number of owners, registration events and states, and other information.
You can find more information about historical records in BADVIN reports and see more examples here.
Available historical records for VIN 3FA6P0K97DR108077
Latest reported mileage: 297 mi
Below you can see some examples of what these records could look like.
2023-11-11
7 months ago
119,680 mi
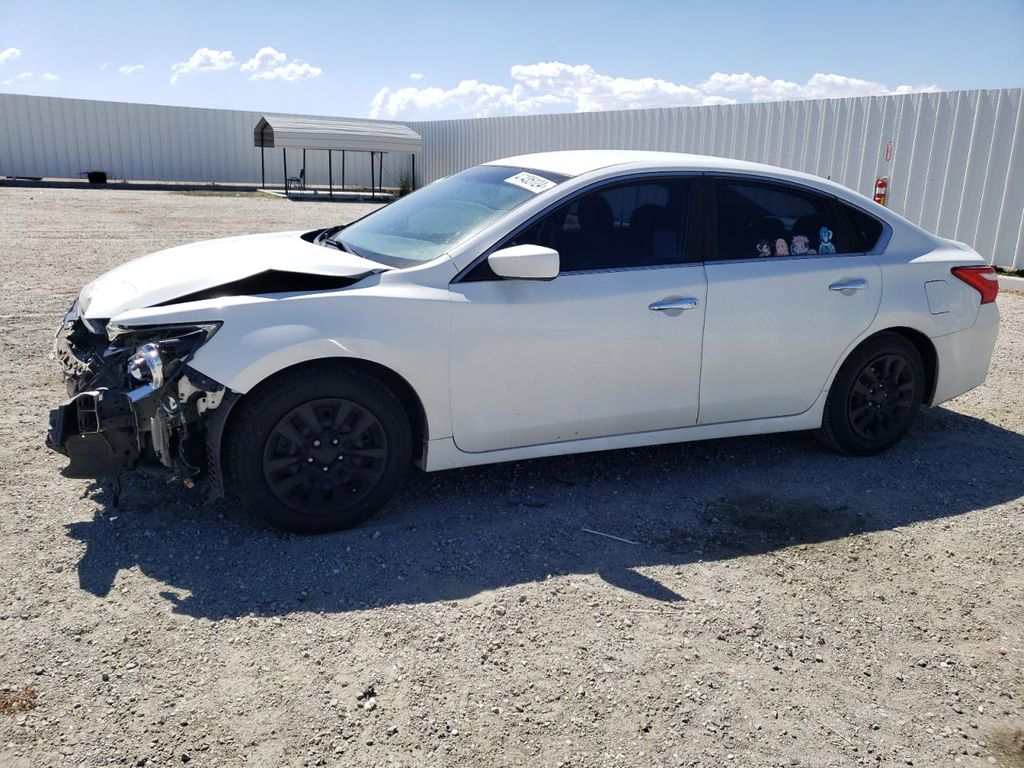
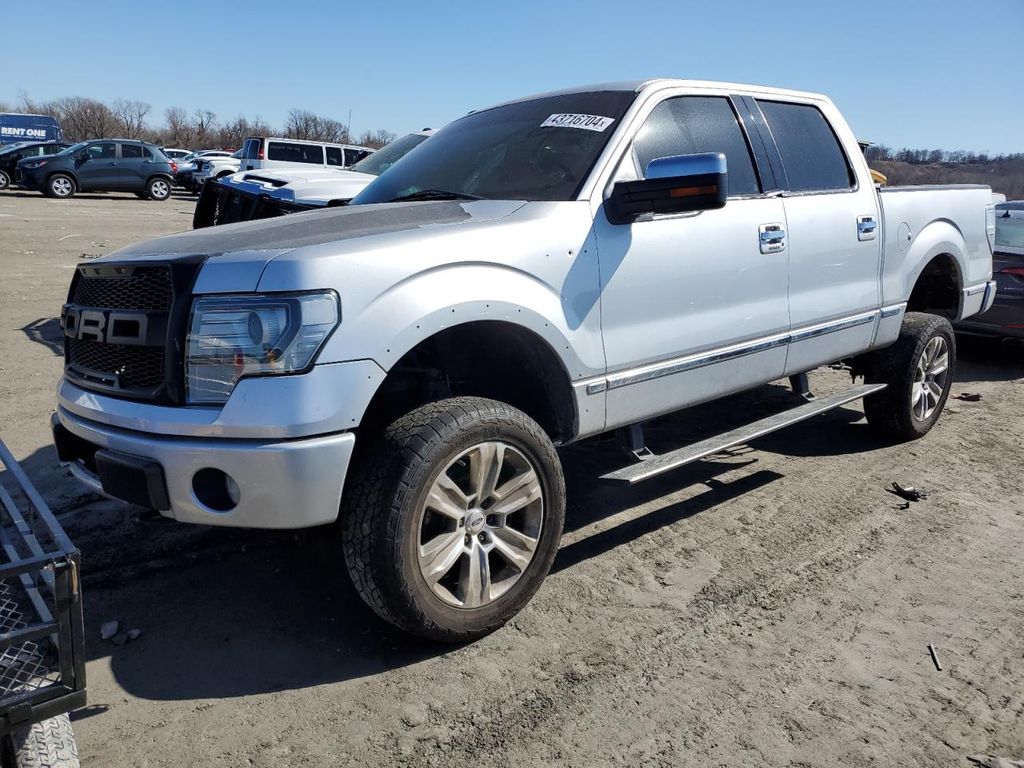
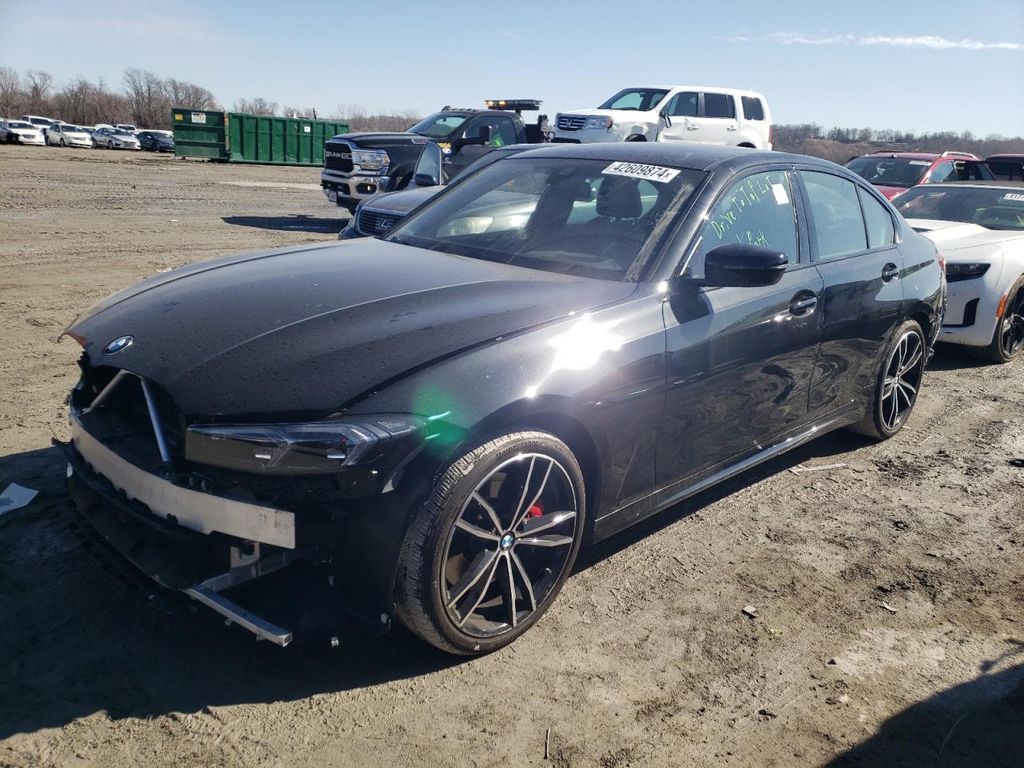
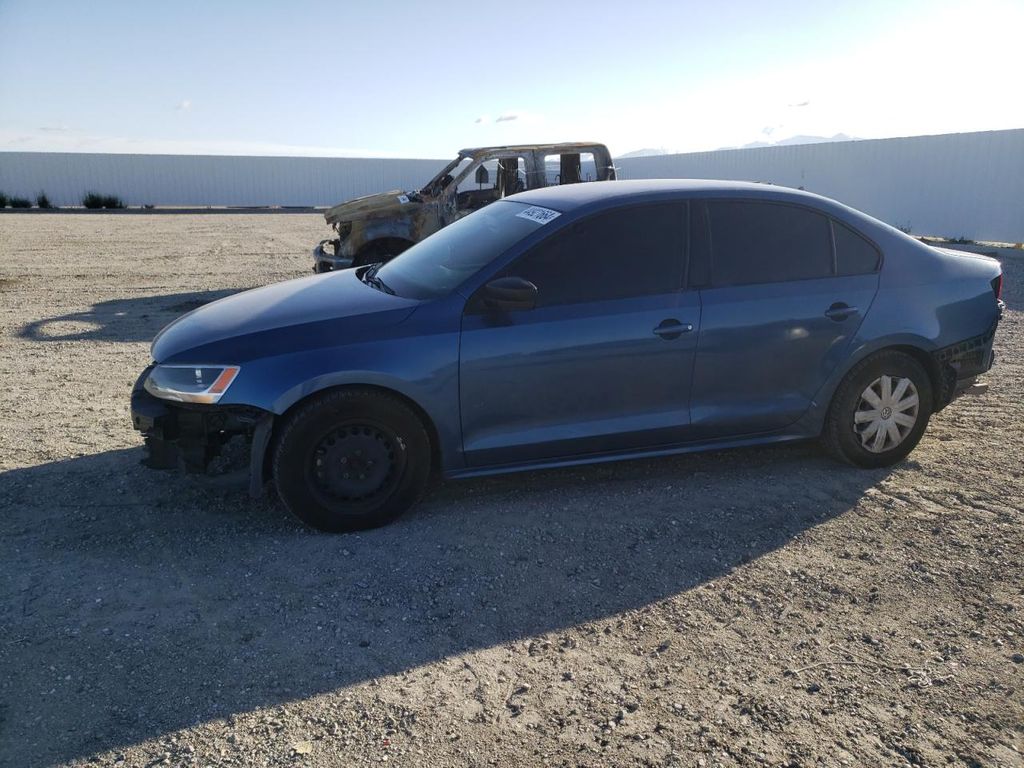
TOTAL LOSS VEHICLE
Collision damage reported
Collision damage reported
2022-05-23
2 years ago
9,345 mi
Damage reported: minor to moderate damage
Damage to right rear
Damage to rear
Damage to right rear
Damage to rear
2019-02-03
5 years ago
47,610 mi
Vehicle serviced
Maintenance inspection completed
Maintenance inspection completed
Sale Record
2013 FORD FUSION TITANIUM
sold
| Year | 2013 |
| ODO | — |
| Location | SOUTHERN ILLINOIS, IL |
| Date | ended 2 years ago |
| Sale Website Type | salvage or insurance auction |
sale information provided by user #1004232


All photos above are REAL and display ACTUAL car. After you get the report you will see full resolution photos.
Tech Specs
Model Analytics & Market Report
We've analyzed more than 75,300 sales records of this model and here are some numbers.
The average price for new (MSRP) 2013 FORD FUSION in 2013 was $26,590.
The average price for used 2013 FORD FUSION nowadays in 2024 is $9,220 which is 35% from the original price.
Estimated mileage driven per year is 11,273 miles.
For this model we also have depreciation curve, photos, list of features and options, and other analytics.
Take a look at 2013 FORD FUSION model page in BADVIN vehicles catalog.
Depreciation
The graph below is a depreciation curve for 2013 FORD FUSION. It shows how much this model looses per year in price. This analytics is calculated using sales records from BADVIN database.
The table below shows average price for used 2013 FORD FUSION in each year since the year of manufacturing, current year price and projected price in the future years.
You can scroll the table horizontally to see all columns.
| Year | Average Mileage | Average Price | % Left | % Lost | ||
|---|---|---|---|---|---|---|
| 2013 MSRP | 0 mi | $26,590 | — | — | 100% | 0% |
| 2017 | 56,365 mi | $18,649 | +$0 | +0% | 70.14% | 29.86% |
| → Visit 2013 FORD FUSION depreciation page to see full data. | ||||||
Price vs Mileage
The graph below shows how mileage affects the price for 2013 FORD FUSION. This data was calculated using sales records from BADVIN database.
The table below shows average price for used 2013 FORD FUSION by mileage and number of sales.
You can scroll the table horizontally to see all columns.
| Mileage | Average Price | Sample Size |
|---|---|---|
| 15,000 mi | $14,499 | 10 sales |
| 30,000 mi | $13,911 | 23 sales |
| 35,000 mi | $13,450 | 21 sales |
| 40,000 mi | $13,495 | 51 sales |
| 45,000 mi | $13,000 | 53 sales |
| 50,000 mi | $12,999 | 59 sales |
| → Visit 2013 FORD FUSION depreciation page to see full data. | ||
Get FULL ACCESS to the vehicle history report and see all blurred info.
⭐ Read 205+ reviews from our customers who used BADVIN to avoid buying junk vehicles.
Testimonials from our customers
As a used car dealer, I rely on badvin.org for checking every vehicle I'm considering purchasing at auction. The comprehensive reports give me peace of mind and help me avoid problem cars. Photos of past sales have saved me from overpaying many times. Worth every penny!

Misha
verified on Trustpilot
I've tried many vehicle reports but badvin's is by far the most comprehensive. It shows accident photos, past sales, repairs and so much more. I won't buy a car now without getting a report first. It's a must-have.
Alexander Hunt
verified on Trustpilot
I've tried a bunch of different vehicle history reports over the years and badvin.org has been the most comprehensive by far. Stuff like service records, ownership history, lien and repo info that I haven't found elsewhere. Def go-to resource when shopping for used vehicles now.
Levi Johnson
verified on Trustpilot
Can't believe what badvin found on a used 2012 chevy silverado I almost bought - odometer had been rolled back 50k miles according to the mileage history! Carfax didnt show nething bout that. So glad I checked here first b4 handing over my hard earned $$
Jackson
verified on Trustpilot
Compare to other 2013 FORD FUSION

2020 FORD FUSION
in 5 hours, 64,708 mi
est retail value $15,484
buy now price $5,300
VIN 3FA6P0HD2LR165202
2019 FORD FUSION
in 3 days, 36,863 mi
est retail value $17,900
buy now price $11,600
VIN 3FA6P0LU4KR188440
2016 FORD FUSION
in 5 hours, 124,359 mi
est retail value $10,687
buy now price $2,650
VIN 3FA6P0H70GR390637

Other vehicles sales records
Frequently asked questions
The 'country of origin' in a VIN, indicated by the first one to three characters, tells you where the vehicle was built, which could influence parts availability and design standards.
The average depreciation rate for vehicles over five years can vary, but many models experience a significant portion of their depreciation within the first few years of ownership.
Our reports may detail types of accidents involving the 2013 FORD FUSION, such as collision data and impact severity, if available.
Market value is generally estimated based on the 2013 FORD vehicle’s history, condition, and comparable sales, helping to provide a guideline for buyers and sellers, though specific values can vary.
The manufacturing location can be interpreted from the first character of the VIN, which indicates the country of assembly, and sometimes more specific location details are included in the first few characters.
Depreciation, which reflects the decline in a 2013 FORD vehicle's value over time due to factors like age, mileage, and condition, may directly impact its resale value, based on recorded information.
In 2013 FORD vehicles, the part of the VIN that provides information about the engine type is typically one of the middle characters, which varies by manufacturer.
To find the correct VIN, check multiple locations where it is typically displayed, such as the dashboard, driver's door jamb, and vehicle registration documents, ensuring all instances match exactly.
Vehicles that have been flooded may have a specific flood title or watermark in the vehicle history report, indicating significant water damage, if such events are documented.


