
BADVIN vehicle history report for
2012 RAM 3500VIN: 3C63DRGL3CG178823
Get FULL ACCESS to the vehicle history report and see all blurred info.
⭐ Read 206+ reviews from our customers who used BADVIN to avoid buying junk vehicles.
Historical Records
events
Photos
1 images
Sales History
1 records
Sale Prices
1 records
Market report
Price analytics
Historical Records
Historical records may include service and maintenance records, title status (clean, junk, salvage), insurance records, number of owners, registration events and states, and other information.
You can find more information about historical records in BADVIN reports and see more examples here.
Available historical records for VIN 3C63DRGL3CG178823
Latest reported mileage: 922 mi
Below you can see some examples of what these records could look like.
2023-08-05
a year ago
33,349 mi
Vehicle serviced
Maintenance inspection completed
Maintenance inspection completed
2022-04-12
2 years ago
22,930 mi
Accident reported: minor damage with another motor vehicle
Damage to rear
Damage to rear
2021-08-02
3 years ago
36,901 mi
TOTAL LOSS VEHICLE
Vehicle declared a total loss by an insurance company
Collision damage reported
Vehicle declared a total loss by an insurance company
Collision damage reported
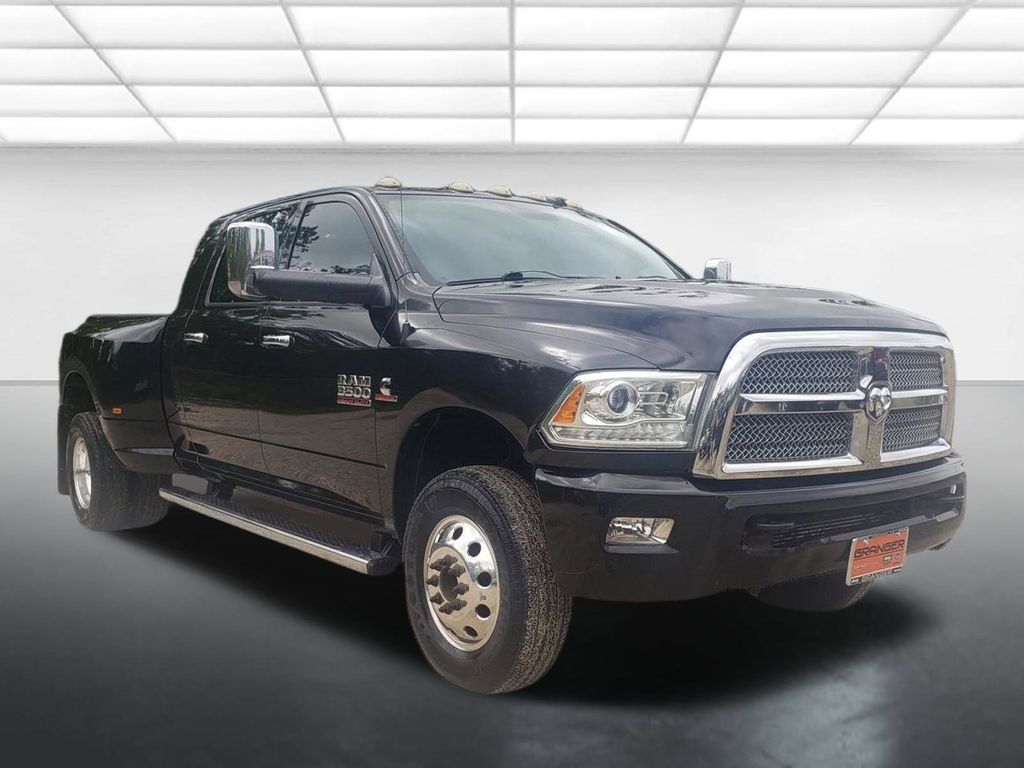
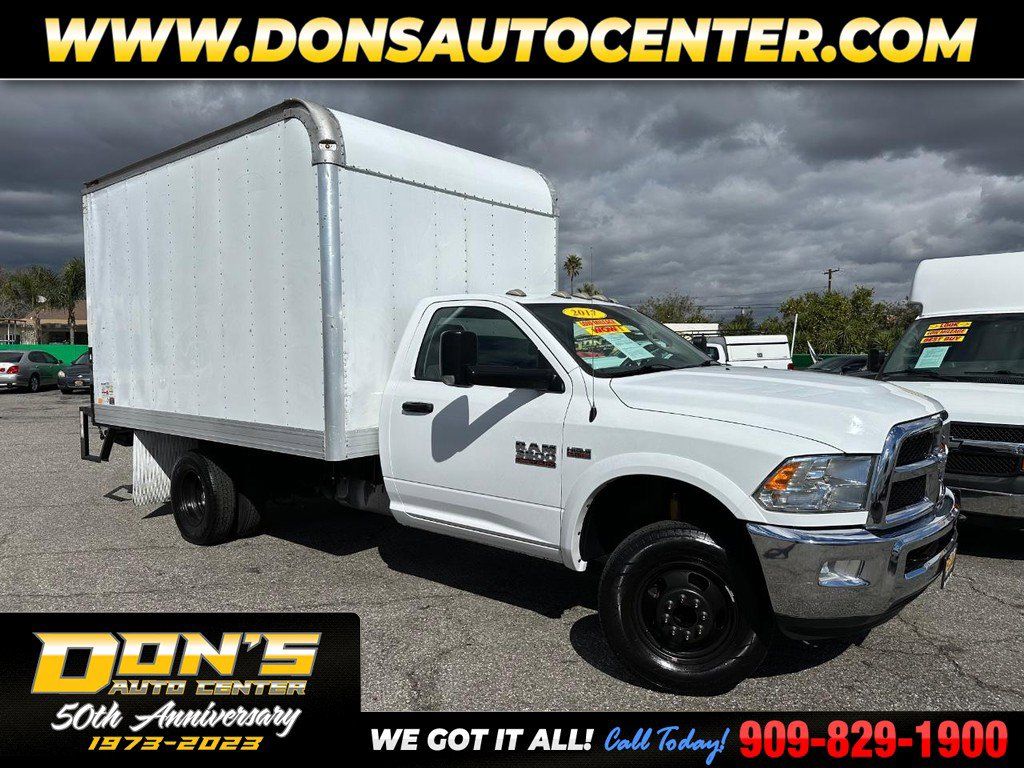
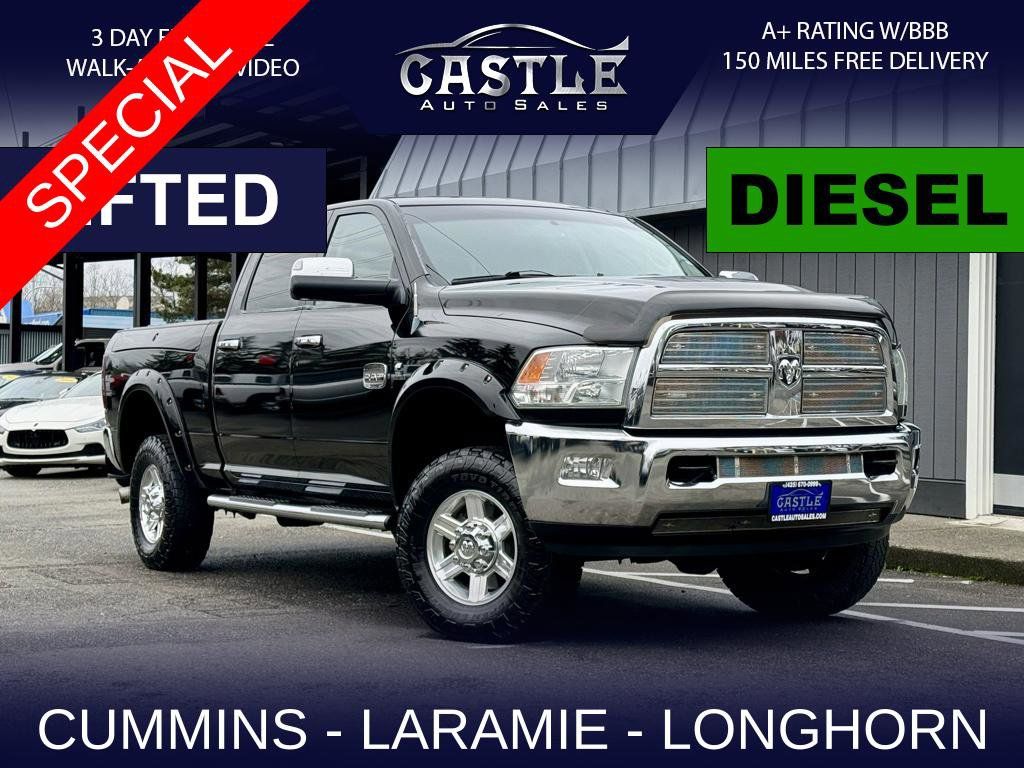
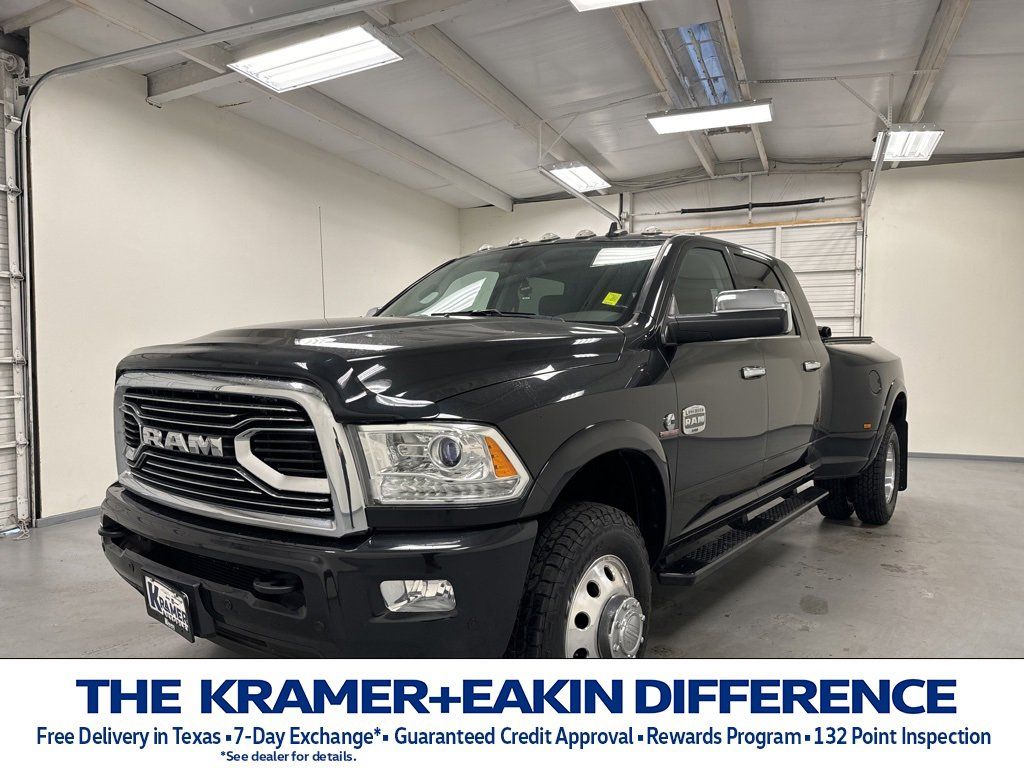
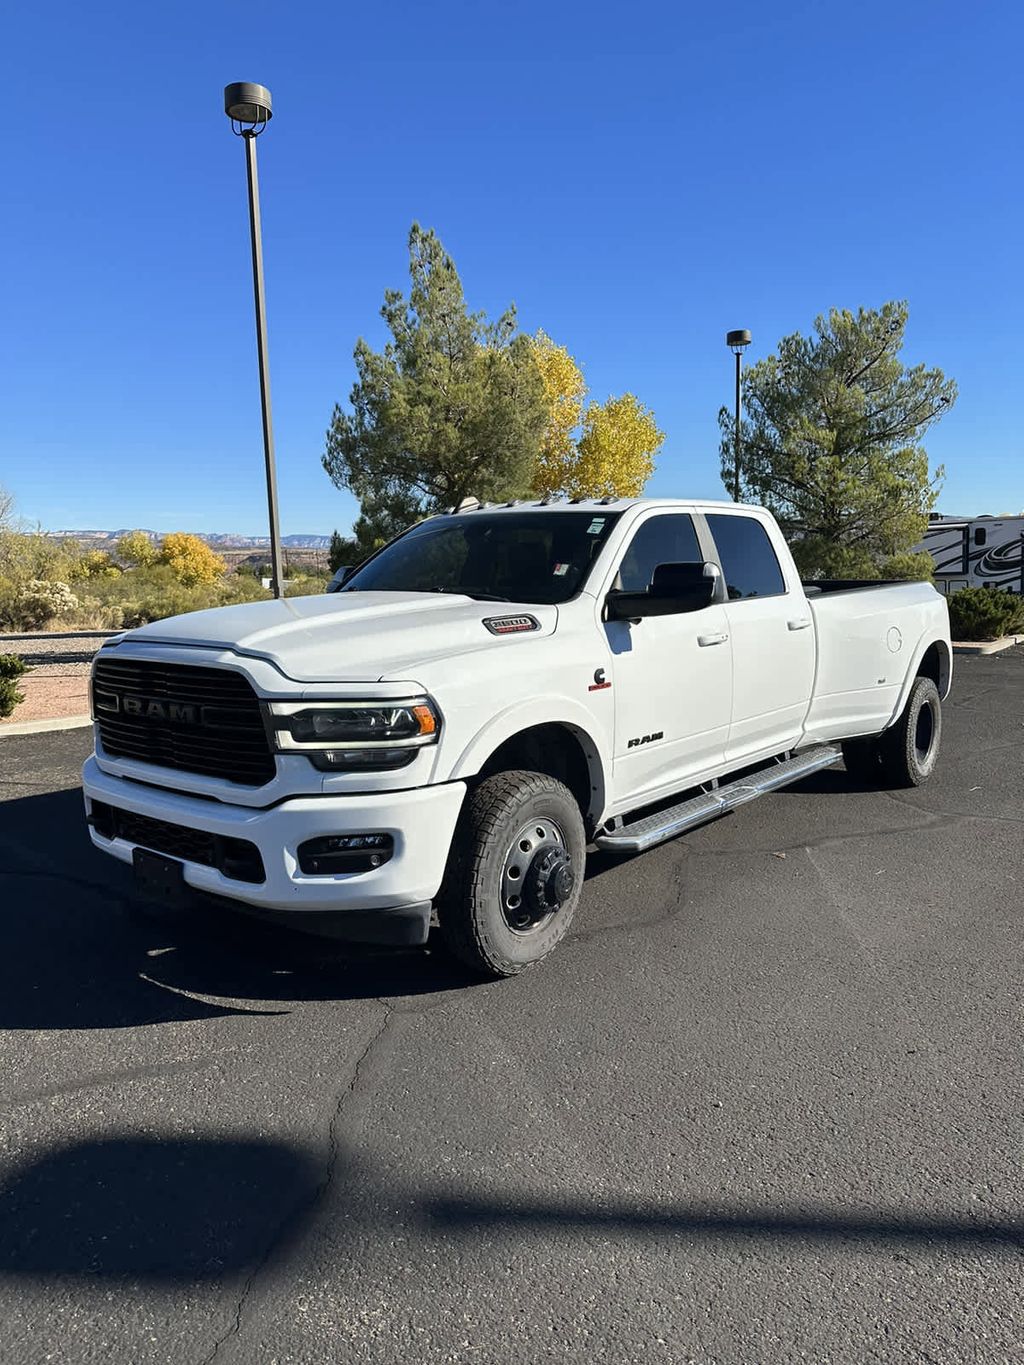
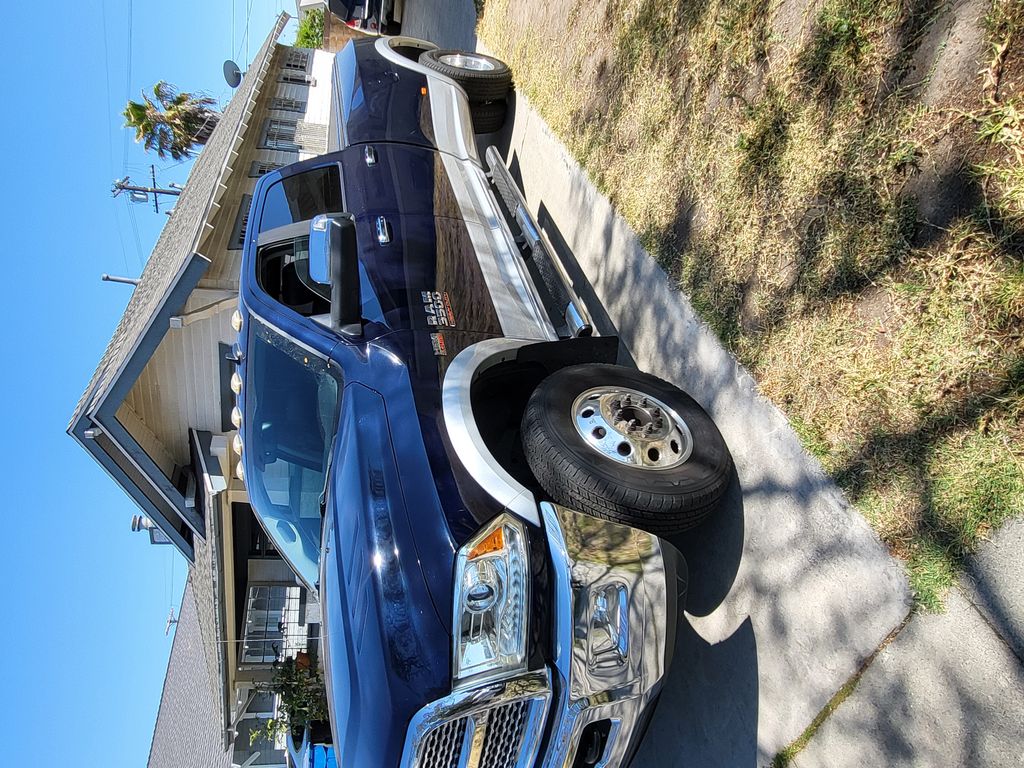
2012 RAM 3500 ST w/ Max Tow Pkg
| Year | 2012 |
| ODO | 5542 mi |
| Seller | Hidden text (Hidden text) |
| Location | Garland, TX, 75041 |
| Date | appeared 2 years ago latest price $6771 sale post disappeared 2019-07-18 |
| Sale Website Type | classifieds |
| Notes | |
| Hidden text | |
sale information provided by user #130250

All photos above are REAL and display ACTUAL car. After you get the report you will see full resolution photos.
Tech Specs
| Color | Silver Exterior |
| Transmission | 6-Speed Automatic Transmission |
| Drive | 4 wheel drive |
Model Analytics & Market Report
We've analyzed more than 21,800 sales records of this model and here are some numbers.
The average price for new (MSRP) 2012 RAM 3500 in 2012 was $74,991.
The average price for used 2012 RAM 3500 nowadays in 2024 is $31,217 which is 42% from the original price.
Estimated mileage driven per year is 15,152 miles.
For this model we also have depreciation curve, photos, list of features and options, and other analytics.
Take a look at 2012 RAM 3500 model page in BADVIN vehicles catalog.
Depreciation
The graph below is a depreciation curve for 2012 RAM 3500. It shows how much this model looses per year in price. This analytics is calculated using sales records from BADVIN database.
The table below shows average price for used 2012 RAM 3500 in each year since the year of manufacturing, current year price and projected price in the future years.
You can scroll the table horizontally to see all columns.
| Year | Average Mileage | Average Price | % Left | % Lost | ||
|---|---|---|---|---|---|---|
| 2012 MSRP | 0 mi | $74,991 | — | — | 100% | 0% |
| 2012 | 15,152 mi | $80,999 | −$6,008 | −8.01% | 108.01% | -8.01% |
| 2013 | 30,304 mi | $72,589 | +$8,410 | +10.38% | 96.8% | 3.2% |
| 2014 | 45,456 mi | $62,000 | +$10,589 | +14.59% | 82.68% | 17.32% |
| 2015 | 60,608 mi | $55,733 | +$6,267 | +10.11% | 74.32% | 25.68% |
| 2016 | 75,760 mi | $57,957 | −$2,224 | −3.99% | 77.29% | 22.71% |
| → Visit 2012 RAM 3500 depreciation page to see full data. | ||||||
Price vs Mileage
The graph below shows how mileage affects the price for 2012 RAM 3500. This data was calculated using sales records from BADVIN database.
The table below shows average price for used 2012 RAM 3500 by mileage and number of sales.
You can scroll the table horizontally to see all columns.
| Mileage | Average Price | Sample Size |
|---|---|---|
| 20,000 mi | $49,578 | 10 sales |
| 25,000 mi | $54,000 | 23 sales |
| 30,000 mi | $49,501 | 25 sales |
| 35,000 mi | $44,596 | 26 sales |
| 40,000 mi | $45,988 | 35 sales |
| 45,000 mi | $48,990 | 62 sales |
| → Visit 2012 RAM 3500 depreciation page to see full data. | ||
Get FULL ACCESS to the vehicle history report and see all blurred info.
⭐ Read 206+ reviews from our customers who used BADVIN to avoid buying junk vehicles.
Testimonials from our customers
I always rely on badvin to check out any used car before I buy. It gives such a complete history, including past accidents, service records, recalls and much more. Feel so much more confident as a used car shopper having this info.

Sofia Garcia
verified on Trustpilot
Was shopping for a used Range Rover and found one that seemed suspiciously cheap. The badVIN report revealed it had been in a major front end collision, with photos showing the damage. Steered clear of that one and saved myself a ton of headaches!!
Ava Patel
verified on Trustpilot
I've tried a bunch of different vehicle history reports over the years and badvin.org has been the most comprehensive by far. Stuff like service records, ownership history, lien and repo info that I haven't found elsewhere. Def go-to resource when shopping for used vehicles now.
Levi Johnson
verified on Trustpilot
Bad Vin's vehicle history report showed that the 2018 Audi A4 I was about to buy had been in a major accident that was not disclosed by the seller. The severity analysis helped me avoid a bad purchase. Great service!
Sophie Dubois
verified on Trustpilot
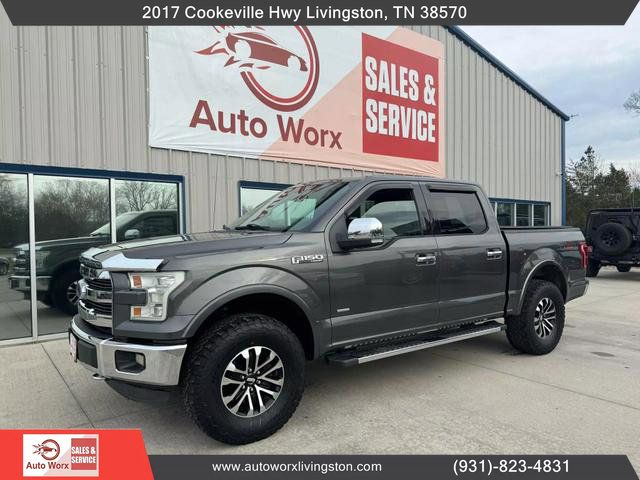
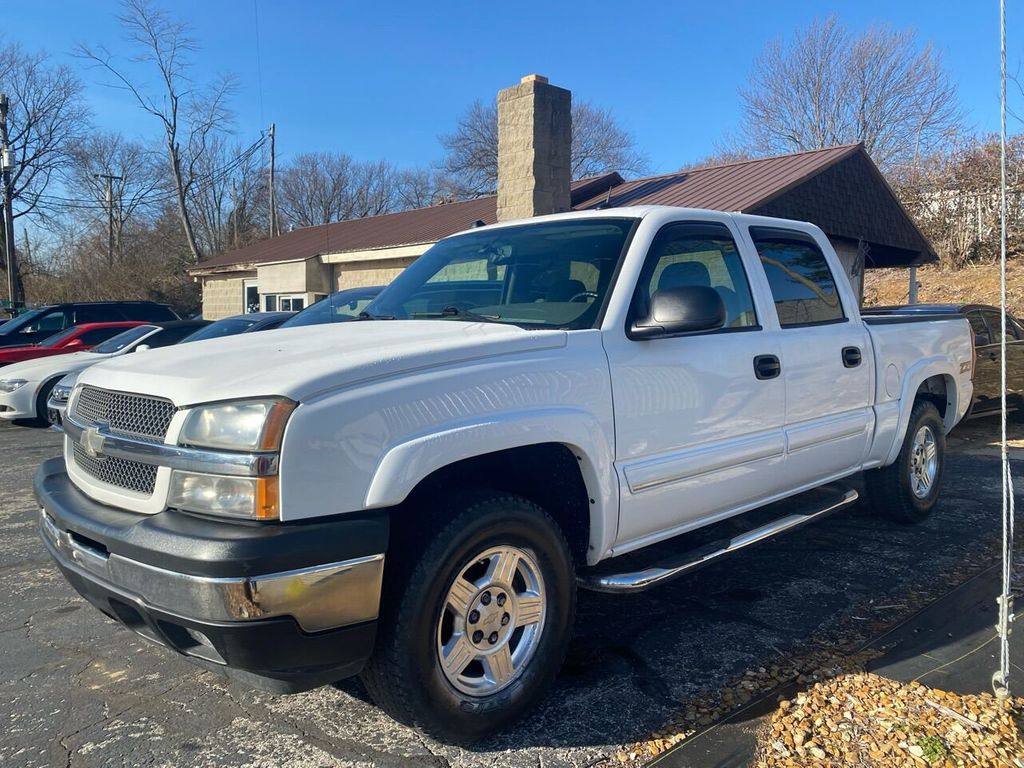
Compare to other 2012 RAM 3500


Other vehicles sales records


Frequently asked questions
Stolen or repossessed status, if recorded, can affect the 2012 RAM vehicle’s legal and financial status, impacting its marketability and insurability.
The 9th character in a VIN is the check digit, which is used to verify the authenticity of the VIN itself through a specific calculation.
Yes, a VIN decoder can often determine if specific safety technologies are equipped on a 2012 RAM 3500 based on the trim and optional equipment codes within the VIN.
You can educate yourself about reading and understanding window stickers by researching online resources, asking questions at dealerships, or consulting automotive buying guides that explain the elements of the label.
A potential buyer can use a VIN decoder to verify the features of a used car by confirming the model, trim level, and installed options, ensuring the features match those advertised.
The Monroney label helps you understand the added features on a 2012 RAM 3500 by listing optional equipment and packages included in the vehicle, along with their pricing.
Vehicle values are typically derived from leading sources and might indicate trade-in, retail, and other value ranges, providing a pricing baseline for the 2012 RAM 3500, based on available data.
High mileage typically accelerates the depreciation of a vehicle, as it may indicate increased wear and tear and potential future repairs.


