BADVIN vehicle history report for
2017 FORD EDGEVIN: 2FMPK4G9XHBC61517
Get FULL ACCESS to the vehicle history report and see all blurred info.
⭐ Read 206+ reviews from our customers who used BADVIN to avoid buying junk vehicles.
Historical Records
events
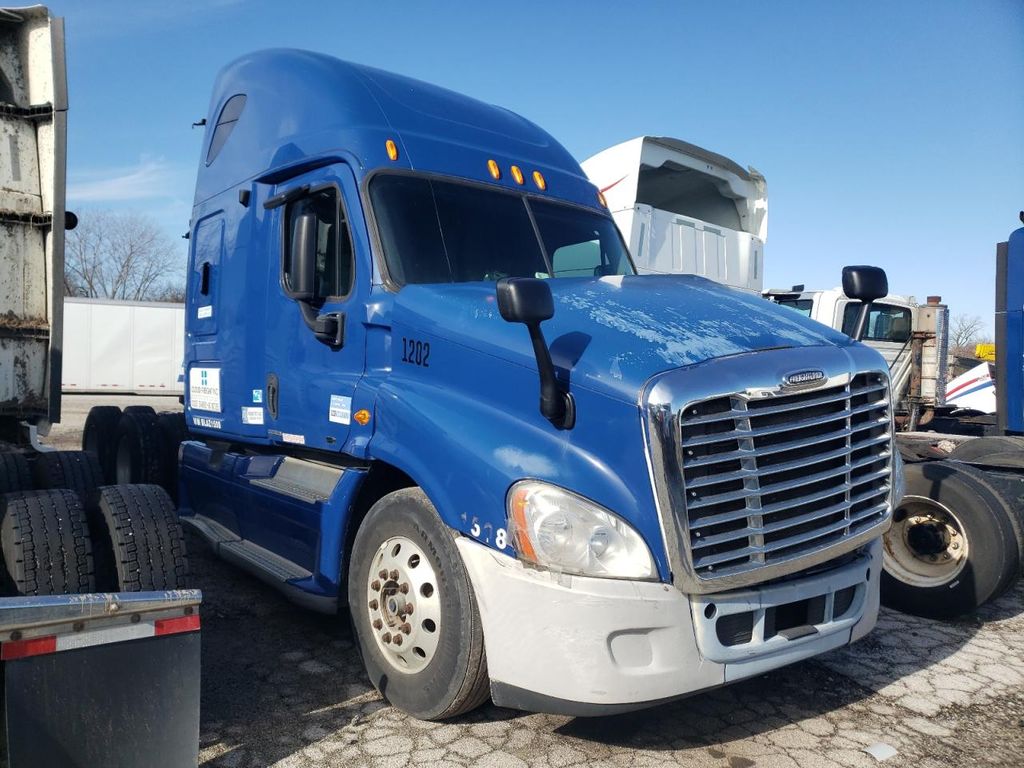
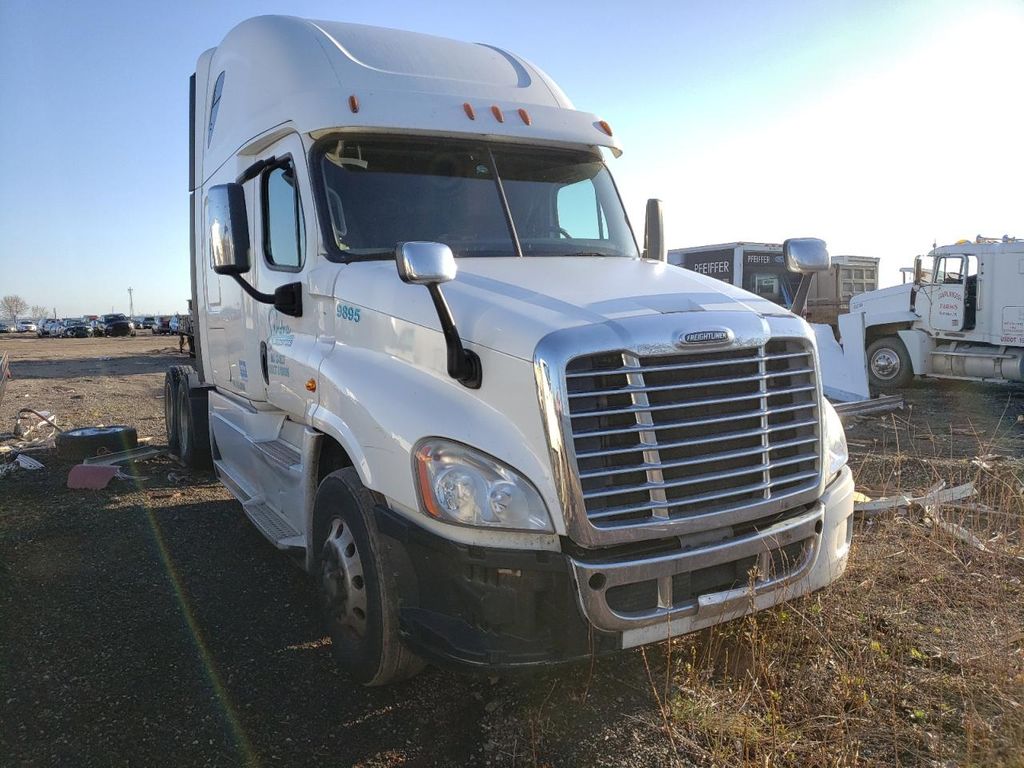
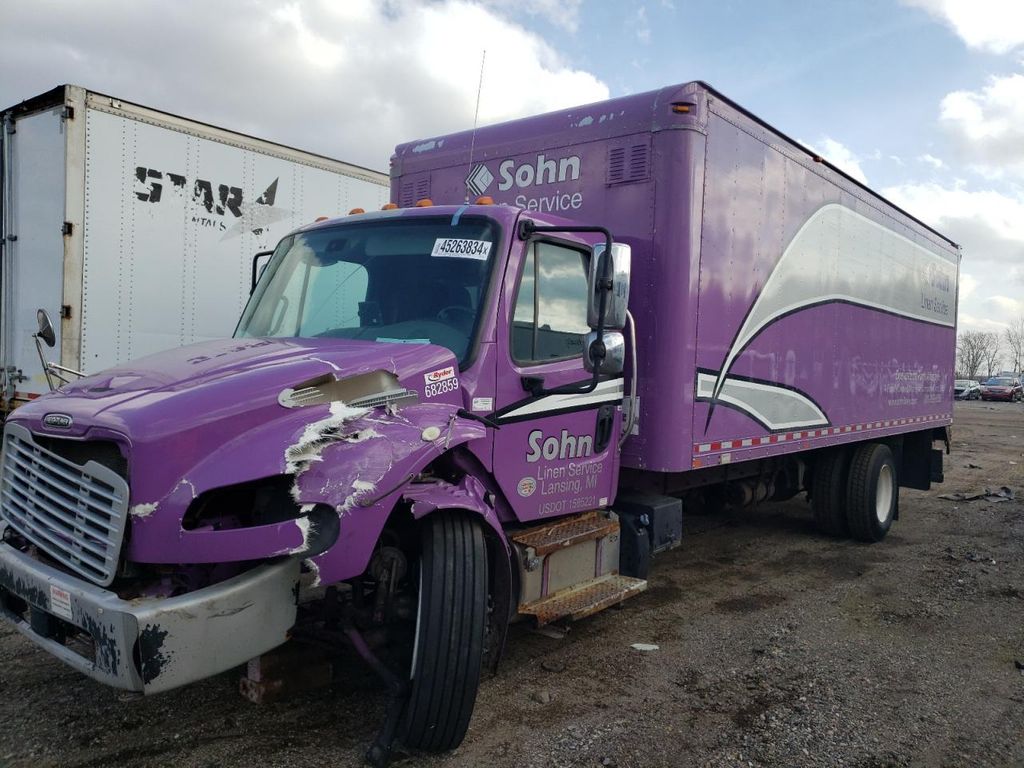
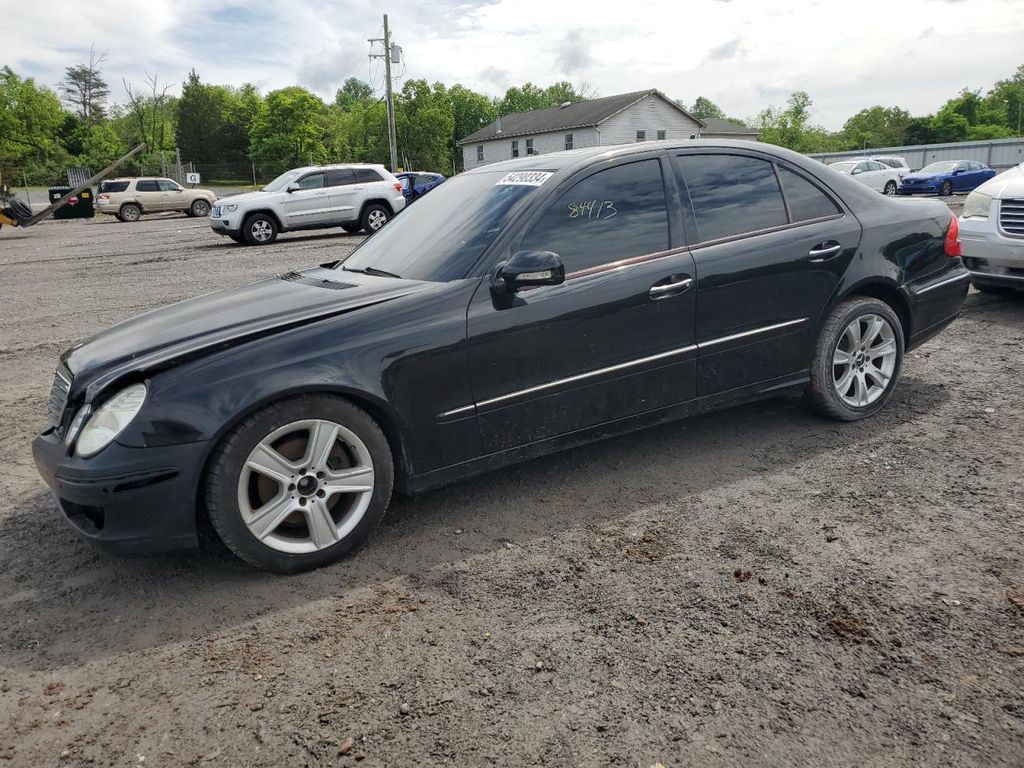
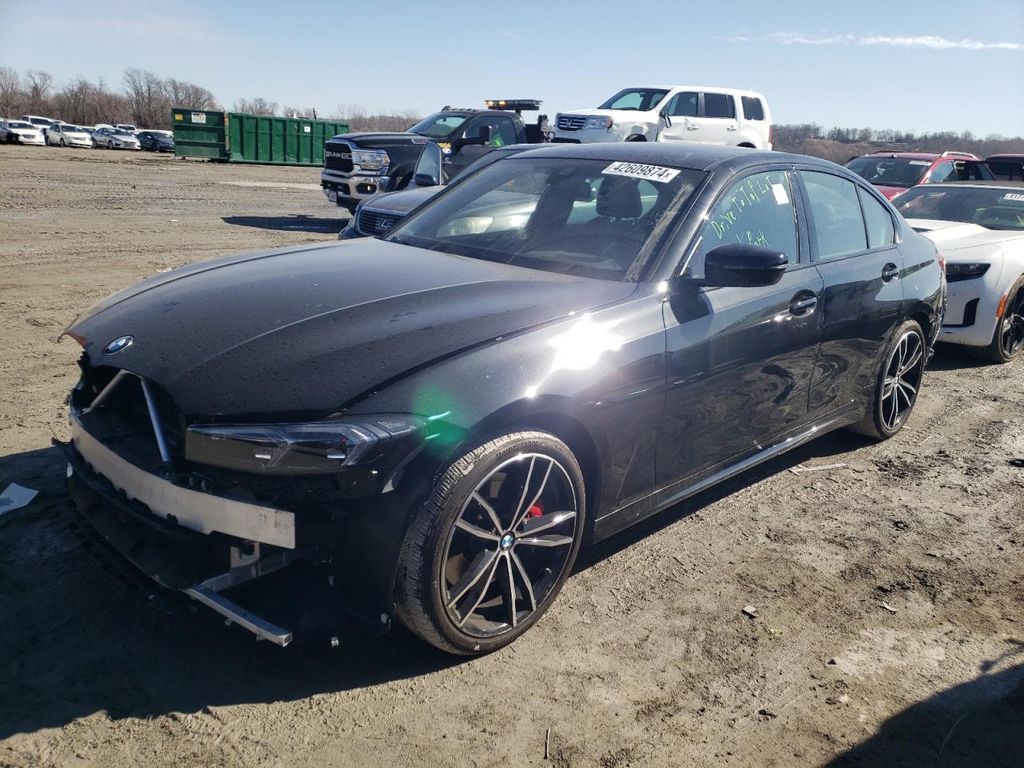
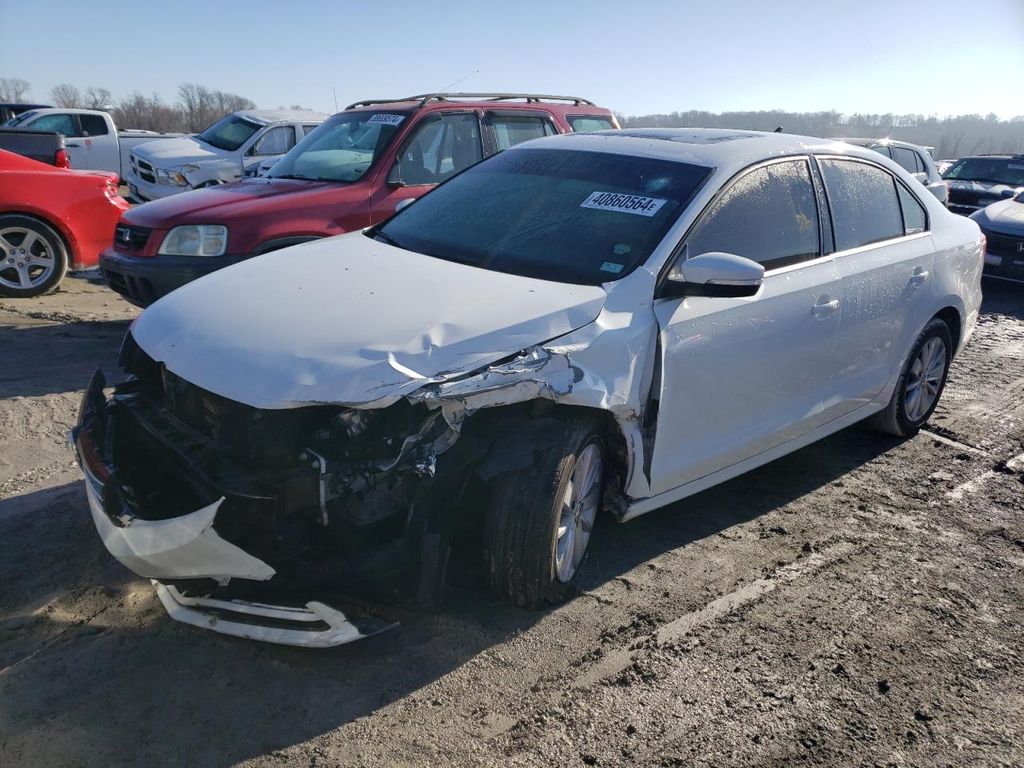
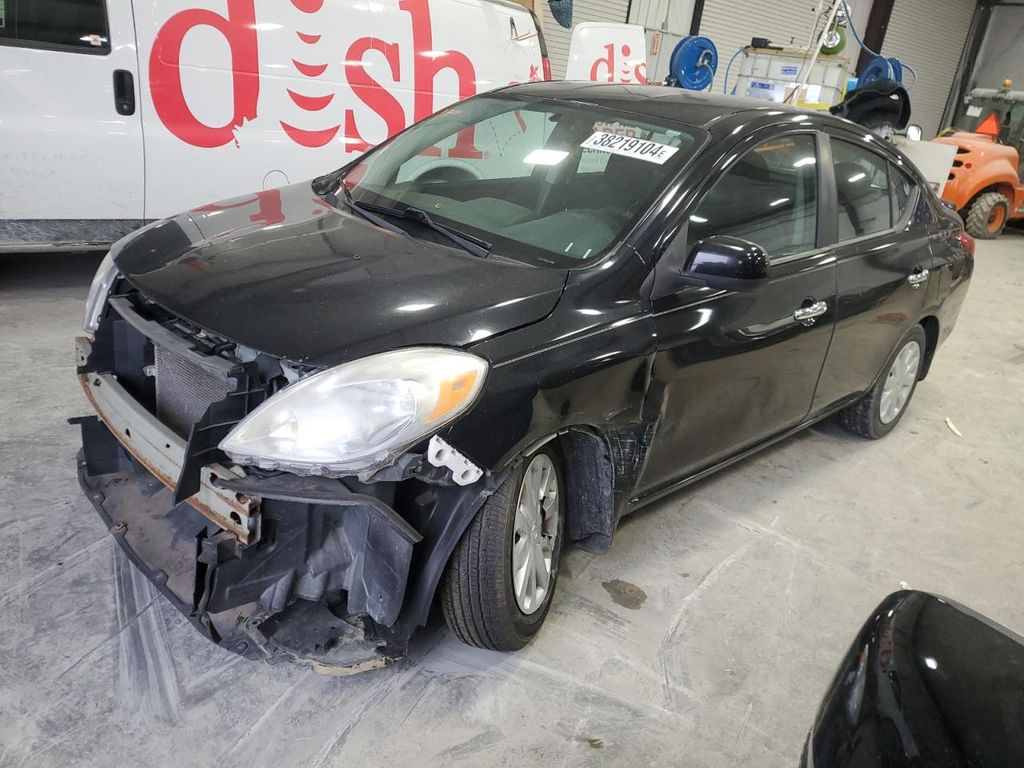
Photos
10 images
Sales History
1 records
Sale Prices
1 records
Market report
Price analytics
Historical Records
Historical records may include service and maintenance records, title status (clean, junk, salvage), insurance records, number of owners, registration events and states, and other information.
You can find more information about historical records in BADVIN reports and see more examples here.
Available historical records for VIN 2FMPK4G9XHBC61517
Latest reported mileage: 690 mi
Below you can see some examples of what these records could look like.
2023-03-24
a year ago
44,680 mi
Odometer reading reported
2021-10-26
3 years ago
14,070 mi
Sold as a BMW Certified Pre-Owned Vehicle
2020-12-11
4 years ago
36,201 mi
Vehicle sold
MILEAGE INCONSISTENCY
MILEAGE INCONSISTENCY
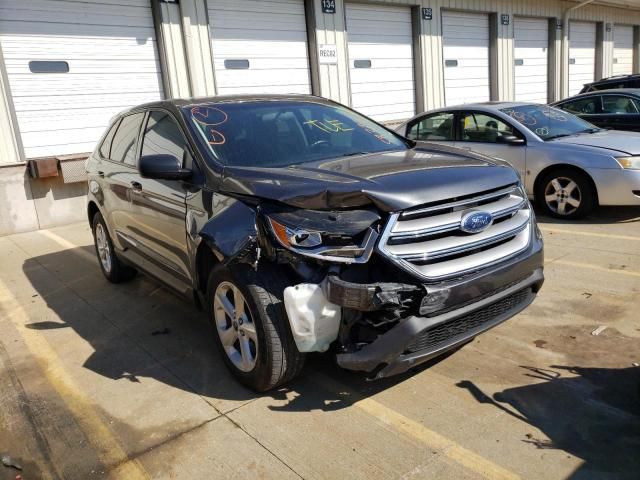
2017 FORD EDGE SE
sold
| Year | 2017 |
| Title | Hidden text (Hidden text) |
| ODO | 4751 mi (Hidden text) |
| Damage | Hidden text |
| Estimated Retail Value | $1534 |
| Estimated Repair Cost | $5561 (692%) |
| Location | Louisville, KY, 40206 |
| Date | ended 2 years ago |
| Sale Website Type | salvage or insurance auction |
sale information provided by user #553676


All photos above are REAL and display ACTUAL car. After you get the report you will see full resolution photos.
Tech Specs
| Color | GRAY |
| Transmission | AUTOMATIC |
| Engine | 2.0L 4 |
| Drive | All wheel drive |
| Fuel Type | GAS |
Model Analytics & Market Report
We've analyzed more than 106,800 sales records of this model and here are some numbers.
The average price for new (MSRP) 2017 FORD EDGE in 2017 was $39,485.
The average price for used 2017 FORD EDGE nowadays in 2024 is $16,500 which is 42% from the original price.
Estimated mileage driven per year is 11,664 miles.
For this model we also have depreciation curve, photos, list of features and options, and other analytics.
Take a look at 2017 FORD EDGE model page in BADVIN vehicles catalog.
Depreciation
The graph below is a depreciation curve for 2017 FORD EDGE. It shows how much this model looses per year in price. This analytics is calculated using sales records from BADVIN database.
The table below shows average price for used 2017 FORD EDGE in each year since the year of manufacturing, current year price and projected price in the future years.
You can scroll the table horizontally to see all columns.
| Year | Average Mileage | Average Price | % Left | % Lost | ||
|---|---|---|---|---|---|---|
| 2017 MSRP | 0 mi | $39,485 | — | — | 100% | 0% |
| 2017 | 11,664 mi | $39,434 | +$51 | +0.13% | 99.87% | 0.13% |
| 2018 | 23,328 mi | $31,500 | +$7,934 | +20.12% | 79.78% | 20.22% |
| 2019 | 34,992 mi | $26,995 | +$4,505 | +14.3% | 68.37% | 31.63% |
| 2020 | 46,656 mi | $25,998 | +$997 | +3.69% | 65.84% | 34.16% |
| 2021 | 58,320 mi | $23,558 | +$2,440 | +9.39% | 59.66% | 40.34% |
| → Visit 2017 FORD EDGE depreciation page to see full data. | ||||||
Price vs Mileage
The graph below shows how mileage affects the price for 2017 FORD EDGE. This data was calculated using sales records from BADVIN database.
The table below shows average price for used 2017 FORD EDGE by mileage and number of sales.
You can scroll the table horizontally to see all columns.
| Mileage | Average Price | Sample Size |
|---|---|---|
| 15,000 mi | $23,407 | 14 sales |
| 20,000 mi | $21,987 | 49 sales |
| 25,000 mi | $21,250 | 52 sales |
| 30,000 mi | $20,992 | 78 sales |
| 35,000 mi | $20,395 | 91 sales |
| 40,000 mi | $20,598 | 185 sales |
| → Visit 2017 FORD EDGE depreciation page to see full data. | ||
Get FULL ACCESS to the vehicle history report and see all blurred info.
⭐ Read 206+ reviews from our customers who used BADVIN to avoid buying junk vehicles.
Testimonials from our customers
As a used car dealer, I rely on badvin.org for checking every vehicle I'm considering purchasing at auction. The comprehensive reports give me peace of mind and help me avoid problem cars. Photos of past sales have saved me from overpaying many times. Worth every penny!

Misha
verified on Trustpilot
I've tried many vehicle reports but badvin's is by far the most comprehensive. It shows accident photos, past sales, repairs and so much more. I won't buy a car now without getting a report first. It's a must-have.
Alexander Hunt
verified on Trustpilot
I buy rebuilt title cars at copart to fix and resell. was hoping BadVin reports wud have more detail on damage history to help me value cars before bidding, Carfax is better for that. but for clean title vehicles it seems pretty useful
Fatima
verified on Trustpilot
After a bad experience buying a used car that turned out to have major issues, I now use Bad VIN to thoroughly check every vehicle i consider. It costs a bit more than other services but the detailed records and photos of past sales are wotrh it for the added peace of mind.
Olivia Johnson
verified on Trustpilot
Compare to other 2017 FORD EDGE


2012 FORD EDGE
a month ago, 103,435 mi
est retail value $10,926
buy now price $1,750
VIN 2FMDK4KC7CBA12400


2013 FORD EDGE
22 days ago, 84,883 mi
est retail value $12,385
buy now price $1,300
VIN 2FMDK3JC4DBB94344


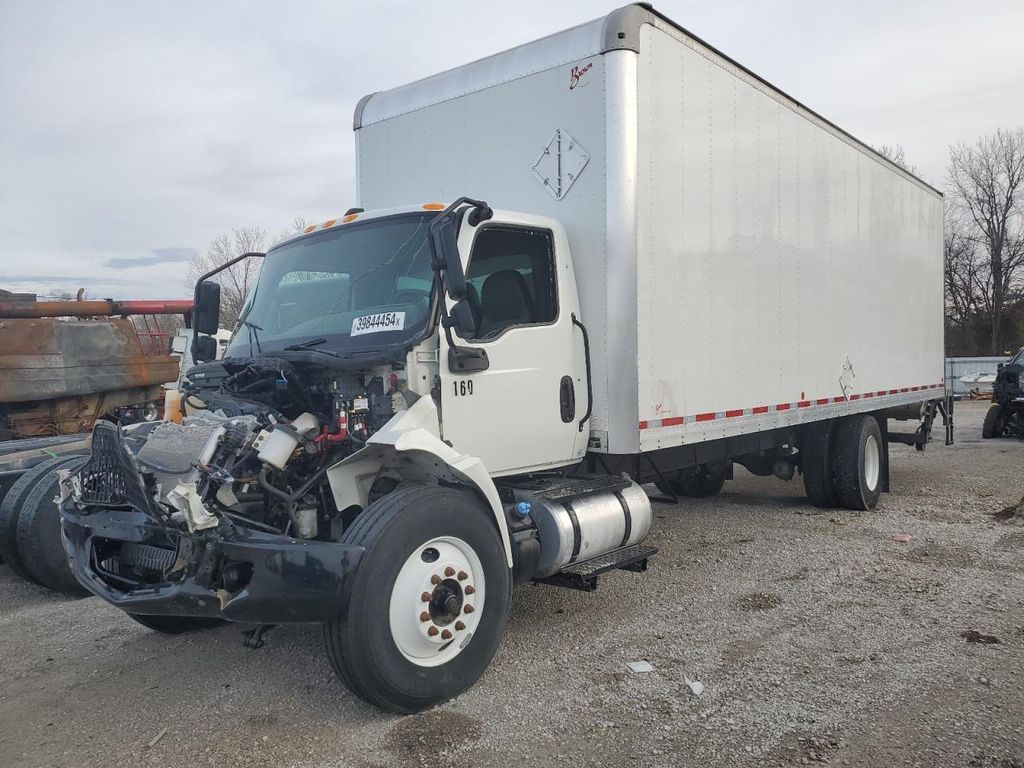
Other vehicles sales records
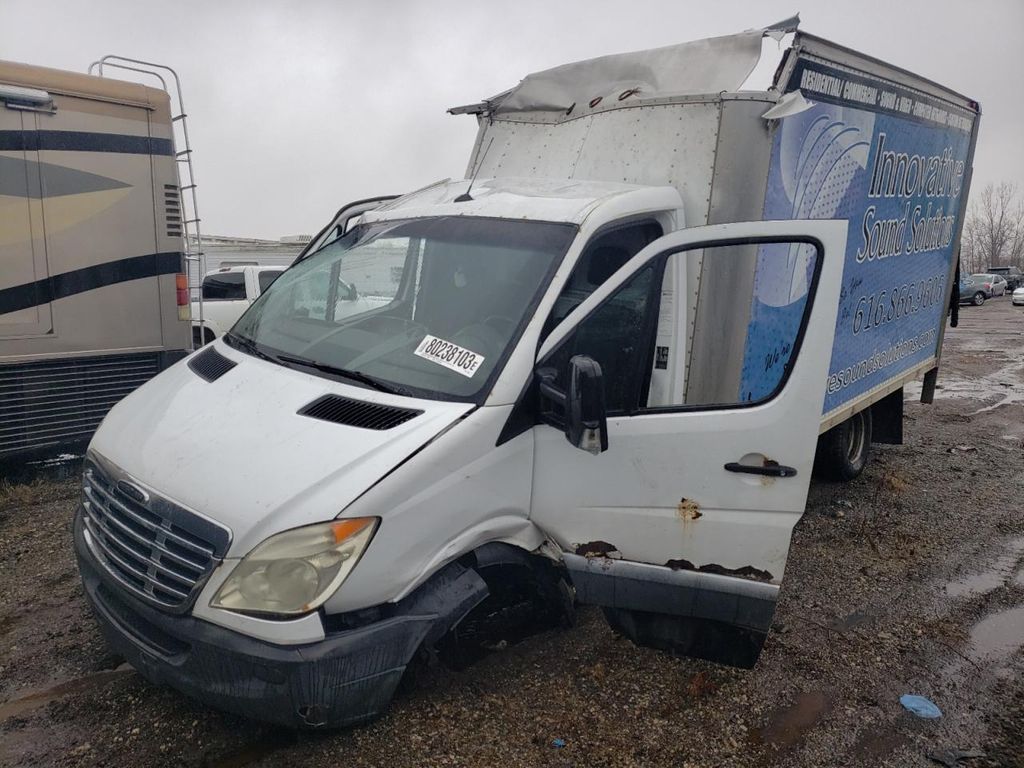
2011 FREIGHTLINER ALL OTHER
in 3 days, 668,674 mi
est retail value $26,875
buy now price $3,950
VIN 1FUJGLDR6BLAZ1508


2021 IC CORPORATION 3000 CE
in 3 days,
est retail value $77,500
buy now price $6,875
VIN 4DRBUC8P4MB273836
Frequently asked questions
Yes, in many cases, you can determine the type of drivetrain a 2017 FORD EDGE has from its VIN if the manufacturer encodes this information within the VIN.
An insurance check can reveal past claims, typically related to accident damage, which might indicate underlying issues not apparent in a physical inspection, if such information is available.
The total price on a Monroney label includes the base price of the vehicle, plus the cost of any optional features, packages, and mandatory fees such as destination charges.
Sales prices from past transactions may be documented in our reports, providing a price history that aids in determining current market value, if such data is available.
Refurbished status, if recorded, is detailed with information on parts replaced and upgrades made, affecting the resale value and reliability of the 2017 FORD.
On average, a new car can depreciate by approximately 23% after the first year, reflecting the premium paid for new technology and immediate depreciation once it's considered used.
A vehicle history report may provide detailed information about a vehicle's past, including ownership, service history, and any significant incidents like accidents or theft, depending on data availability.
Total loss status, if documented, is reported along with the circumstances and damage type, critical for assessing whether the 2017 FORD vehicle has been substantially compromised.
Recall or defect reports, if available, indicate manufacturing flaws needing correction, impacting safety and possibly necessitating urgent repairs for the 2017 FORD.


