
BADVIN vehicle history report for
2019 FORD TRANSIT CONNECTVIN: 1FTYR1ZM3KKA42464
Get FULL ACCESS to the vehicle history report and see all blurred info.
⭐ Read 206+ reviews from our customers who used BADVIN to avoid buying junk vehicles.
Historical Records
events
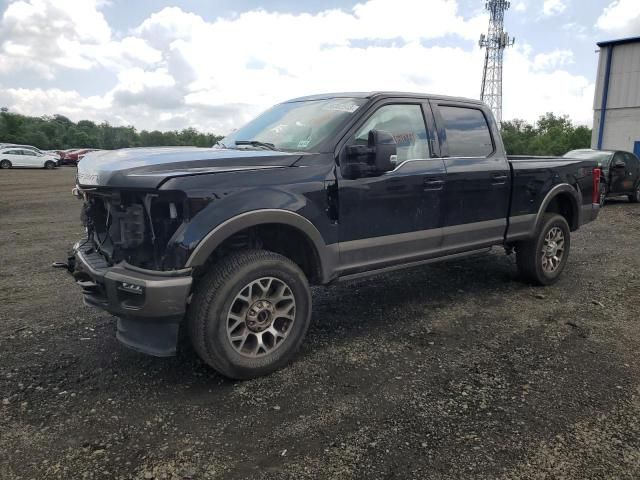
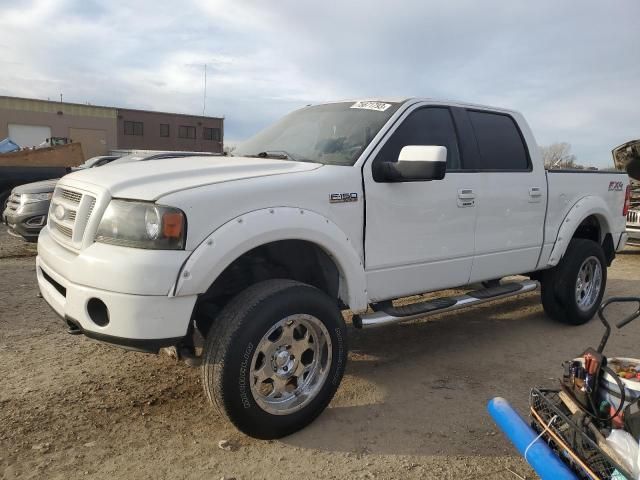
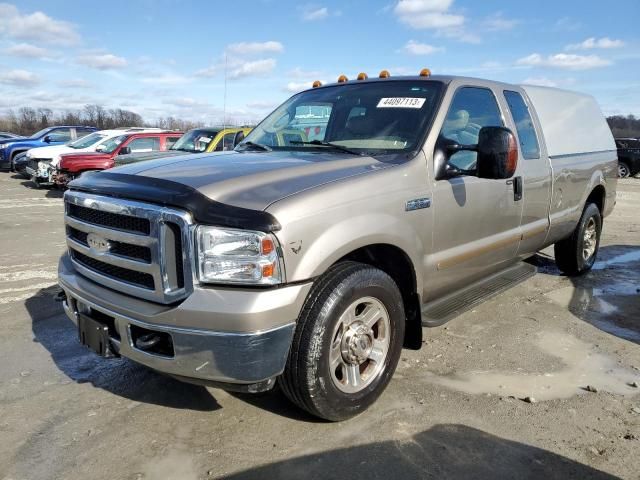
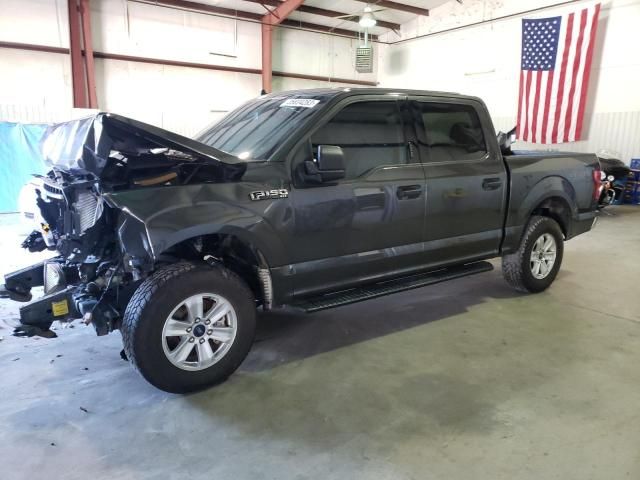
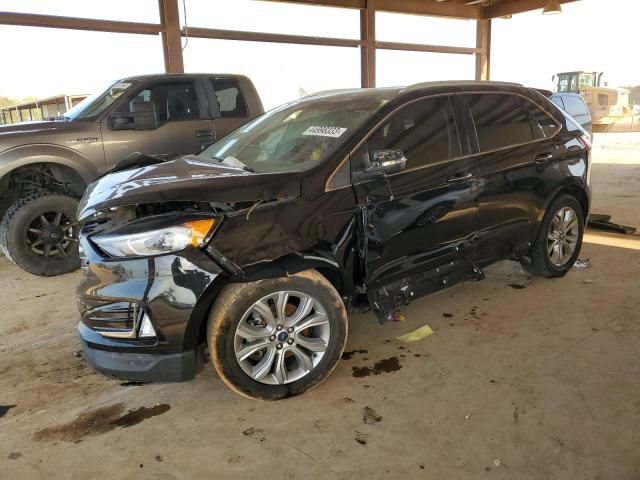
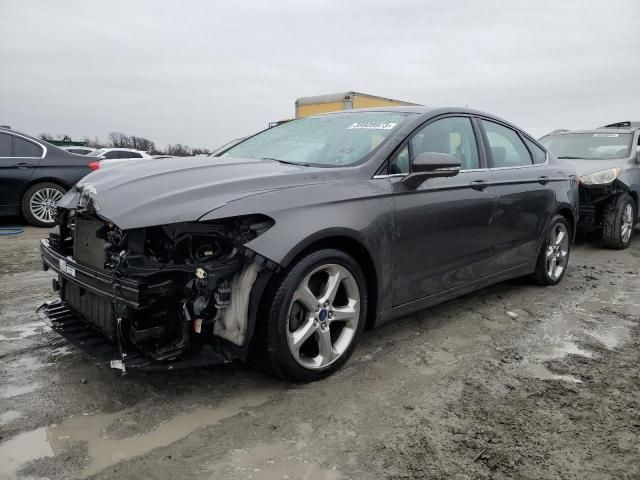
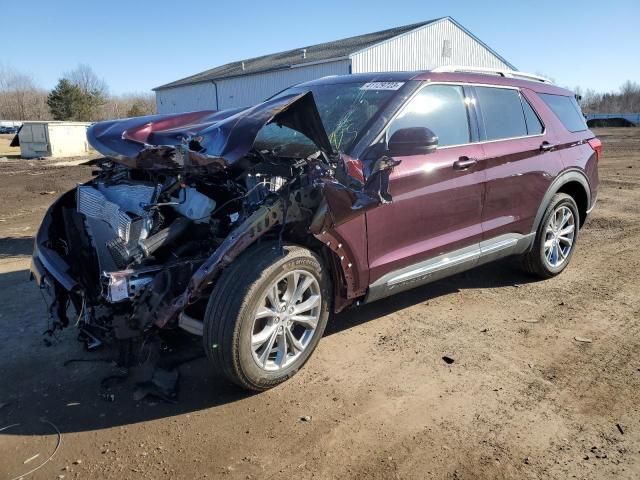
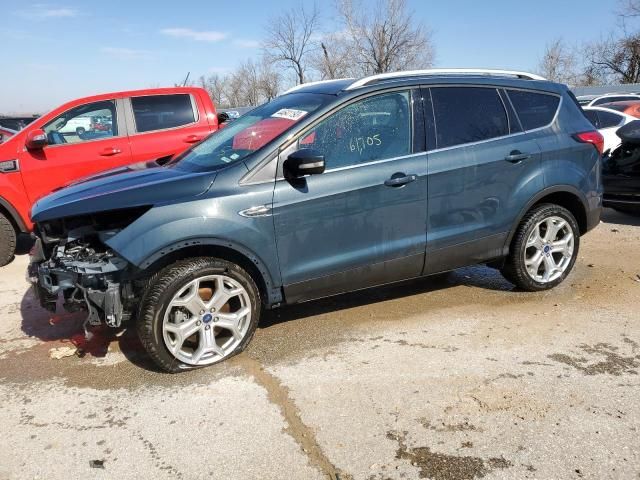
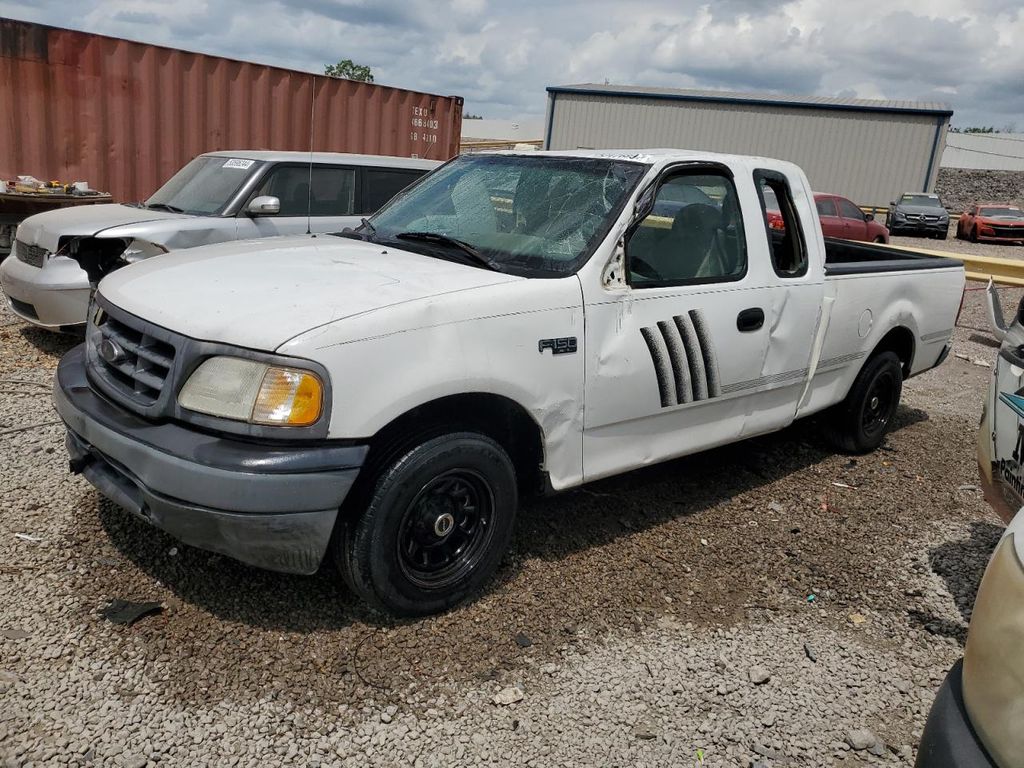
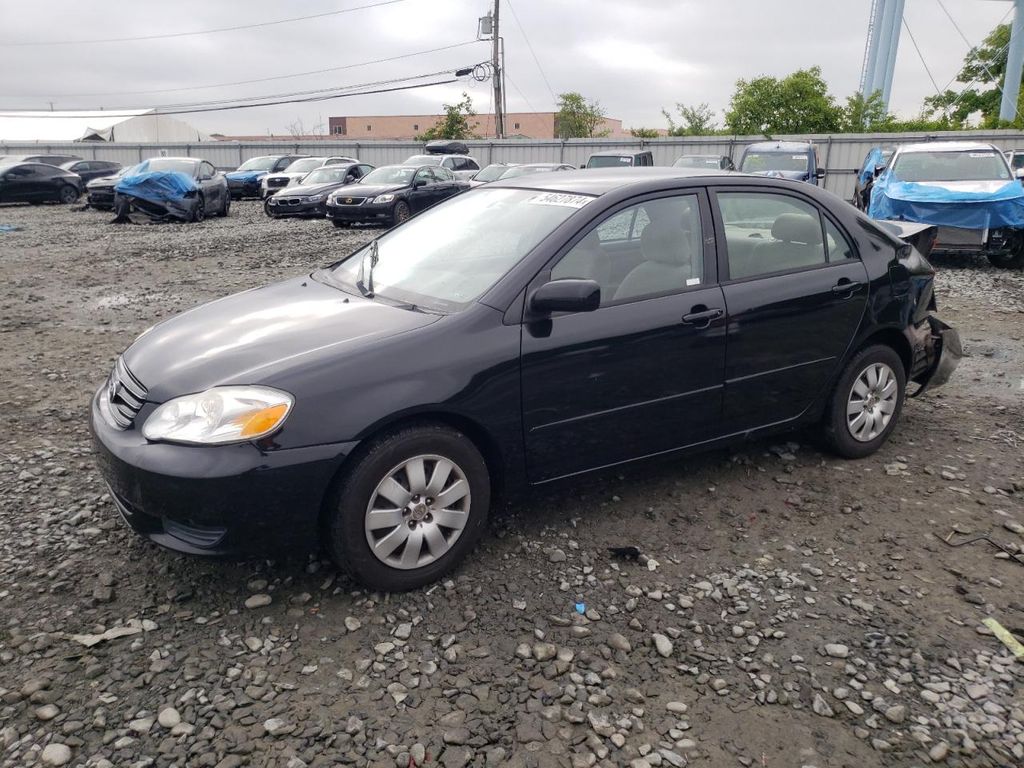
Photos
8 images
Sales History
1 records
Market report
Price analytics
Historical Records
Historical records may include service and maintenance records, title status (clean, junk, salvage), insurance records, number of owners, registration events and states, and other information.
You can find more information about historical records in BADVIN reports and see more examples here.
Available historical records for VIN 1FTYR1ZM3KKA42464
Latest reported mileage: 755 mi
Below you can see some examples of what these records could look like.
2022-09-30
2 years ago
115,703 mi
Vehicle serviced
40,000 mile service performed
40,000 mile service performed
2022-01-11
2 years ago
18,767 mi
Vehicle serviced
Tire repaired
Tire repaired
2019-01-20
5 years ago
46,046 mi
REBUILT TITLE ISSUED
Sale Record
2019 FORD TRANSIT T-250
sold
| Year | 2019 |
| Title | Hidden text (Hidden text) |
| ODO | 8033 mi (Hidden text) |
| Damage | Hidden text, Hidden text |
| Estimated Retail Value | $4310 |
| Estimated Repair Cost | $3923 (695%) |
| Seller | Hidden text |
| Location | Louisville, KY, 40206 |
| Date | ended 3 years ago |
| Sale Website Type | salvage or insurance auction |
sale information provided by user #221917


All photos above are REAL and display ACTUAL car. After you get the report you will see full resolution photos.
Tech Specs
| Color | WHITE |
| Transmission | AUTOMATIC |
| Engine | 3.7L 6 |
| Drive | Rear-wheel drive |
| Fuel Type | FLEXIBLE FUEL |
Model Analytics & Market Report
We've analyzed more than 25,300 sales records of this model and here are some numbers.
The average price for new (MSRP) 2019 FORD TRANSIT CONNECT in 2019 was $33,715.
The average price for used 2019 FORD TRANSIT CONNECT nowadays in 2024 is $18,998 which is 56% from the original price.
Estimated mileage driven per year is 14,714 miles.
For this model we also have depreciation curve, photos, list of features and options, and other analytics.
Take a look at 2019 FORD TRANSIT CONNECT model page in BADVIN vehicles catalog.
Depreciation
The graph below is a depreciation curve for 2019 FORD TRANSIT CONNECT. It shows how much this model looses per year in price. This analytics is calculated using sales records from BADVIN database.
The table below shows average price for used 2019 FORD TRANSIT CONNECT in each year since the year of manufacturing, current year price and projected price in the future years.
You can scroll the table horizontally to see all columns.
| Year | Average Mileage | Average Price | % Left | % Lost | ||
|---|---|---|---|---|---|---|
| 2019 MSRP | 0 mi | $33,715 | — | — | 100% | 0% |
| 2020 | 29,428 mi | $37,248 | +$0 | +0% | 110.48% | -10.48% |
| 2021 | 44,142 mi | $30,495 | +$6,753 | +18.13% | 90.45% | 9.55% |
| 2022 | 58,856 mi | $25,984 | +$4,511 | +14.79% | 77.07% | 22.93% |
| 2023 | 73,570 mi | $21,998 | +$3,986 | +15.34% | 65.25% | 34.75% |
| → Visit 2019 FORD TRANSIT CONNECT depreciation page to see full data. | ||||||
Price vs Mileage
The graph below shows how mileage affects the price for 2019 FORD TRANSIT CONNECT. This data was calculated using sales records from BADVIN database.
The table below shows average price for used 2019 FORD TRANSIT CONNECT by mileage and number of sales.
You can scroll the table horizontally to see all columns.
| Mileage | Average Price | Sample Size |
|---|---|---|
| 5,000 mi | $29,995 | 21 sales |
| 10,000 mi | $29,900 | 20 sales |
| 15,000 mi | $29,490 | 42 sales |
| 20,000 mi | $27,050 | 55 sales |
| 25,000 mi | $24,987 | 59 sales |
| 30,000 mi | $25,900 | 73 sales |
| → Visit 2019 FORD TRANSIT CONNECT depreciation page to see full data. | ||
Get FULL ACCESS to the vehicle history report and see all blurred info.
⭐ Read 206+ reviews from our customers who used BADVIN to avoid buying junk vehicles.
Testimonials from our customers
I've tried a bunch of different vehicle history reports over the years and badvin.org has been the most comprehensive by far. Stuff like service records, ownership history, lien and repo info that I haven't found elsewhere. Def go-to resource when shopping for used vehicles now.

Levi Johnson
verified on Trustpilot
Report showed a car I was considering had a prior salvage title from a major accident, even though carfax listed it as clean. Messaged seller asking about it and they made shady excuses. Def avoided a scam thanks to badvin!
Mia Johnson
verified on Trustpilot
As a used car dealer, I rely on badvin.org for checking every vehicle I'm considering purchasing at auction. The comprehensive reports give me peace of mind and help me avoid problem cars. Photos of past sales have saved me from overpaying many times. Worth every penny!
Misha
verified on Trustpilot
Bad Vin's vehicle history report showed that the 2018 Audi A4 I was about to buy had been in a major accident that was not disclosed by the seller. The severity analysis helped me avoid a bad purchase. Great service!
Sophie Dubois
verified on Trustpilot
Compare to other 2019 FORD TRANSIT CONNECT
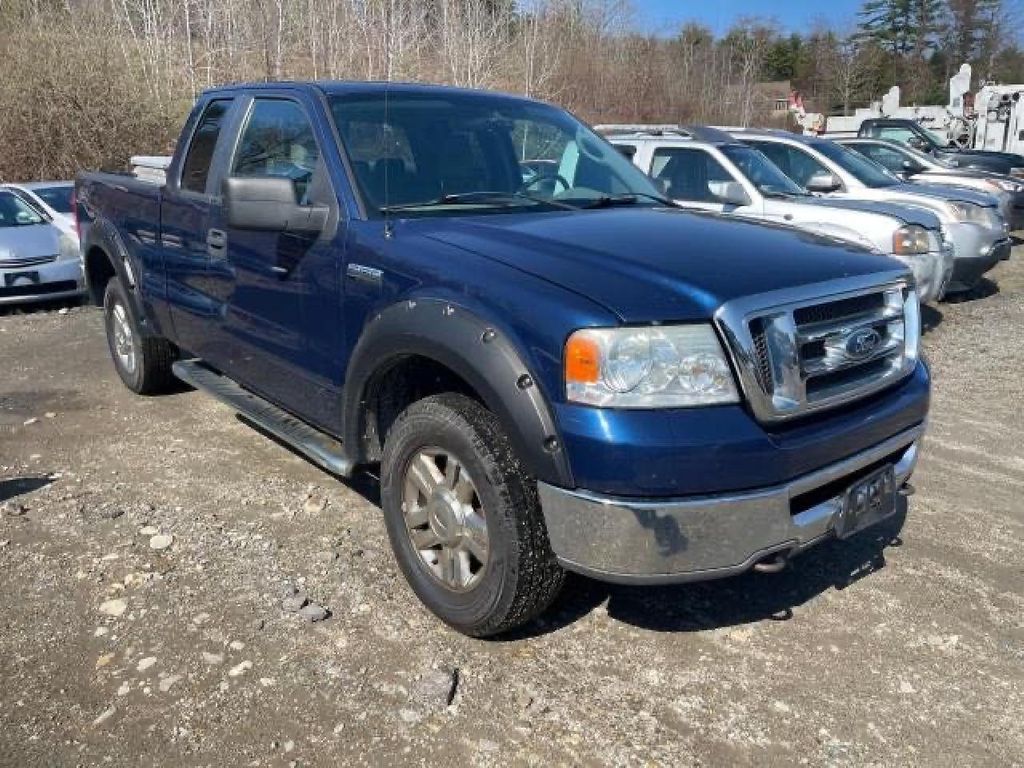
2007 FORD F-150
in 11 days, 119,265 mi
est retail value $13,850
buy now price $5,800
VIN 1FTPW14V77KD22142

2015 FORD FUSION
in a day, 142,393 mi
est retail value $10,528
buy now price $1,400
VIN 1FA6P0HD0F5108598


Other vehicles sales records

2012 FORD F450
6 days ago, 224,953 mi
est retail value $19,340
buy now price $1,600
VIN 1FDUF4HY2CED10705
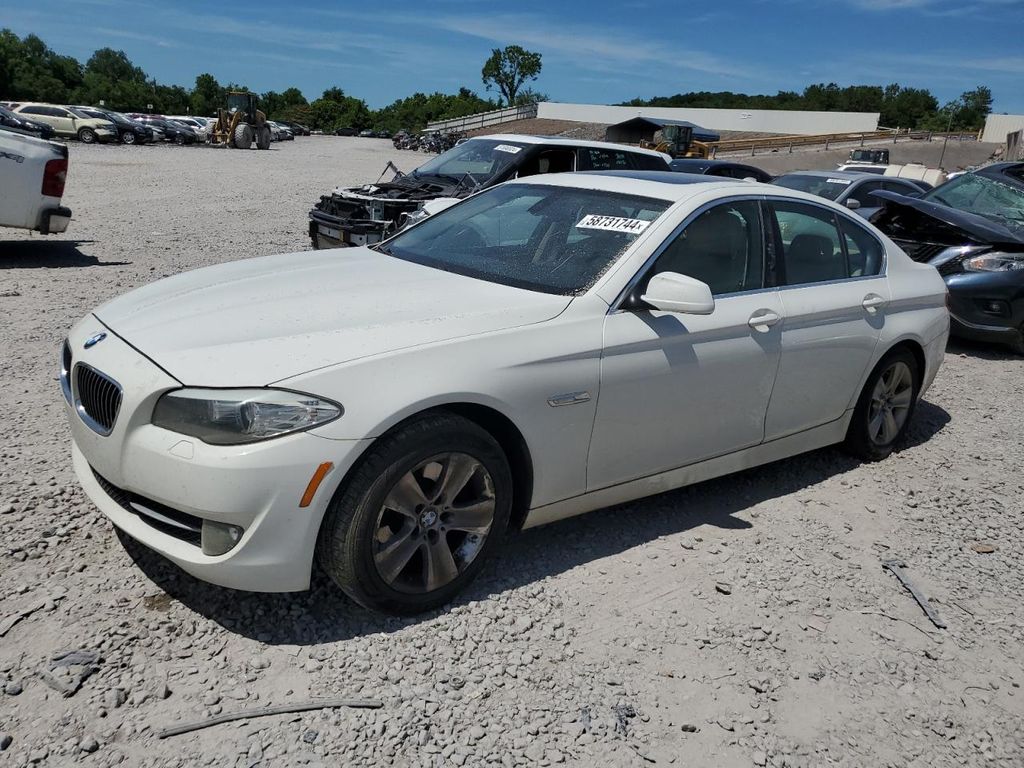
2011 BMW 5 SERIES
in 2 days, 167,942 mi
est retail value $6,600
buy now price $2,181
VIN WBAFR1C56BC739918
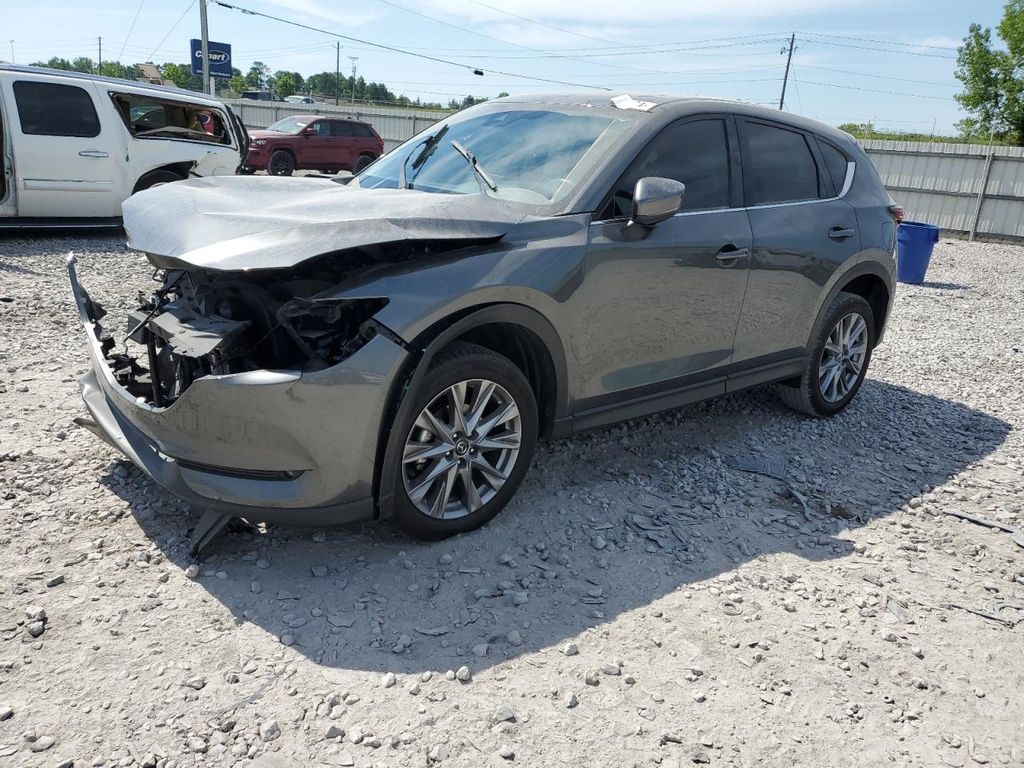
2021 MAZDA CX-5
in 2 days, 50,266 mi
est retail value $22,036
buy now price $4,000
VIN JM3KFADM2M0480596
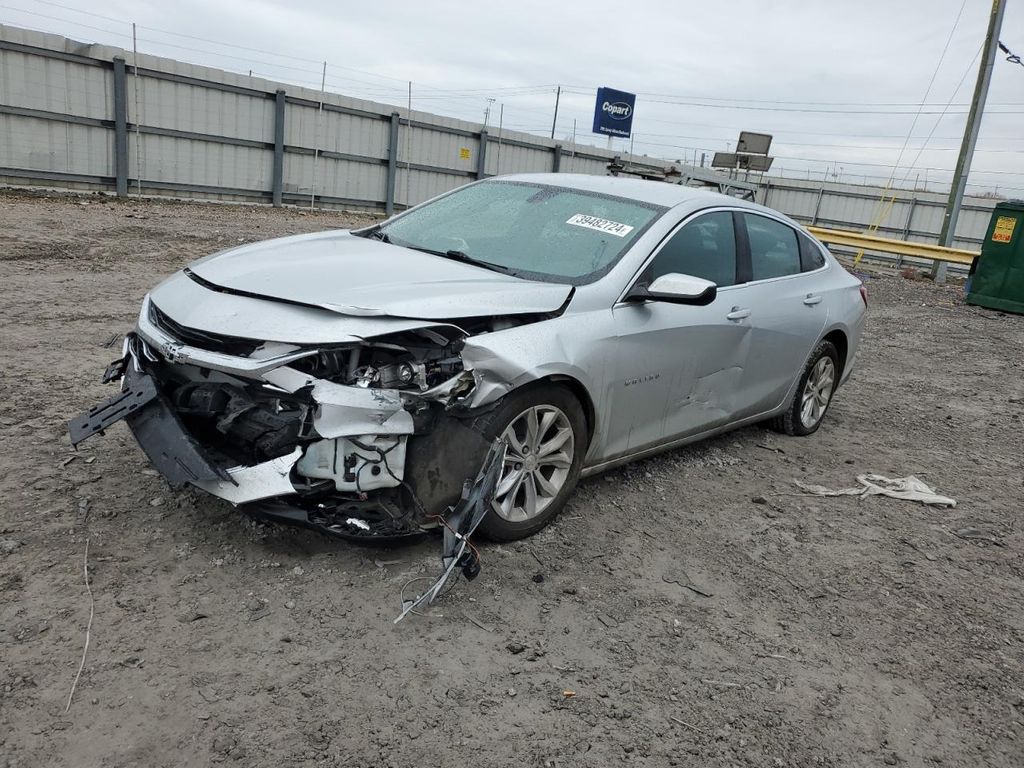
2020 CHEVROLET MALIBU
in 2 days, 58,254 mi
est retail value $21,713
buy now price $2,875
VIN 1G1ZD5ST9LF115156
Frequently asked questions
You can track the depreciation of your car by monitoring market trends, checking online valuation tools, and staying informed about new model releases.
The market value of a vehicle is calculated based on its historical depreciation trends, current condition, mileage, and market trends.
Our reports may indicate the type of use for each vehicle, including whether the 2019 FORD was primarily used as a personal, rental, or commercial vehicle, based on available data.
Our reports may include information on any past recalls issued for 2019 FORD vehicles, detailing the nature of the recall and whether it was addressed, if data is available.
Safety ratings on the Monroney label include crash test results from agencies like the NHTSA and IIHS, providing an assessment of the vehicle's safety.
You can use a Monroney label to compare different 2019 FORD models by reviewing their features, fuel economy, safety equipment, and pricing directly on the sticker.
Market value is generally estimated based on the 2019 FORD vehicle’s history, condition, and comparable sales, helping to provide a guideline for buyers and sellers, though specific values can vary.
Understanding depreciation is important for car owners to manage financial expectations and make informed decisions about selling or trading in their vehicles at the right time.
Total loss is usually determined when the cost of repairing the vehicle exceeds a certain percentage of its value before the damage occurred, as decided by the insurance company, if such data is recorded.
Title information may detail the 2019 FORD vehicle’s legal status, indicating whether it has a clean, salvage, or rebuilt title, which affects its value and insurability, if such details are recorded.


