
BADVIN vehicle history report for
2017 FORD TRANSITVIN: 1FTYR1CM3HKA60321
Get FULL ACCESS to the vehicle history report and see all blurred info.
⭐ Read 206+ reviews from our customers who used BADVIN to avoid buying junk vehicles.
Historical Records
events
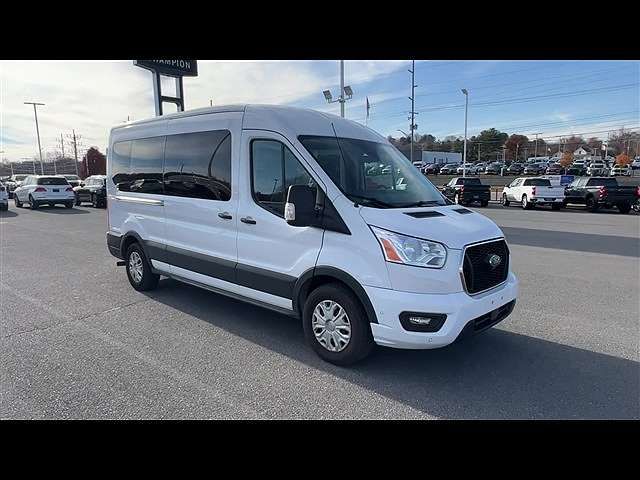
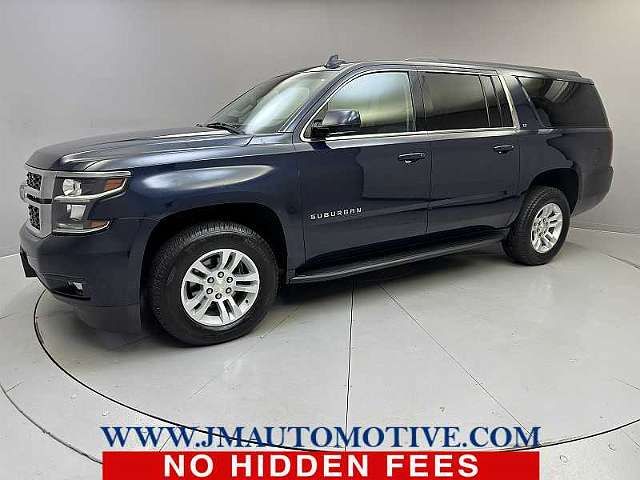
Photos
12 images
Sales History
1 records
Sale Prices
1 records
Market report
Price analytics
Historical Records
Historical records may include service and maintenance records, title status (clean, junk, salvage), insurance records, number of owners, registration events and states, and other information.
You can find more information about historical records in BADVIN reports and see more examples here.
Available historical records for VIN 1FTYR1CM3HKA60321
Latest reported mileage: 296 mi
Below you can see some examples of what these records could look like.
2023-12-21
6 months ago
152,519 mi
SALVAGE TITLE/CERTIFICATE ISSUED
2022-04-02
2 years ago
23,858 mi
Vehicle serviced
40,000 mile service performed
40,000 mile service performed
2021-01-10
3 years ago
38,760 mi
Vehicle serviced
Outer tie rod(s) replaced
Alignment performed
Outer tie rod(s) replaced
Alignment performed
| Year | 2017 |
| ODO | 1743 mi |
| Condition | Hidden text |
| Seller | Hidden text |
| Location | Sioux Falls, SD, 57106 |
| Date | appeared 2 years ago latest price $2952 |
| Sale Website Type | classifieds |
| Notes | |
| Hidden text | |
sale information provided by user #793644


All photos above are REAL and display ACTUAL car. After you get the report you will see full resolution photos.
Tech Specs
| Body Style | Van |
| Color | White |
| Transmission | Automatic |
| Engine | 3.7 L |
| Cylinders | 6 Cyl |
| Drive | RWD |
| Fuel Type | Flexible-Fuel |
Extra Features
- Medium Roof
Standard Features
All these features are based on a model in general. This specific vehicle may differ.
- Cargo Van
- Hidden text
- Warranty
Model Analytics & Market Report
We've analyzed more than 24,900 sales records of this model and here are some numbers.
The average price for new (MSRP) 2017 FORD TRANSIT in 2017 was $40,890.
The average price for used 2017 FORD TRANSIT nowadays in 2024 is $24,998 which is 61% from the original price.
Estimated mileage driven per year is 15,794 miles.
For this model we also have depreciation curve, photos, list of features and options, and other analytics.
Take a look at 2017 FORD TRANSIT model page in BADVIN vehicles catalog.
Depreciation
The graph below is a depreciation curve for 2017 FORD TRANSIT. It shows how much this model looses per year in price. This analytics is calculated using sales records from BADVIN database.
The table below shows average price for used 2017 FORD TRANSIT in each year since the year of manufacturing, current year price and projected price in the future years.
You can scroll the table horizontally to see all columns.
| Year | Average Mileage | Average Price | % Left | % Lost | ||
|---|---|---|---|---|---|---|
| 2017 MSRP | 0 mi | $40,890 | — | — | 100% | 0% |
| 2017 | 15,794 mi | $53,997 | −$13,107 | −32.05% | 132.05% | -32.05% |
| 2018 | 31,588 mi | $47,983 | +$6,014 | +11.14% | 117.35% | -17.35% |
| 2019 | 47,382 mi | $43,495 | +$4,488 | +9.35% | 106.37% | -6.37% |
| 2020 | 63,176 mi | $38,989 | +$4,506 | +10.36% | 95.35% | 4.65% |
| 2021 | 78,970 mi | $35,999 | +$2,990 | +7.67% | 88.04% | 11.96% |
| → Visit 2017 FORD TRANSIT depreciation page to see full data. | ||||||
Price vs Mileage
The graph below shows how mileage affects the price for 2017 FORD TRANSIT. This data was calculated using sales records from BADVIN database.
The table below shows average price for used 2017 FORD TRANSIT by mileage and number of sales.
You can scroll the table horizontally to see all columns.
| Mileage | Average Price | Sample Size |
|---|---|---|
| 5,000 mi | $42,900 | 13 sales |
| 10,000 mi | $42,493 | 16 sales |
| 15,000 mi | $38,995 | 24 sales |
| 20,000 mi | $37,985 | 21 sales |
| 25,000 mi | $35,977 | 27 sales |
| 30,000 mi | $36,999 | 49 sales |
| → Visit 2017 FORD TRANSIT depreciation page to see full data. | ||
Get FULL ACCESS to the vehicle history report and see all blurred info.
⭐ Read 206+ reviews from our customers who used BADVIN to avoid buying junk vehicles.
Testimonials from our customers
I almost bought a used Honda but luckily checked the BadVin report first. Turned out it had a salvage title from flood damage that the seller didn't disclose. Phew, dodged a huge issue!

Emily Turner
verified on Trustpilot
I've tried a bunch of different vehicle history reports over the years and badvin.org has been the most comprehensive by far. Stuff like service records, ownership history, lien and repo info that I haven't found elsewhere. Def go-to resource when shopping for used vehicles now.
Levi Johnson
verified on Trustpilot
I import used luxury cars from US auctions to resell in Russia. The vehicle history reports from badVIN are essential for avoiding problem cars. For a BMW I was bidding on, it uncovered a salvage title from flood damage that other reports missed! That alone pays for the service.
Dmitry Volkov
verified on Trustpilot
As a first time used car buyer, I was nervous about getting ripped off. The vehicle report from badvin gave me so much more confidence - it confirmed the car had a clean history and the mileage lined up. Such a relief to have that peace of mind.
Chloe Martin
verified on Trustpilot
Compare to other 2017 FORD TRANSIT


Other vehicles sales records


Frequently asked questions
Yes, by law, all new 2017 FORD vehicles are required to display a Monroney label to provide clear pricing and feature information to consumers.
The frequency of oil changes, a crucial aspect of vehicle maintenance, might be documented in the service history section of our reports, if records are available.
The last known odometer reading, if recorded, is noted in our reports, providing a snapshot of the 2017 FORD TRANSIT's usage up to that point.
The average depreciation rate for vehicles over five years can vary, but many models experience a significant portion of their depreciation within the first few years of ownership.
Depreciation, which reflects the decline in a 2017 FORD vehicle's value over time due to factors like age, mileage, and condition, may directly impact its resale value, based on recorded information.
The total price on a Monroney label includes the base price of the vehicle, plus the cost of any optional features, packages, and mandatory fees such as destination charges.


