BADVIN vehicle history report for
2017 FORD F-150VIN: 1FTFW1EG3HKD28341
Get FULL ACCESS to the vehicle history report and see all blurred info.
⭐ Read 205+ reviews from our customers who used BADVIN to avoid buying junk vehicles.
Historical Records
events
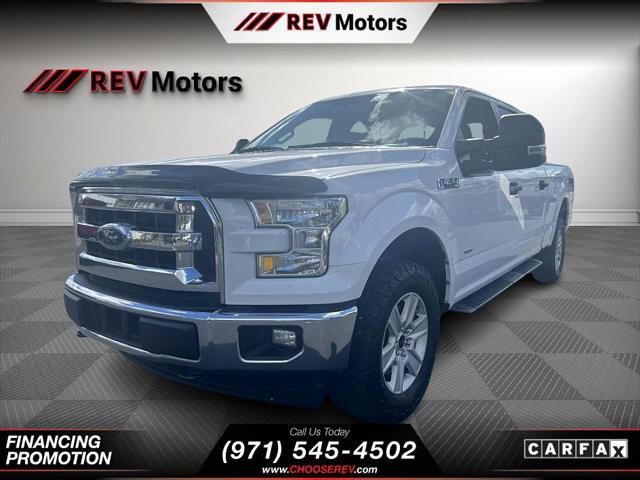
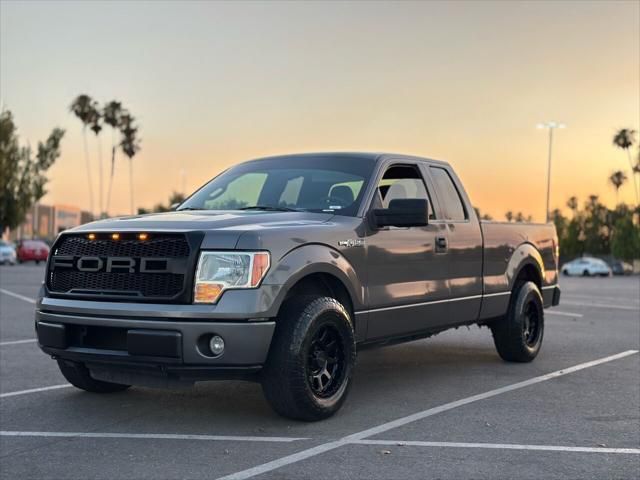
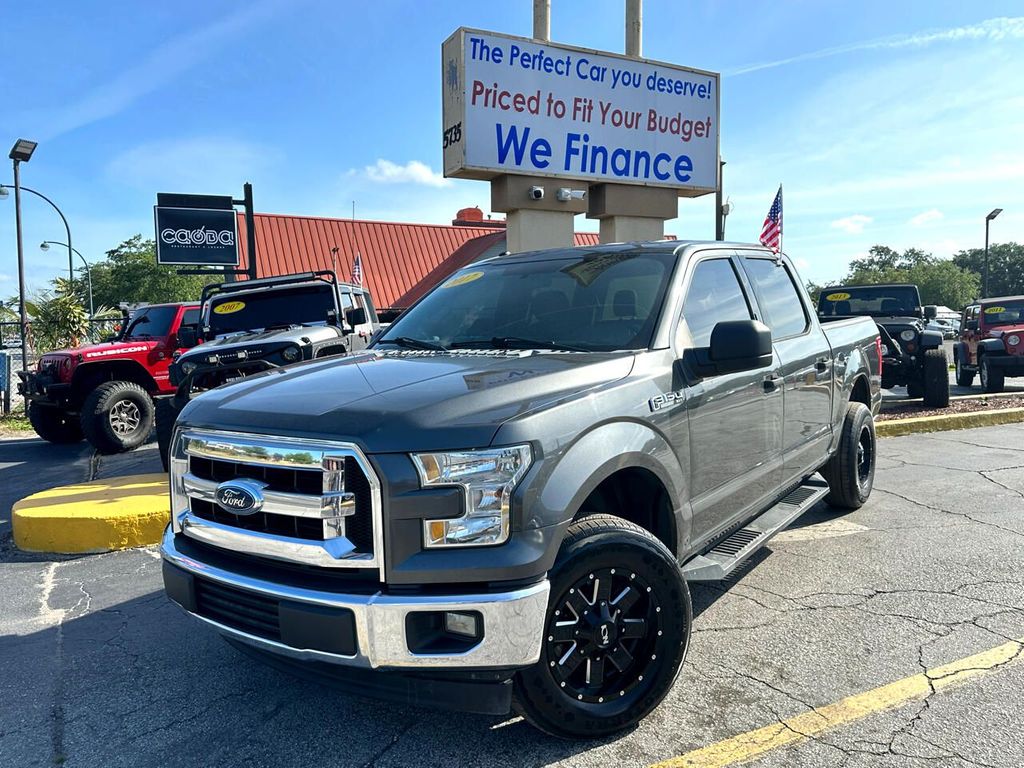
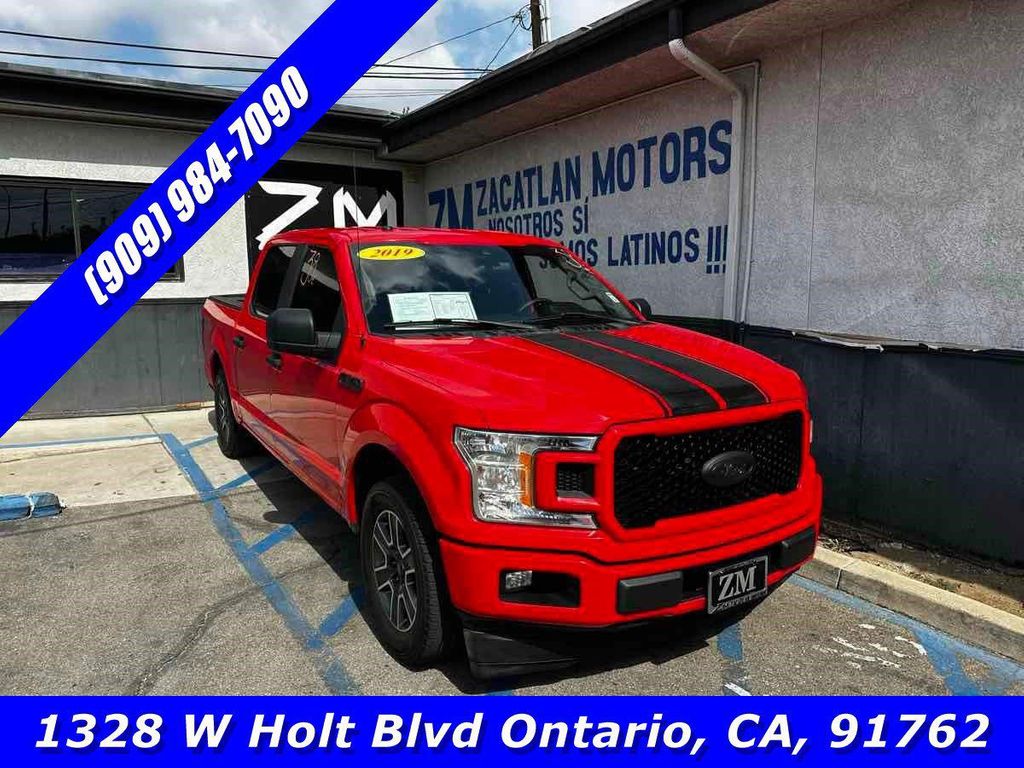
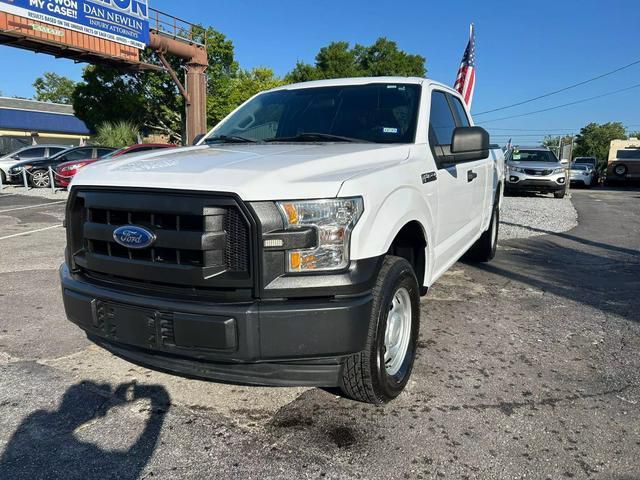
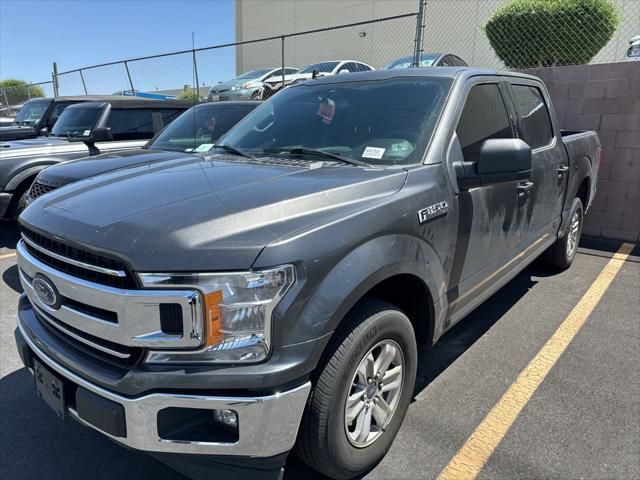
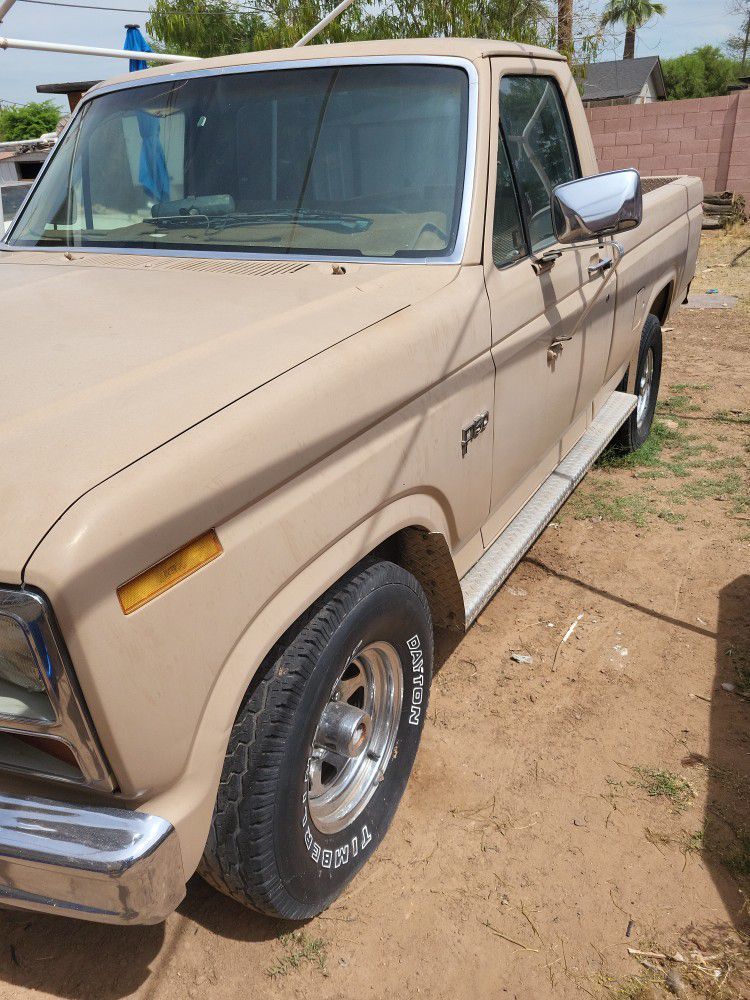
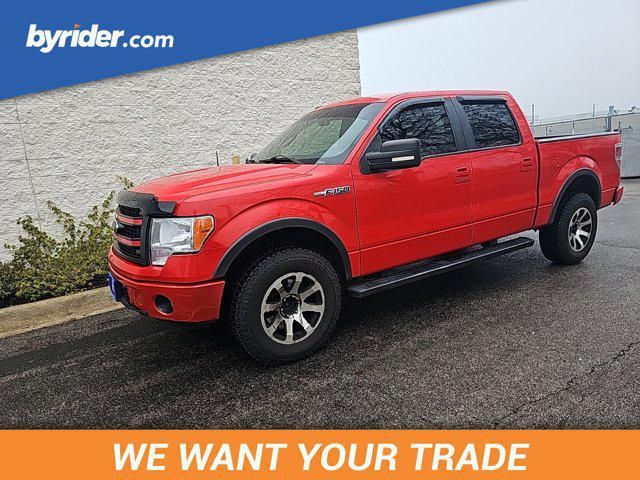
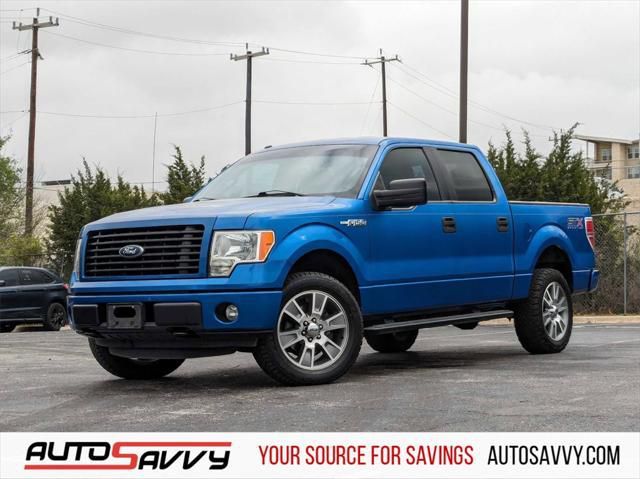
Photos
12 images
Sales History
1 records
Sale Prices
1 records
Market report
Price analytics
Historical Records
Historical records may include service and maintenance records, title status (clean, junk, salvage), insurance records, number of owners, registration events and states, and other information.
You can find more information about historical records in BADVIN reports and see more examples here.
Available historical records for VIN 1FTFW1EG3HKD28341
Latest reported mileage: 368 mi
Below you can see some examples of what these records could look like.
2023-03-31
a year ago
61,724 mi
Damage reported
Damage to front
Damage to front
2021-10-12
3 years ago
10,821 mi
Damage reported: minor to moderate damage
Damage to right rear
Damage to rear
Damage to right rear
Damage to rear
2019-09-10
5 years ago
44,191 mi
Vehicle serviced
Outer tie rod(s) replaced
Alignment performed
Outer tie rod(s) replaced
Alignment performed
2017 Ford F-150
| Year | 2017 |
| ODO | 9591 mi |
| Seller | Hidden text (Hidden text) |
| Location | Portland, OR, 97205 |
| Date | appeared 20 days ago latest price $7385 |
| Price History | |
| Sale Website Type | classifieds |
| Notes | |
| Hidden text | |
sale information provided by user #433045


All photos above are REAL and display ACTUAL car. After you get the report you will see full resolution photos.
Tech Specs
| Body Style | Crew Cab |
| Color | white |
| Drive | 4WD |
| Fuel Type | Regular Unleaded |
Model Analytics & Market Report
We've analyzed more than 349,700 sales records of this model and here are some numbers.
The average price for new (MSRP) 2017 FORD F-150 in 2017 was $50,165.
The average price for used 2017 FORD F-150 nowadays in 2024 is $26,990 which is 54% from the original price.
Estimated mileage driven per year is 9,394 miles.
For this model we also have depreciation curve, photos, list of features and options, and other analytics.
Take a look at 2017 FORD F-150 model page in BADVIN vehicles catalog.
Depreciation
The graph below is a depreciation curve for 2017 FORD F-150. It shows how much this model looses per year in price. This analytics is calculated using sales records from BADVIN database.
The table below shows average price for used 2017 FORD F-150 in each year since the year of manufacturing, current year price and projected price in the future years.
You can scroll the table horizontally to see all columns.
| Year | Average Mileage | Average Price | % Left | % Lost | ||
|---|---|---|---|---|---|---|
| 2017 MSRP | 0 mi | $50,165 | — | — | 100% | 0% |
| 2017 | 9,394 mi | $57,250 | −$7,085 | −14.12% | 114.12% | -14.12% |
| 2018 | 18,788 mi | $52,995 | +$4,255 | +7.43% | 105.64% | -5.64% |
| 2019 | 28,182 mi | $45,995 | +$7,000 | +13.21% | 91.69% | 8.31% |
| 2020 | 37,576 mi | $41,404 | +$4,591 | +9.98% | 82.54% | 17.46% |
| 2021 | 46,970 mi | $33,798 | +$7,606 | +18.37% | 67.37% | 32.63% |
| → Visit 2017 FORD F-150 depreciation page to see full data. | ||||||
Price vs Mileage
The graph below shows how mileage affects the price for 2017 FORD F-150. This data was calculated using sales records from BADVIN database.
The table below shows average price for used 2017 FORD F-150 by mileage and number of sales.
You can scroll the table horizontally to see all columns.
| Mileage | Average Price | Sample Size |
|---|---|---|
| 10,000 mi | $41,923 | 10 sales |
| 20,000 mi | $34,995 | 33 sales |
| 25,000 mi | $34,000 | 37 sales |
| 30,000 mi | $30,000 | 50 sales |
| 35,000 mi | $32,300 | 73 sales |
| 40,000 mi | $32,278 | 88 sales |
| → Visit 2017 FORD F-150 depreciation page to see full data. | ||
Get FULL ACCESS to the vehicle history report and see all blurred info.
⭐ Read 205+ reviews from our customers who used BADVIN to avoid buying junk vehicles.
Testimonials from our customers
Was shopping for a used Range Rover and found one that seemed suspiciously cheap. The badVIN report revealed it had been in a major front end collision, with photos showing the damage. Steered clear of that one and saved myself a ton of headaches!!

Ava Patel
verified on Trustpilot
As a broke college kid I almost settled for a sketchy 2005 Altima cuz it was cheap. but splurged on the report from badvin 1st. soooo glad I did - turned out it had been totalled and rebuilt. spending a little saved me from wasting $1000s!
Sophie
verified on Trustpilot
As a used car dealer, I rely on badvin.org for checking every vehicle I'm considering purchasing at auction. The comprehensive reports give me peace of mind and help me avoid problem cars. Photos of past sales have saved me from overpaying many times. Worth every penny!
Misha
verified on Trustpilot
I always rely on badvin to check out any used car before I buy. It gives such a complete history, including past accidents, service records, recalls and much more. Feel so much more confident as a used car shopper having this info.
Sofia Garcia
verified on Trustpilot
Compare to other 2017 FORD F-150

Other vehicles sales records


Frequently asked questions
While not necessary, decoding a VIN for a routine service appointment can provide the mechanic with precise model information, facilitating accurate service and parts replacement.
Reports might include collision data, crash ratings, vehicle specifications from VIN decode, and more, providing a detailed profile of the 2017 FORD vehicle, depending on data availability.
Significant damage from flood, fire, or hail may severely affect a 2017 FORD vehicle's structure and mechanics, potentially resulting in a salvage title, depending on the extent of damage reported.
The manufacturing location can be interpreted from the first character of the VIN, which indicates the country of assembly, and sometimes more specific location details are included in the first few characters.
Advanced safety features can influence the resale value and slow the depreciation of vehicles by making them more attractive to safety-conscious buyers.
Safety ratings, if available, provide information from crash tests and safety evaluations, which can help assess the 2017 FORD vehicle's protection level in accidents.


