BADVIN vehicle history report for
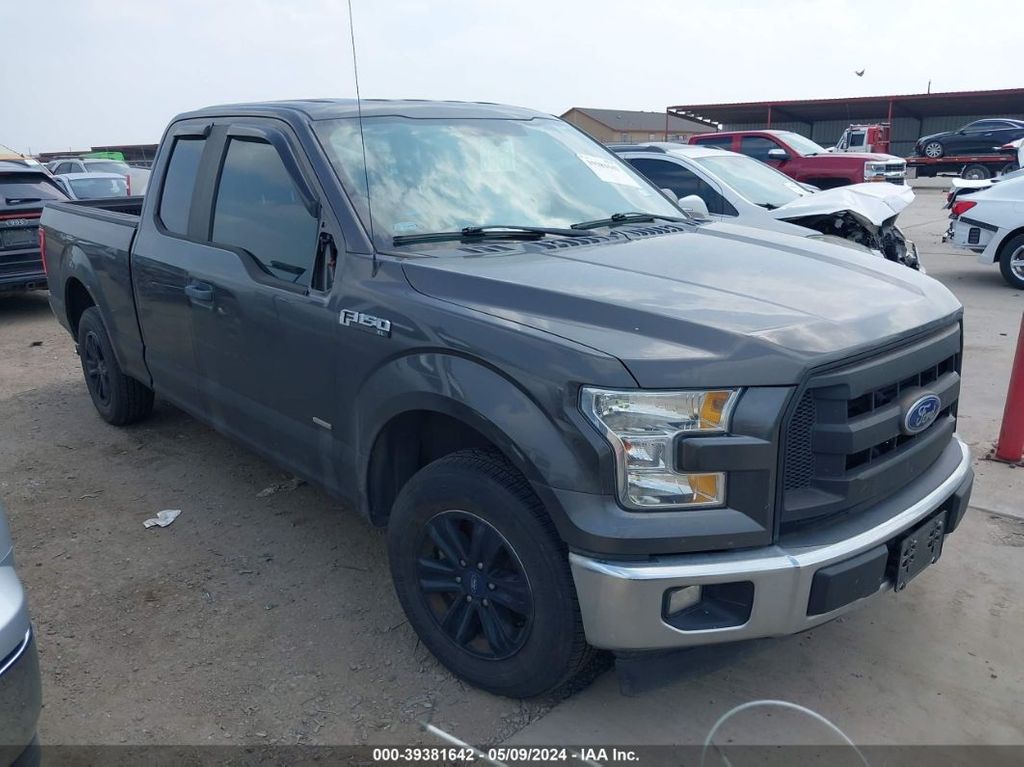
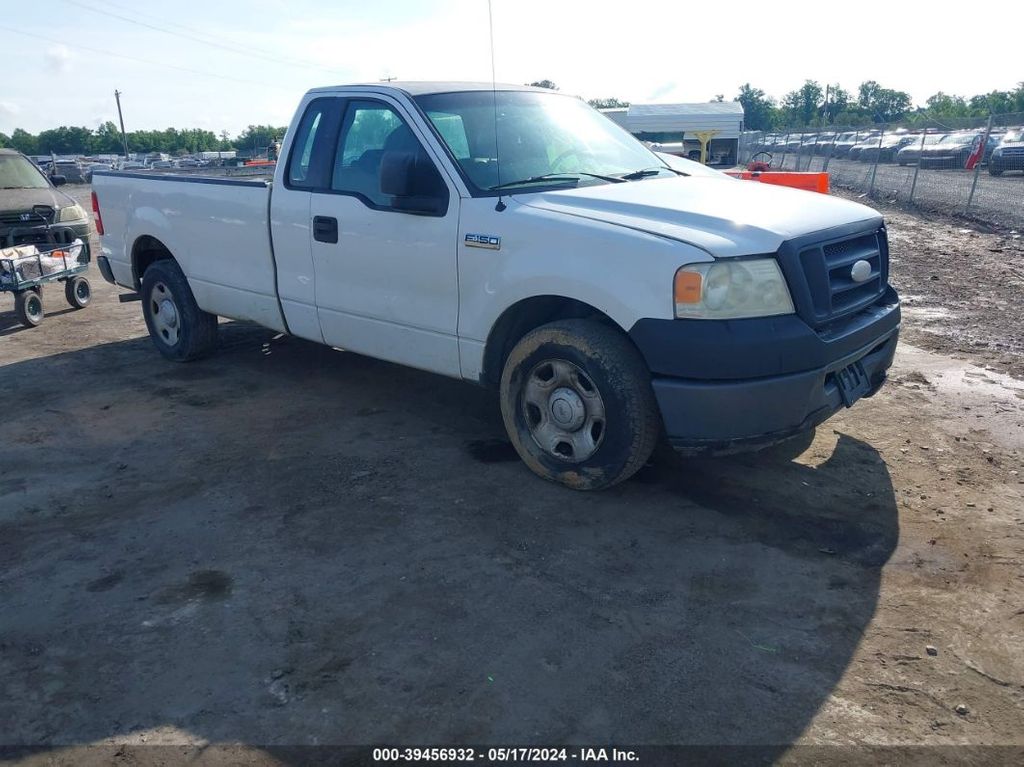
2017 FORD F-150VIN: 1FTEX1CP1HKC23440
Get FULL ACCESS to the vehicle history report and see all blurred info.
⭐ Read 205+ reviews from our customers who used BADVIN to avoid buying junk vehicles.
Historical Records
events
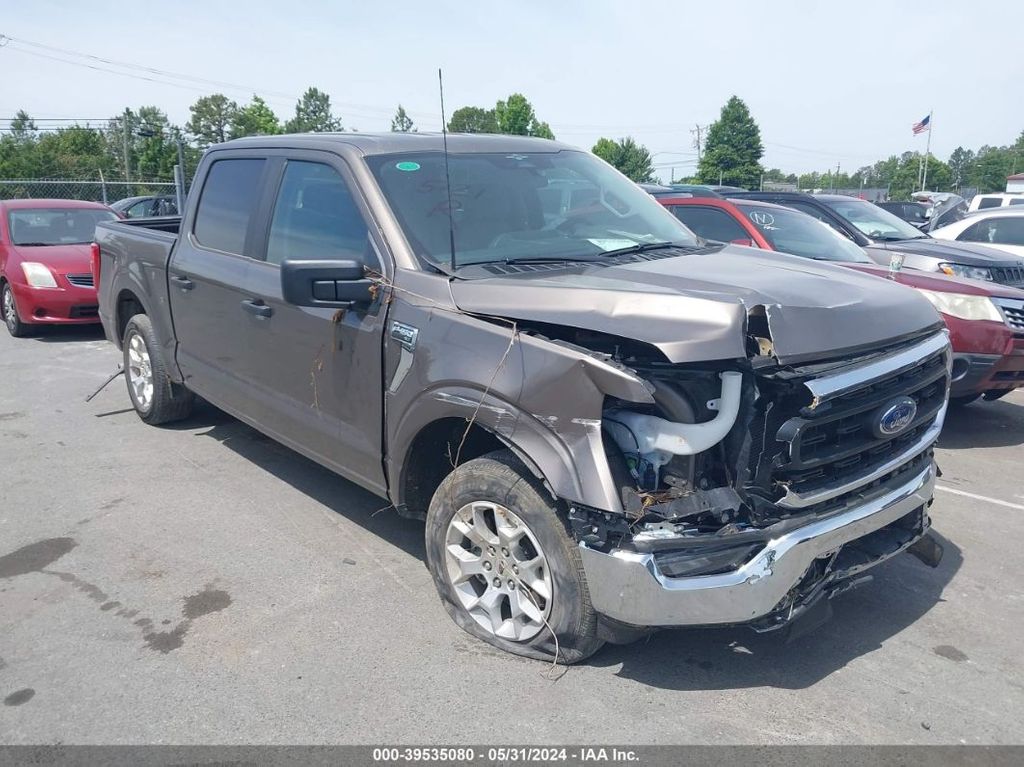
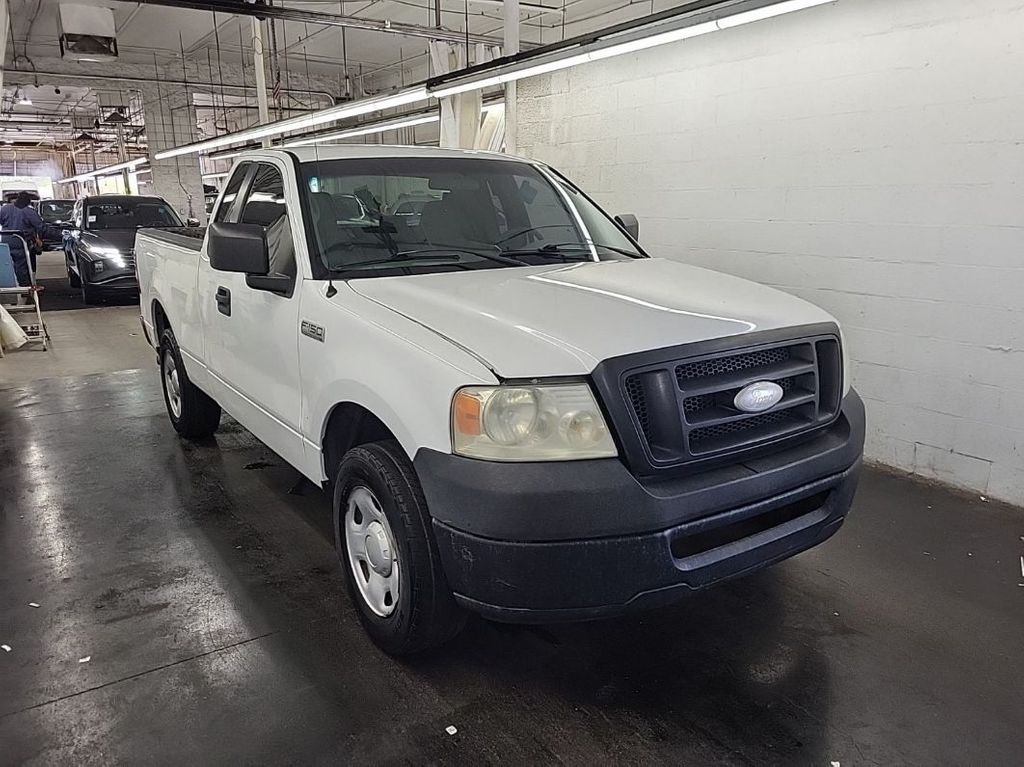
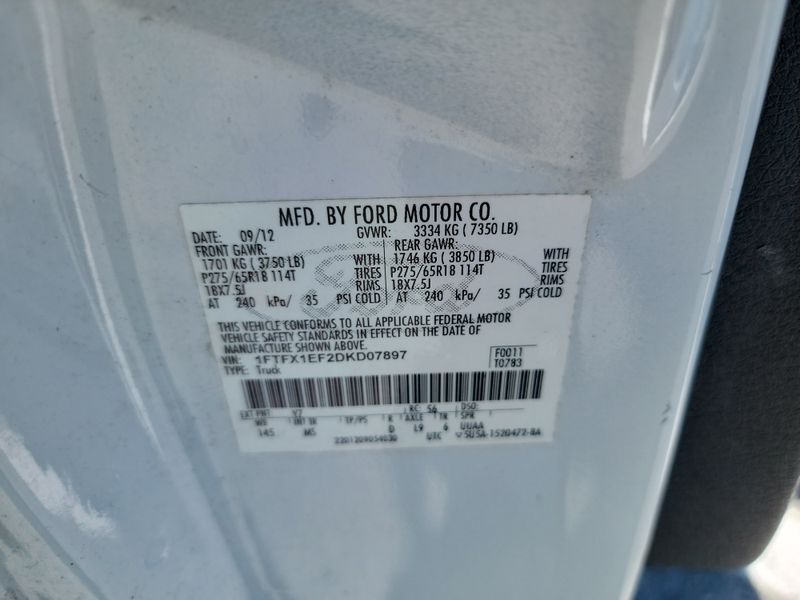
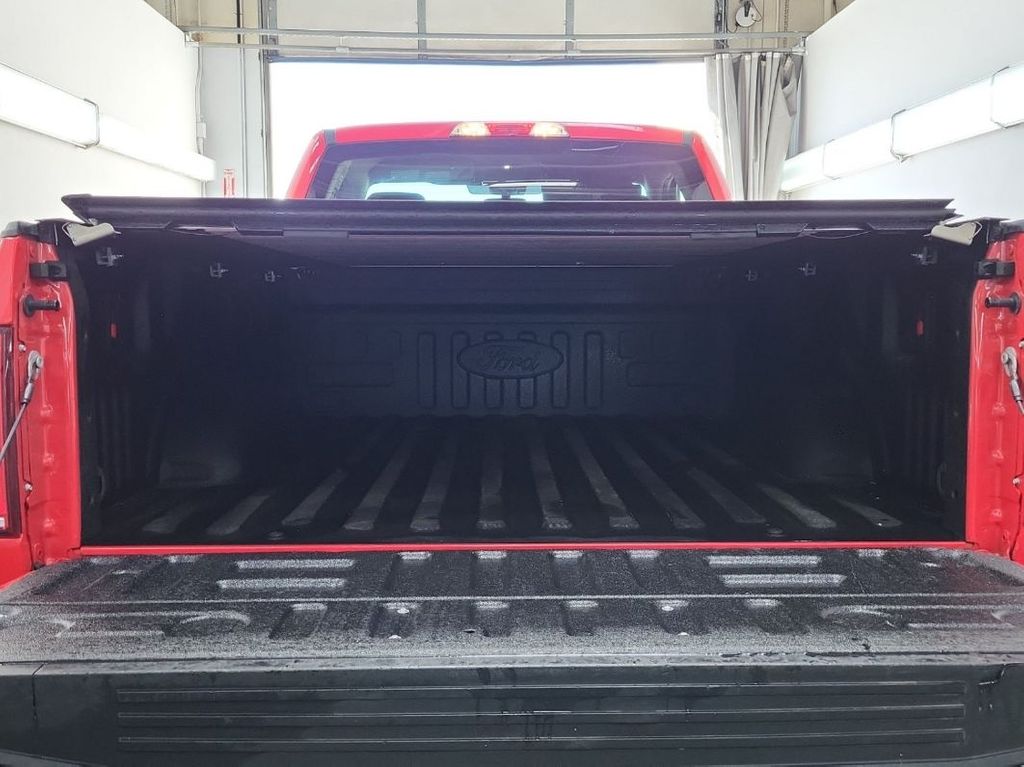
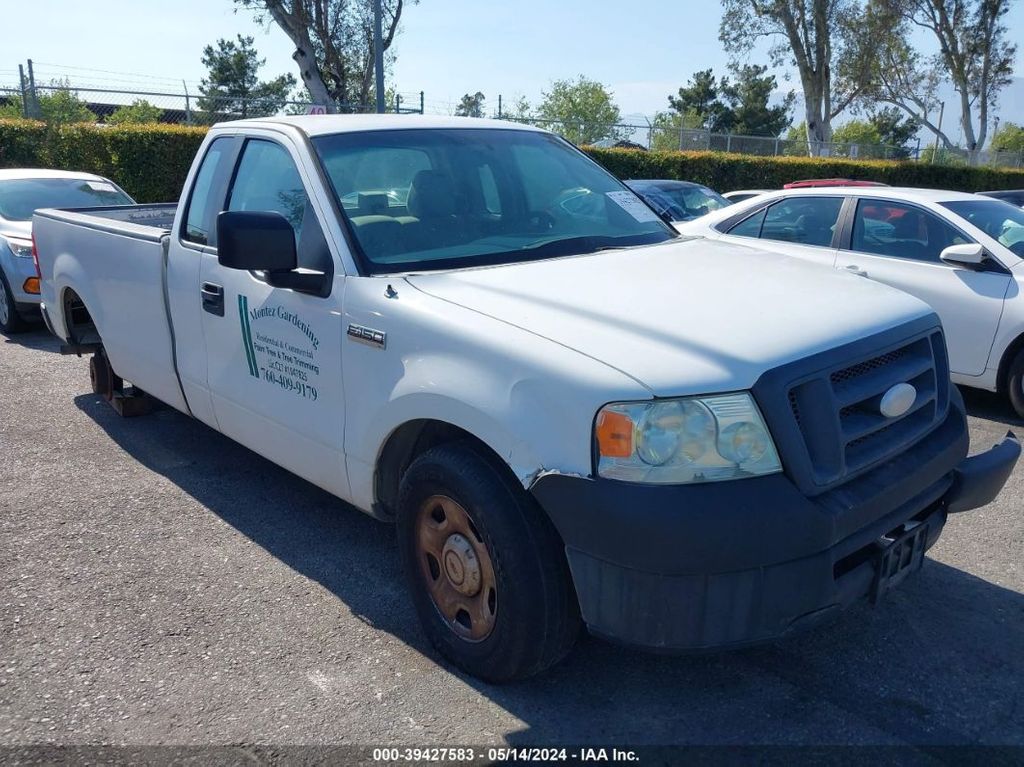
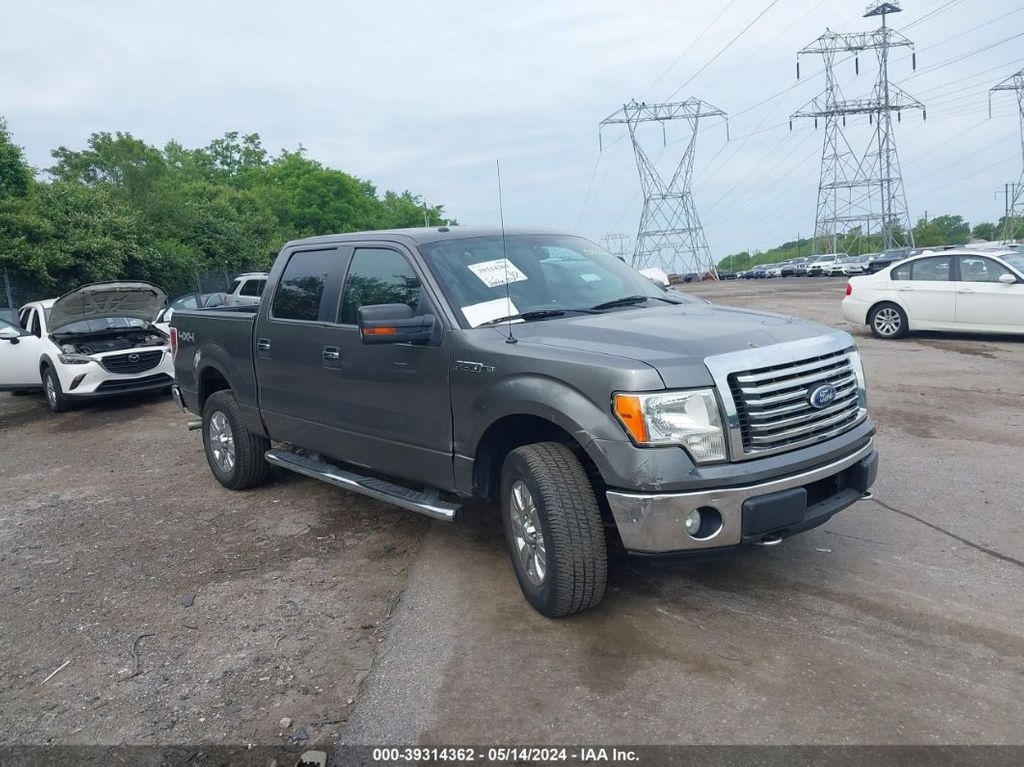
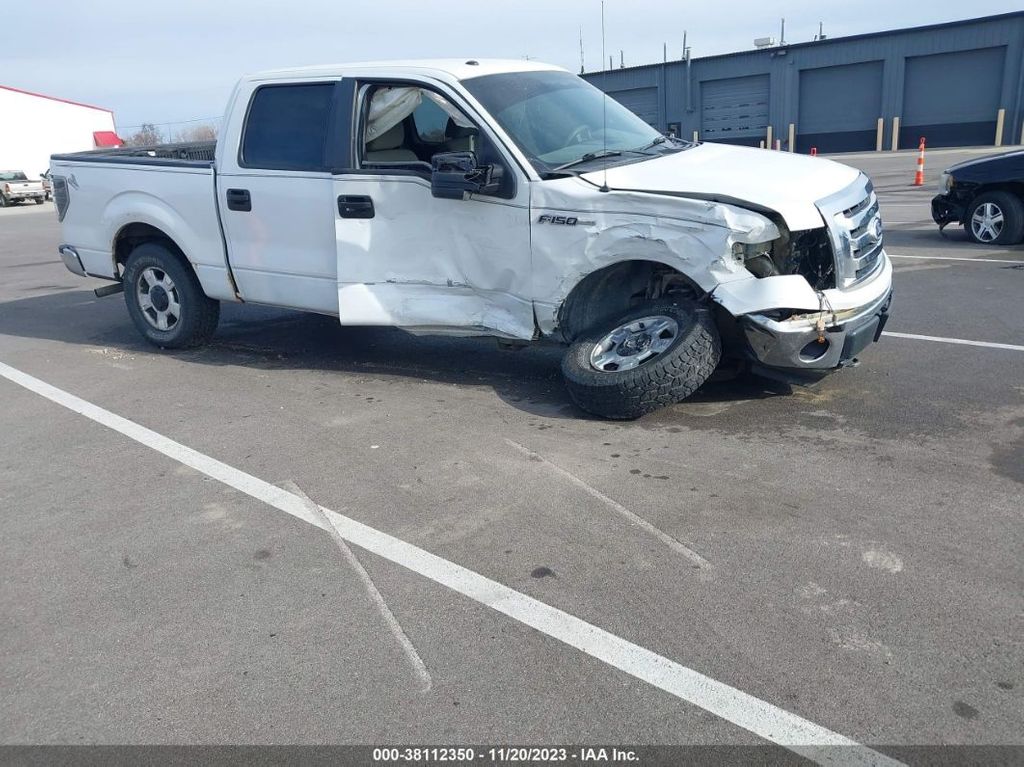
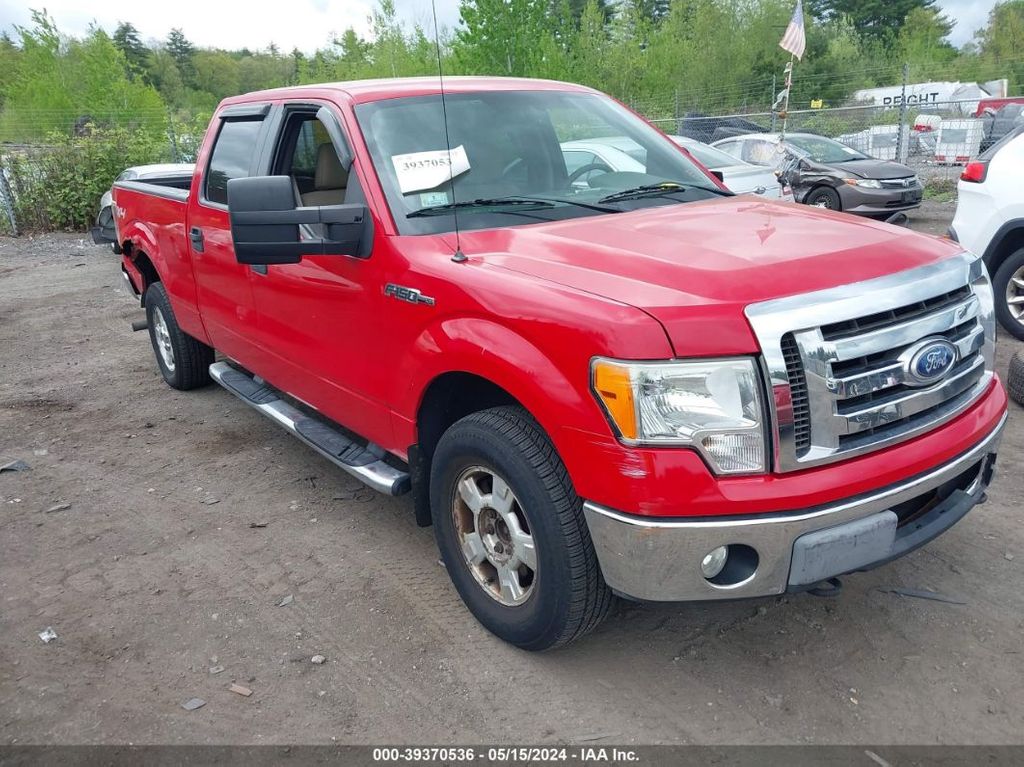
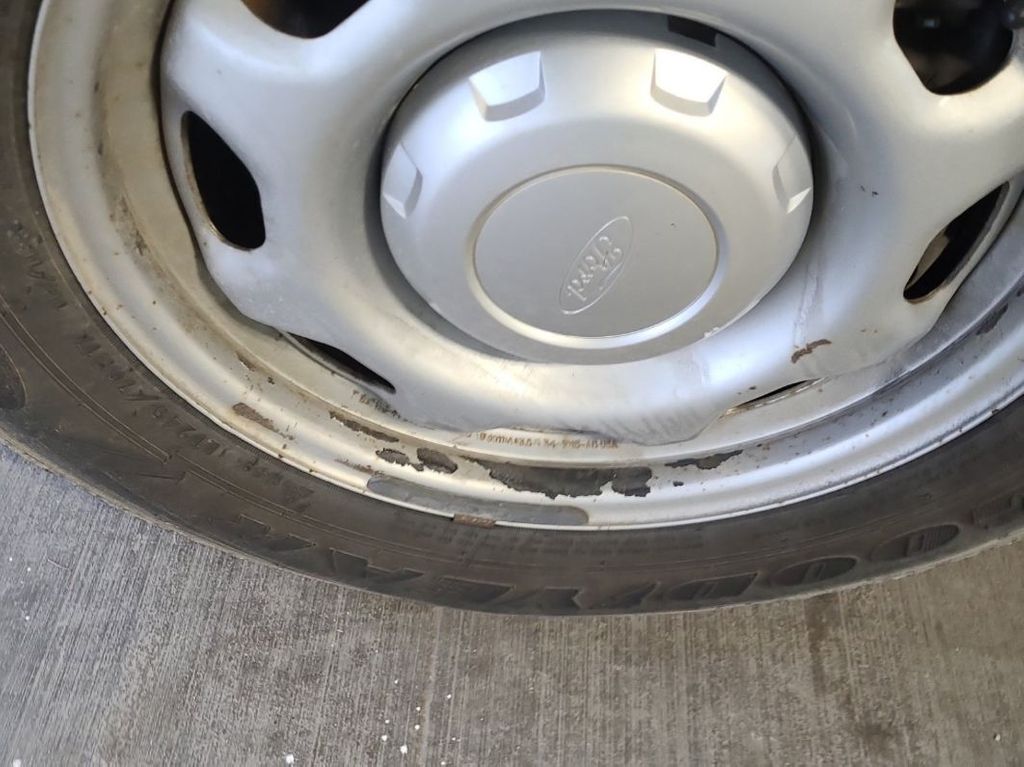
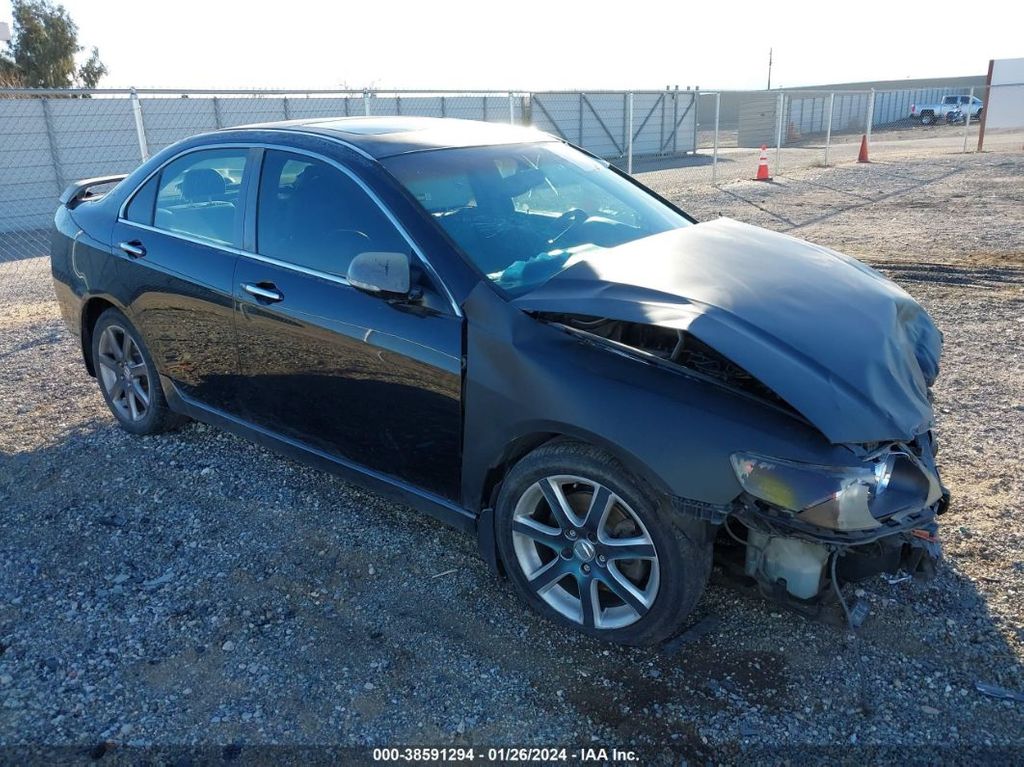
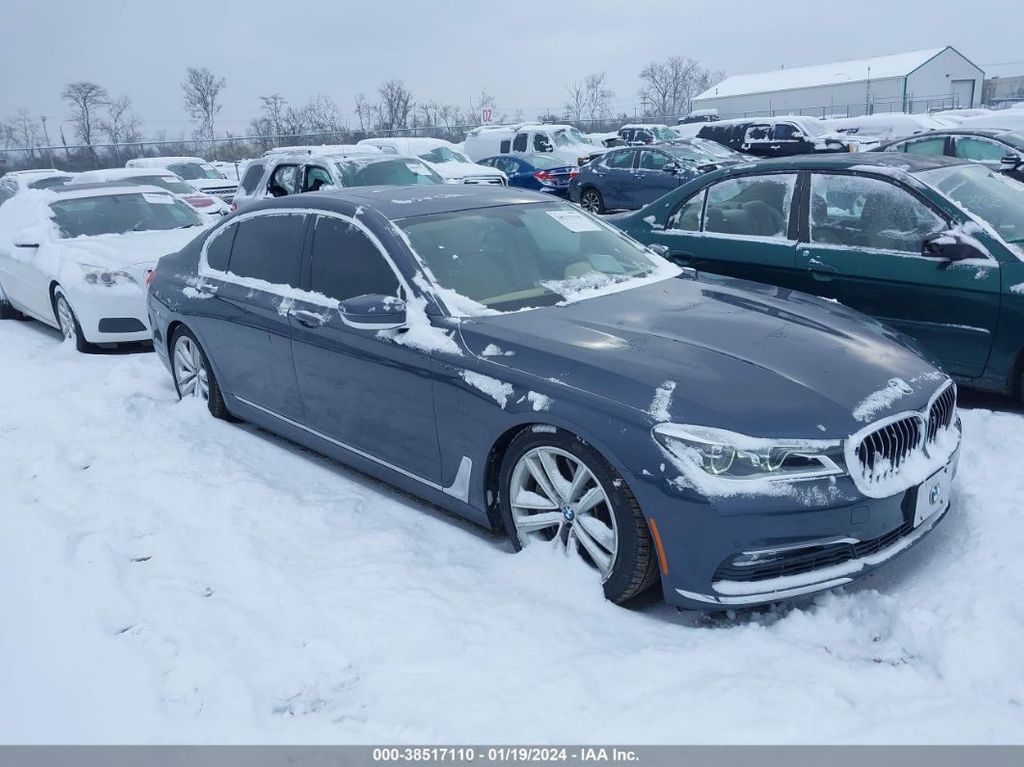
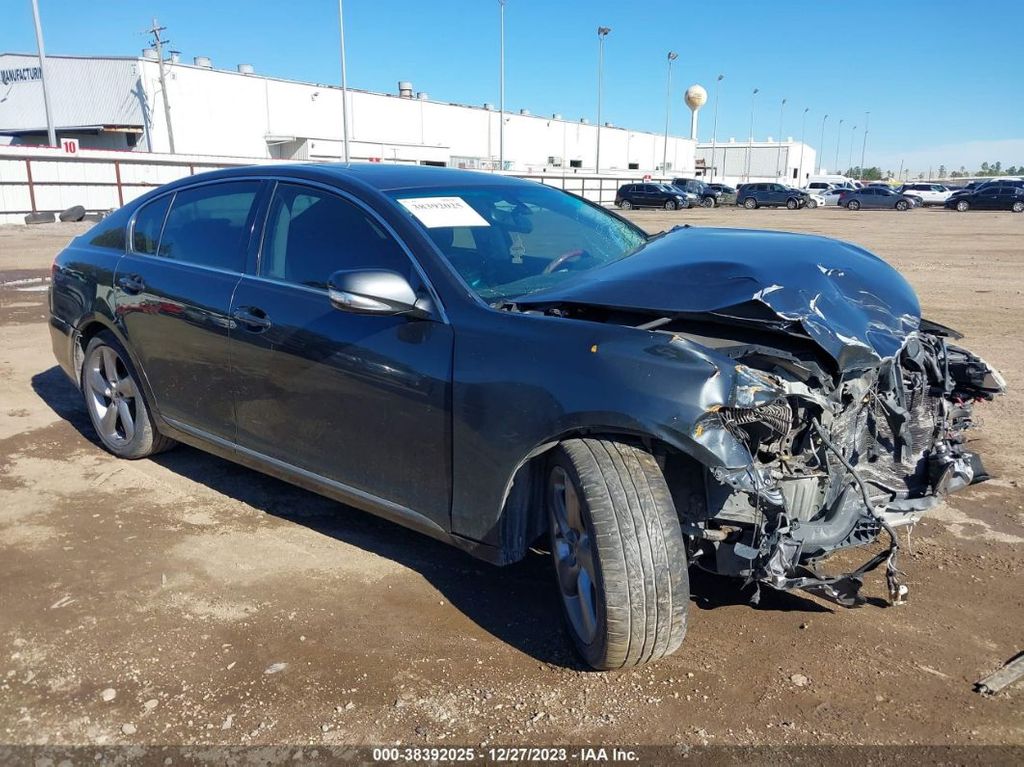
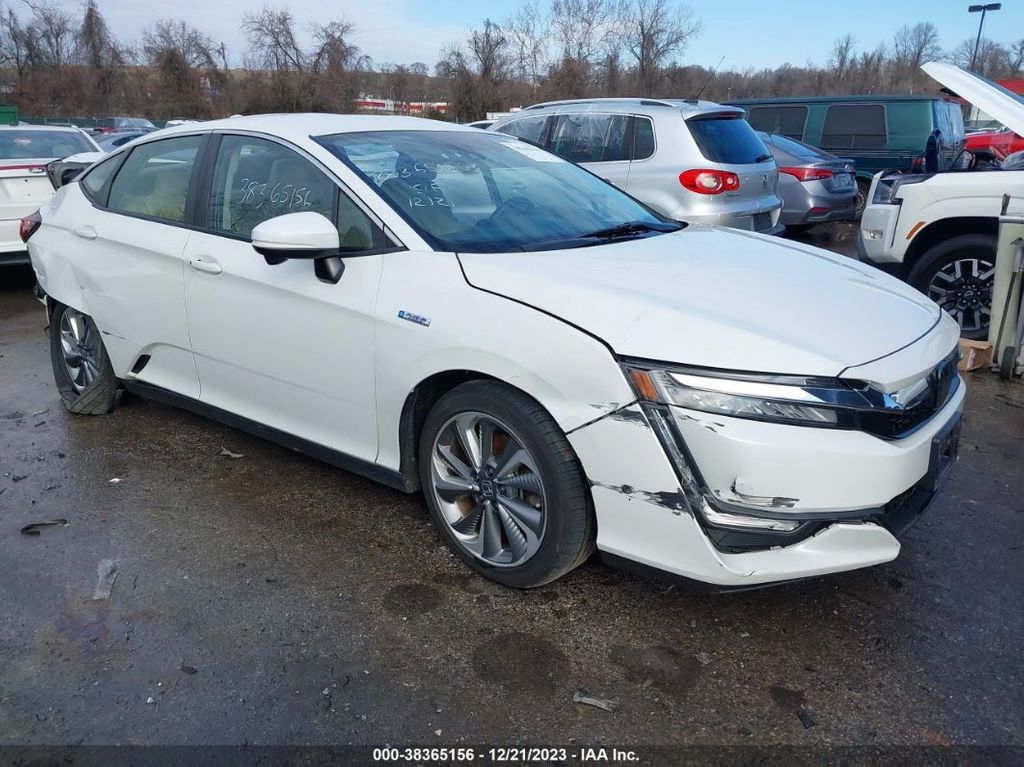
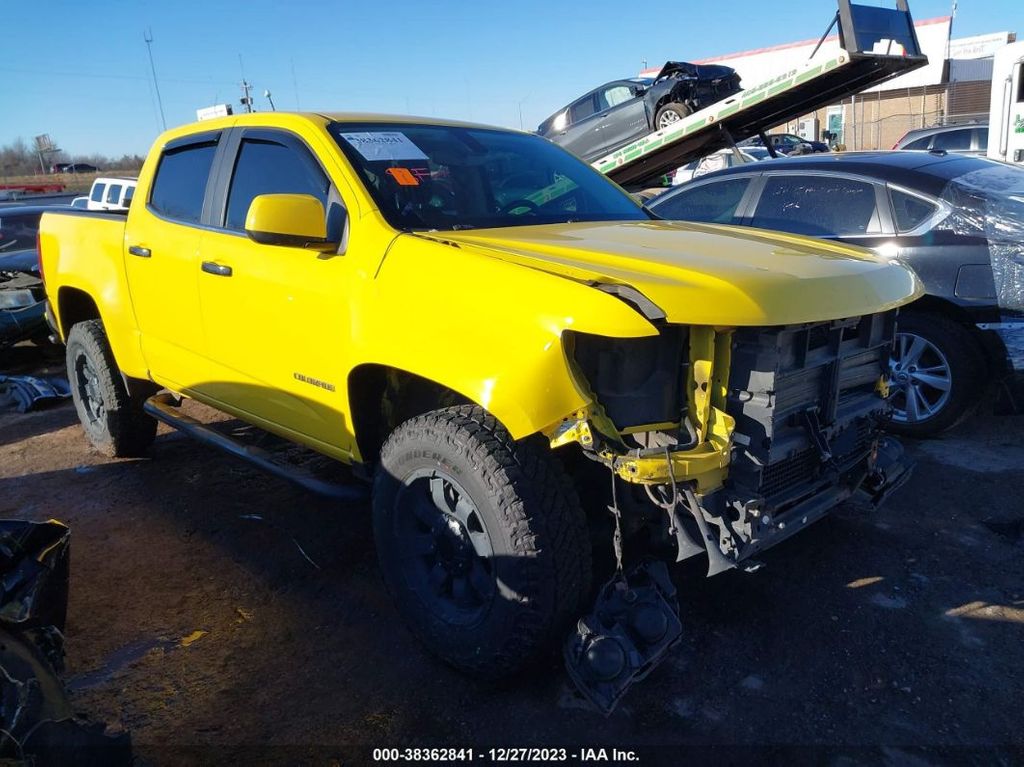
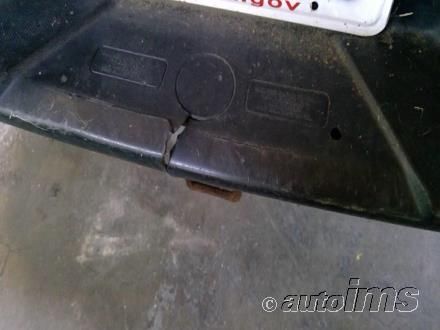
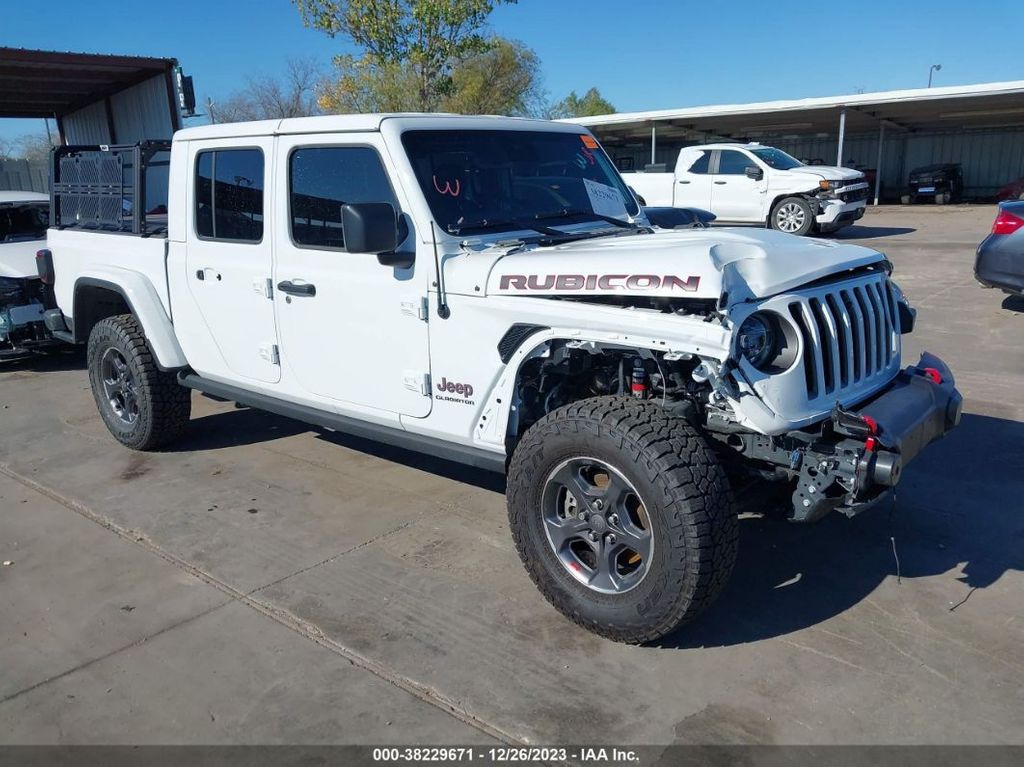
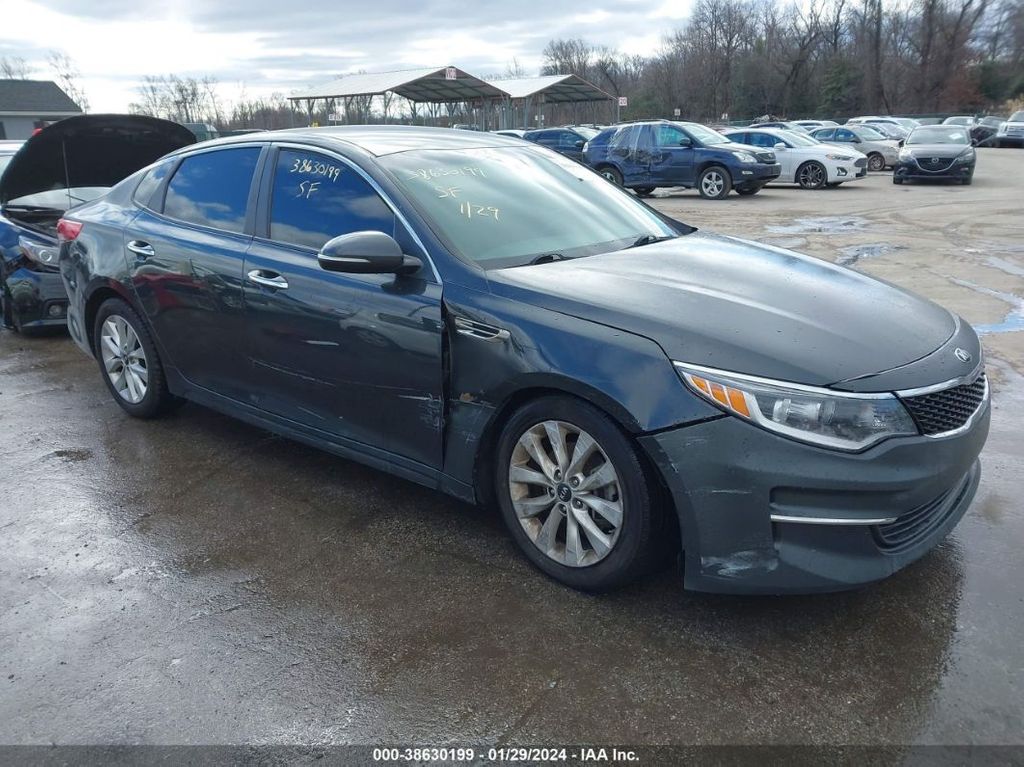
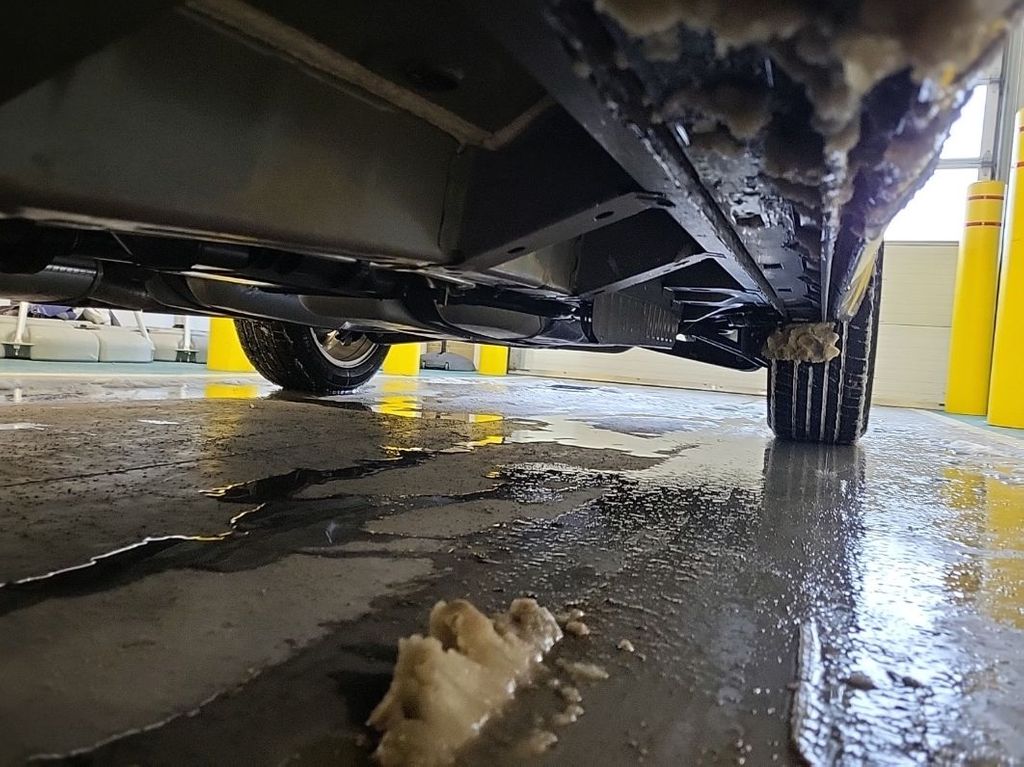
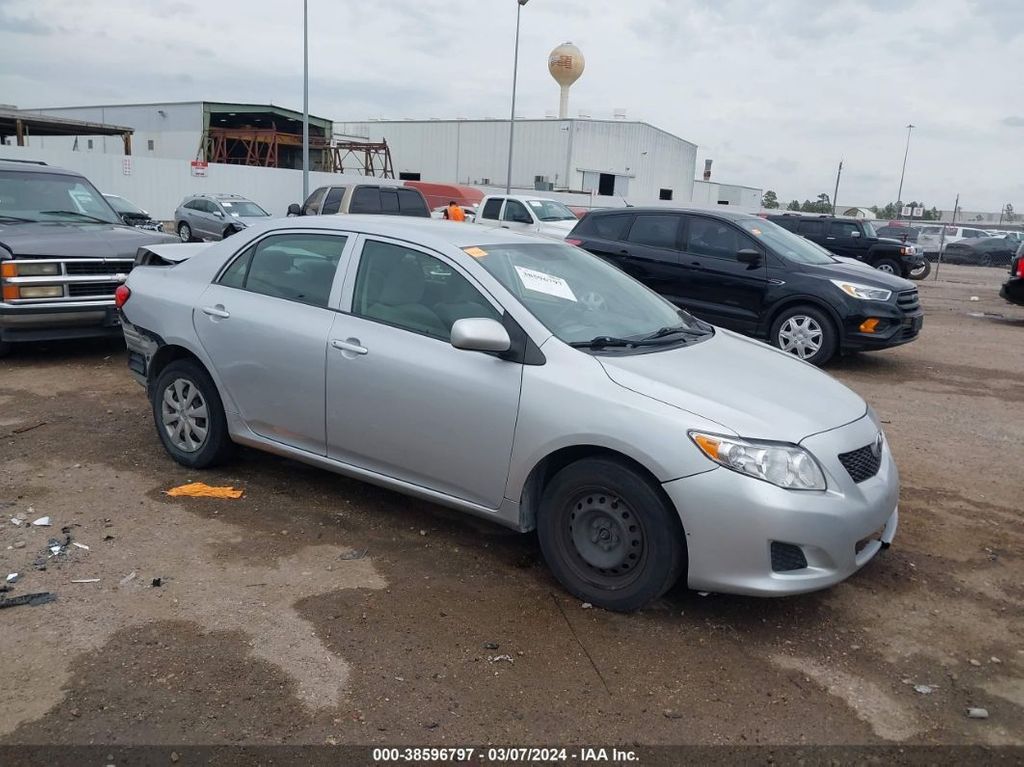
Photos
16 images
Sales History
1 records
Market report
Price analytics
Historical Records
Historical records may include service and maintenance records, title status (clean, junk, salvage), insurance records, number of owners, registration events and states, and other information.
You can find more information about historical records in BADVIN reports and see more examples here.
Available historical records for VIN 1FTEX1CP1HKC23440
Latest reported mileage: 918 mi
Below you can see some examples of what these records could look like.
2023-10-12
8 months ago
136,774 mi
Vehicle sold
MILEAGE INCONSISTENCY
MILEAGE INCONSISTENCY
2021-12-09
2 years ago
24,776 mi
New owner reported
REBUILT TITLE ISSUED
REBUILT TITLE ISSUED
2021-02-12
3 years ago
49,882 mi
Vehicle serviced
Outer tie rod(s) replaced
Alignment performed
Outer tie rod(s) replaced
Alignment performed
Sale Record
Has Keys:Hidden text
| Year | 2017 |
| Title | Hidden text |
| ODO | 9233 mi (Hidden text) |
| Loss | Hidden text |
| Damage | Hidden text |
| Estimated Retail Value | $4581 |
| Location | Austin, TX, 78741 |
| Date | ended 17 days ago |
| Sale Website Type | salvage or insurance auction |
sale information provided by user #548820


All photos above are REAL and display ACTUAL car. After you get the report you will see full resolution photos.
Tech Specs
| Body Style | EXTENDED CAB |
| Transmission | Automatic Transmission |
| Engine | 2.7L V-6 DI, DOHC, VVT, TURBO, 325HP |
| Cylinders | 6 Cylinders |
| Fuel Type | Gasoline |
Model Analytics & Market Report
We've analyzed more than 349,700 sales records of this model and here are some numbers.
The average price for new (MSRP) 2017 FORD F-150 in 2017 was $50,165.
The average price for used 2017 FORD F-150 nowadays in 2024 is $26,990 which is 54% from the original price.
Estimated mileage driven per year is 9,394 miles.
For this model we also have depreciation curve, photos, list of features and options, and other analytics.
Take a look at 2017 FORD F-150 model page in BADVIN vehicles catalog.
Depreciation
The graph below is a depreciation curve for 2017 FORD F-150. It shows how much this model looses per year in price. This analytics is calculated using sales records from BADVIN database.
The table below shows average price for used 2017 FORD F-150 in each year since the year of manufacturing, current year price and projected price in the future years.
You can scroll the table horizontally to see all columns.
| Year | Average Mileage | Average Price | % Left | % Lost | ||
|---|---|---|---|---|---|---|
| 2017 MSRP | 0 mi | $50,165 | — | — | 100% | 0% |
| 2017 | 9,394 mi | $57,250 | −$7,085 | −14.12% | 114.12% | -14.12% |
| 2018 | 18,788 mi | $52,995 | +$4,255 | +7.43% | 105.64% | -5.64% |
| 2019 | 28,182 mi | $45,995 | +$7,000 | +13.21% | 91.69% | 8.31% |
| 2020 | 37,576 mi | $41,404 | +$4,591 | +9.98% | 82.54% | 17.46% |
| 2021 | 46,970 mi | $33,798 | +$7,606 | +18.37% | 67.37% | 32.63% |
| → Visit 2017 FORD F-150 depreciation page to see full data. | ||||||
Price vs Mileage
The graph below shows how mileage affects the price for 2017 FORD F-150. This data was calculated using sales records from BADVIN database.
The table below shows average price for used 2017 FORD F-150 by mileage and number of sales.
You can scroll the table horizontally to see all columns.
| Mileage | Average Price | Sample Size |
|---|---|---|
| 10,000 mi | $41,923 | 10 sales |
| 20,000 mi | $34,995 | 33 sales |
| 25,000 mi | $34,000 | 37 sales |
| 30,000 mi | $30,000 | 50 sales |
| 35,000 mi | $32,300 | 73 sales |
| 40,000 mi | $32,278 | 88 sales |
| → Visit 2017 FORD F-150 depreciation page to see full data. | ||
Get FULL ACCESS to the vehicle history report and see all blurred info.
⭐ Read 205+ reviews from our customers who used BADVIN to avoid buying junk vehicles.
Testimonials from our customers
I've tried a bunch of different vehicle history reports over the years and badvin.org has been the most comprehensive by far. Stuff like service records, ownership history, lien and repo info that I haven't found elsewhere. Def go-to resource when shopping for used vehicles now.

Levi Johnson
verified on Trustpilot
As a car dealer importing vehicles from the US to Mexico, I rely on badvin for comprehensive history reports before bidding at auctions. Their info has helped me avoid several salvage vehicles and is more thorough than carfax. A must-have service!
Javier Ramirez
verified on Trustpilot
Bad Vin's vehicle history report showed that the 2018 Audi A4 I was about to buy had been in a major accident that was not disclosed by the seller. The severity analysis helped me avoid a bad purchase. Great service!
Sophie Dubois
verified on Trustpilot
Was about to buy a used 2016 Camry but decided to get the badvin report first. Turns out the car had been in a serious crash and was declared a total loss by insurance, even tho carfax showed it as clean! Dodged a bullet on that one. ty badvin
Jessica Nguyen
verified on Trustpilot
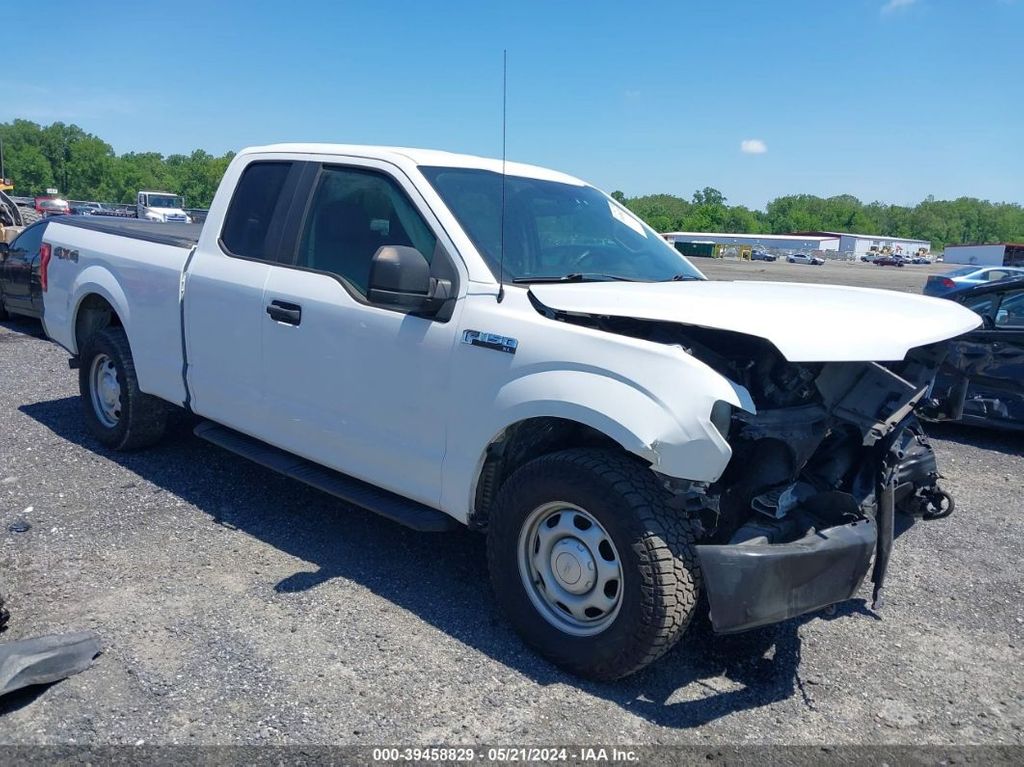
Compare to other 2017 FORD F-150
2007 FORD F-150
3 hours ago, 248,875 mi
est retail value $2,800
buy now price $875
VIN 1FTRF12287NA82308
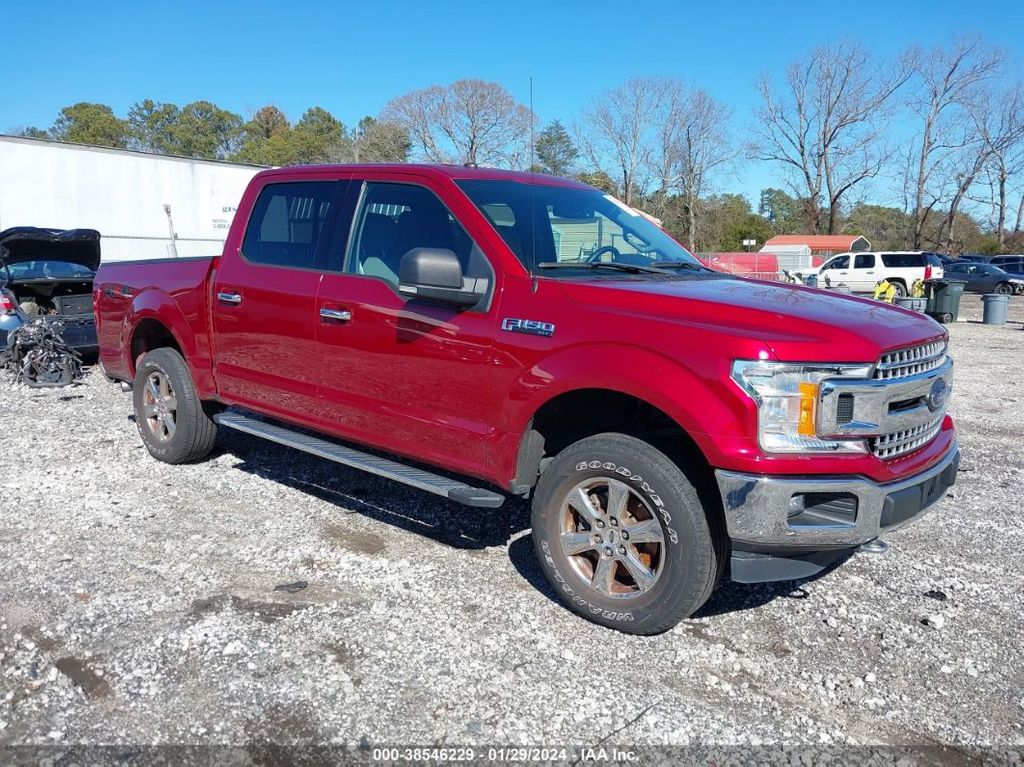
2018 FORD F-150
3 hours ago, 47,195 mi
est retail value $32,809
buy now price $12,350
VIN 1FTEW1EPXJFE76545
2010 FORD F-150
3 hours ago, 208,000 mi
est retail value $6,165
buy now price $1,500
VIN 1FTFW1EV4AFC70222
2010 FORD F-150
3 hours ago, 136,500 mi
est retail value $11,173
buy now price $2,300
VIN 1FTFW1EV1AFA33395
2010 FORD F-150
3 hours ago, 129,316 mi
est retail value $11,074
buy now price $2,750
VIN 1FTFW1EV4AFA81750
Other vehicles sales records


Frequently asked questions
Vehicle values are typically derived from leading sources and might indicate trade-in, retail, and other value ranges, providing a pricing baseline for the 2017 FORD F-150, based on available data.
In 2017 FORD vehicles, the part of the VIN that provides information about the engine type is typically one of the middle characters, which varies by manufacturer.
The report may include detailed records of previous repairs, including parts replaced, to give you a clear picture of the 2017 FORD vehicle's repair history, depending on the records available.
The accident history section of our report may contain details about each incident, such as dates, severity, and any injuries reported, depending on the data available.
A VIN alone does not typically provide fuel economy details directly; however, it can identify the vehicle model and engine type, which you can cross-reference with fuel economy data from other sources.
Factors to consider when estimating the future resale value include the car's historical depreciation rate, current market trends, overall vehicle condition, and mileage.
Vehicles that have been flooded may have a specific flood title or watermark in the vehicle history report, indicating significant water damage, if such events are documented.


