
BADVIN vehicle history report for
2018 FORD F-150VIN: 1FTEW1EPXJFB23674
Get FULL ACCESS to the vehicle history report and see all blurred info.
⭐ Read 206+ reviews from our customers who used BADVIN to avoid buying junk vehicles.
Historical Records
events
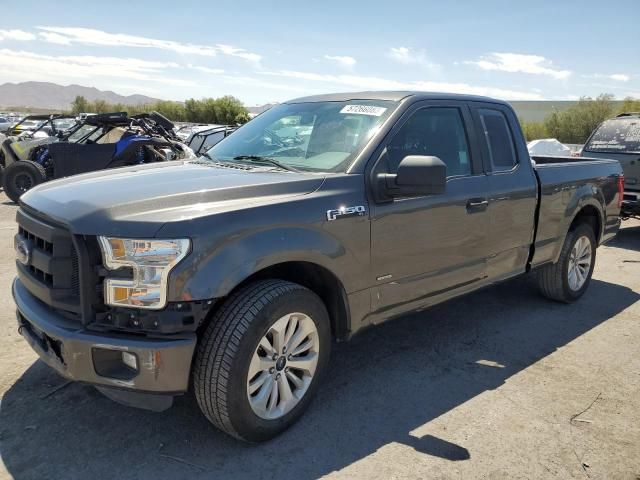
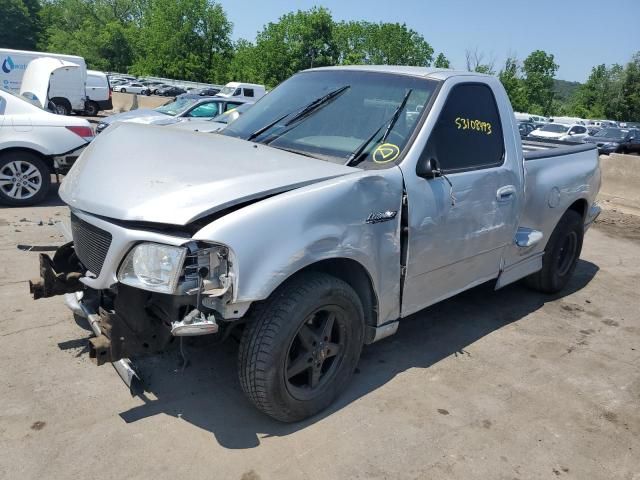
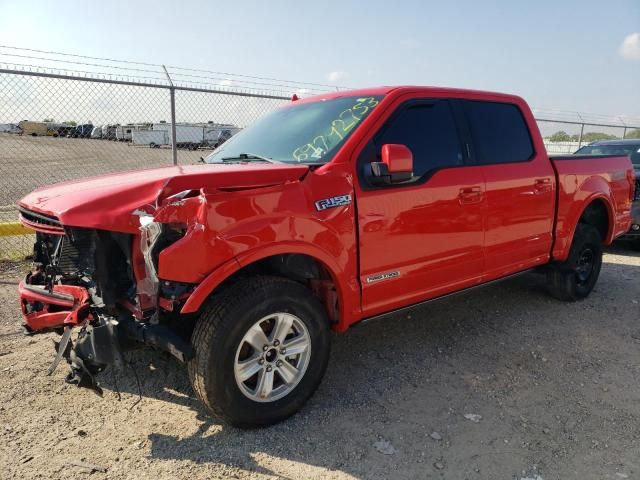
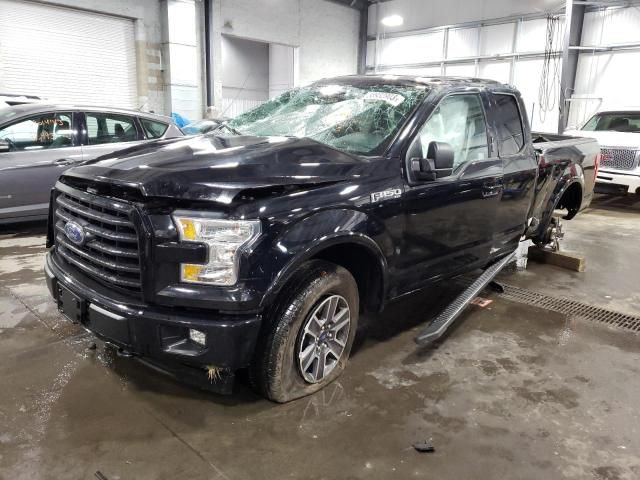
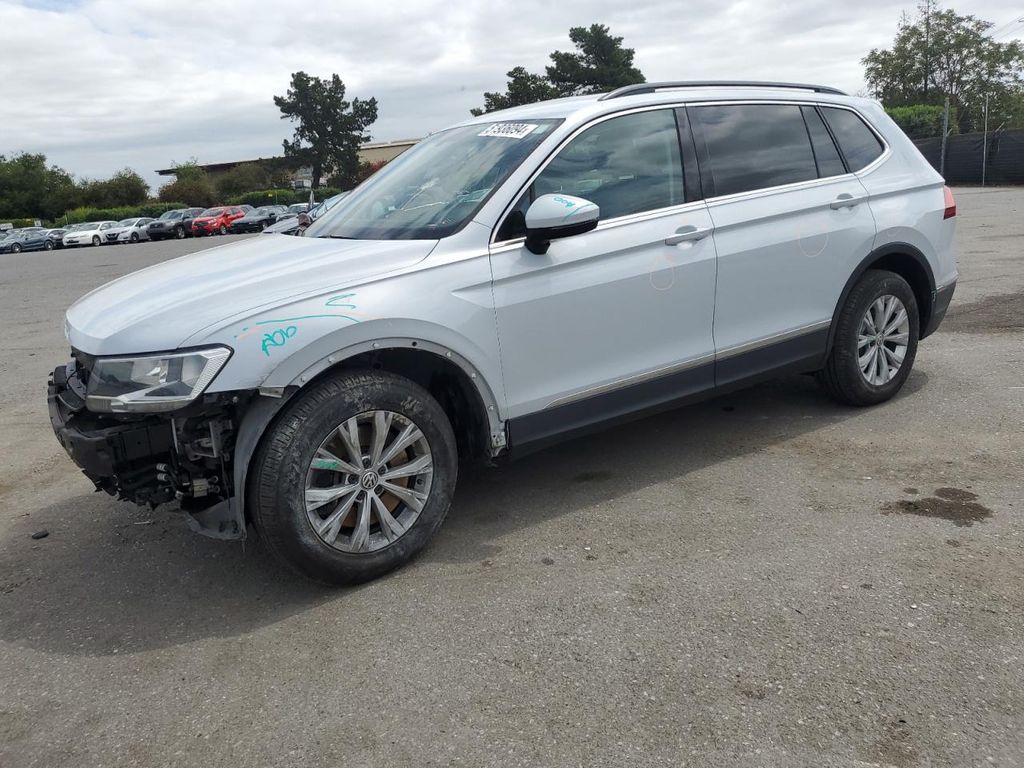
Photos
10 images
Sales History
1 records
Sale Prices
1 records
Market report
Price analytics
Historical Records
Historical records may include service and maintenance records, title status (clean, junk, salvage), insurance records, number of owners, registration events and states, and other information.
You can find more information about historical records in BADVIN reports and see more examples here.
Available historical records for VIN 1FTEW1EPXJFB23674
Latest reported mileage: 146 mi
Below you can see some examples of what these records could look like.
2022-11-06
2 years ago
105,040 mi
Damage reported: minor to moderate damage
Damage to right rear
Damage to rear
Damage to right rear
Damage to rear
2022-01-14
2 years ago
18,772 mi
Passed emissions inspection
2020-07-18
4 years ago
47,306 mi
Damage reported
Damage to front
Damage to front
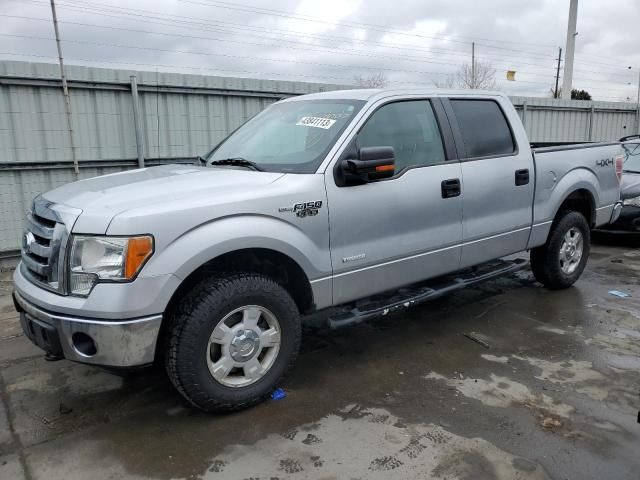
2018 FORD F150 SUPERCREW
sold
| Year | 2018 |
| Title | Hidden text (Hidden text) |
| ODO | 3296 mi (Hidden text) |
| Damage | Hidden text, Hidden text |
| Estimated Retail Value | $8454 |
| Location | Des Moines, IA, 50315 |
| Date | ended 3 years ago |
| Sale Website Type | salvage or insurance auction |
sale information provided by user #510536


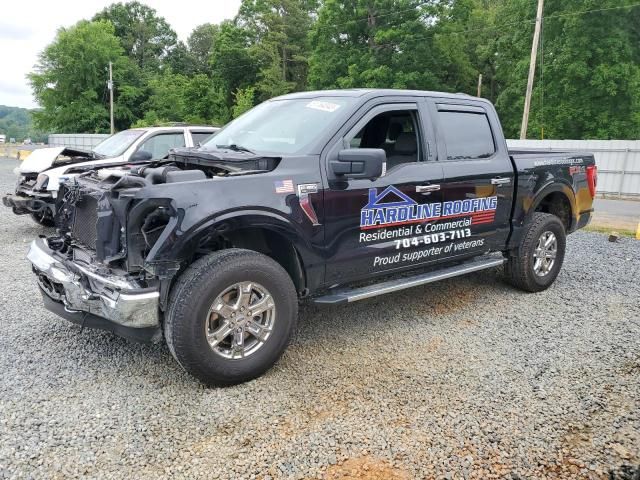
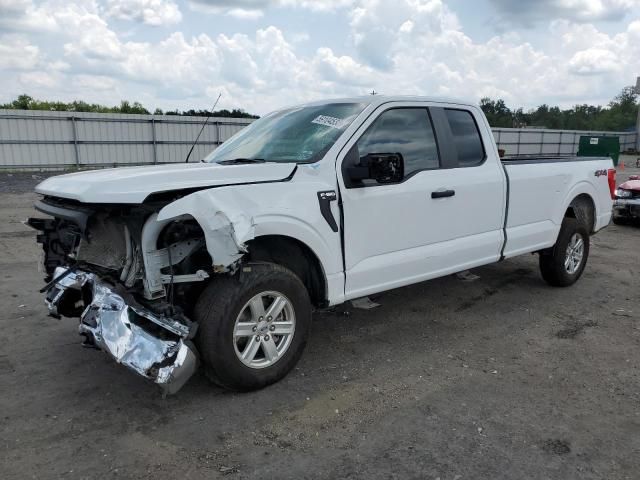
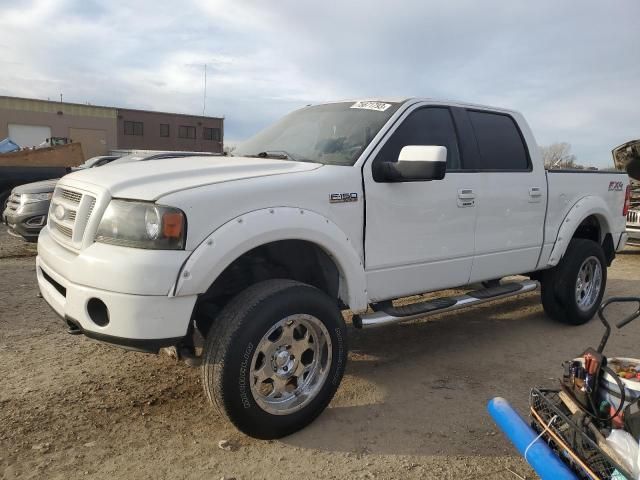
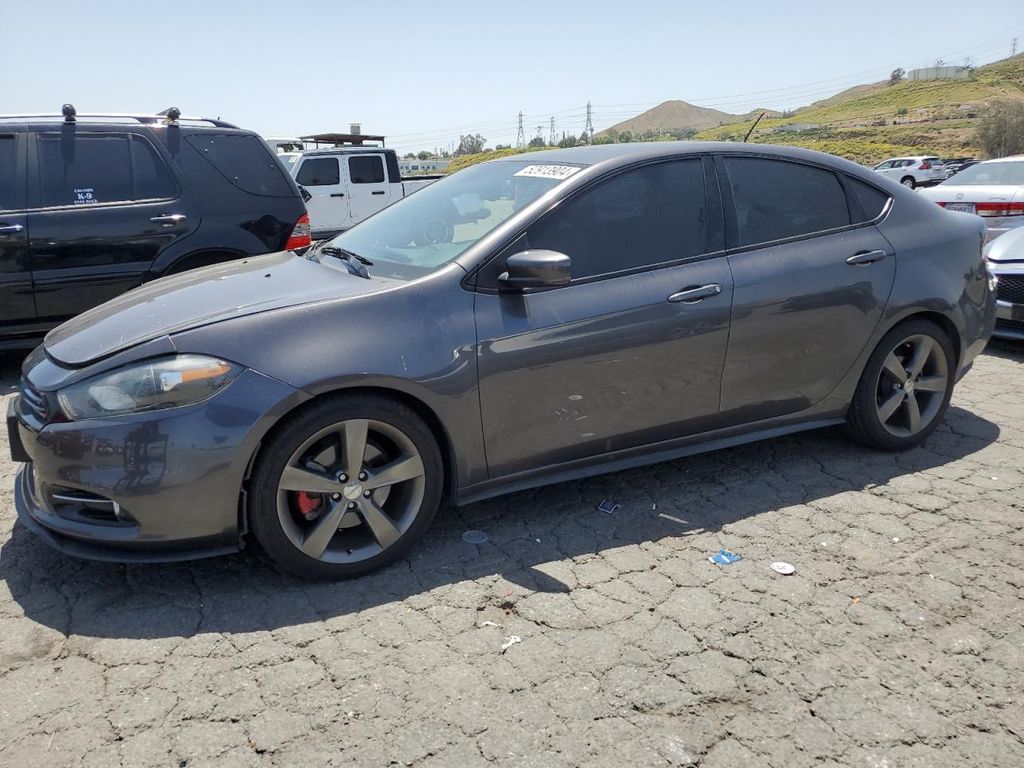
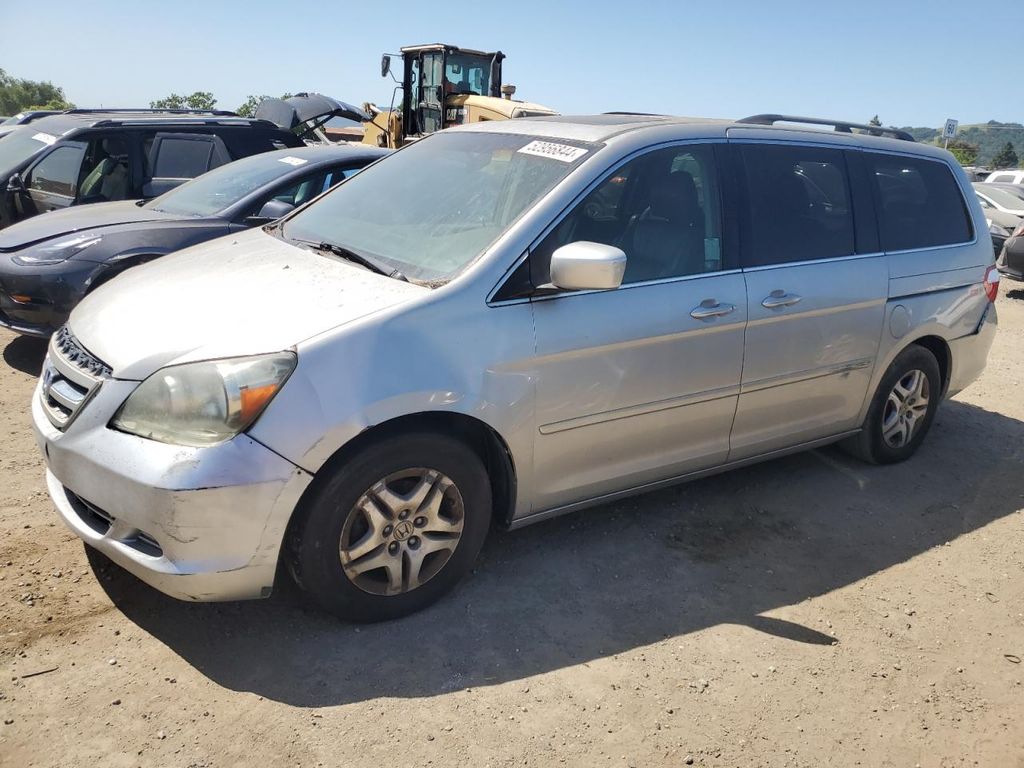
All photos above are REAL and display ACTUAL car. After you get the report you will see full resolution photos.
Tech Specs
| Color | SILVER |
| Transmission | AUTOMATIC |
| Engine | 2.7L 6 |
| Drive | 4x4 w/Rear Wheel Drv |
| Fuel Type | GAS |
Model Analytics & Market Report
We've analyzed more than 656,200 sales records of this model and here are some numbers.
The average price for new (MSRP) 2018 FORD F-150 in 2018 was $50,165.
The average price for used 2018 FORD F-150 nowadays in 2024 is $28,000 which is 56% from the original price.
Estimated mileage driven per year is 9,394 miles.
For this model we also have depreciation curve, photos, list of features and options, and other analytics.
Take a look at 2018 FORD F-150 model page in BADVIN vehicles catalog.
Depreciation
The graph below is a depreciation curve for 2018 FORD F-150. It shows how much this model looses per year in price. This analytics is calculated using sales records from BADVIN database.
The table below shows average price for used 2018 FORD F-150 in each year since the year of manufacturing, current year price and projected price in the future years.
You can scroll the table horizontally to see all columns.
| Year | Average Mileage | Average Price | % Left | % Lost | ||
|---|---|---|---|---|---|---|
| 2018 MSRP | 0 mi | $50,165 | — | — | 100% | 0% |
| 2018 | 9,394 mi | $57,250 | −$7,085 | −14.12% | 114.12% | -14.12% |
| 2019 | 18,788 mi | $52,995 | +$4,255 | +7.43% | 105.64% | -5.64% |
| 2020 | 28,182 mi | $45,995 | +$7,000 | +13.21% | 91.69% | 8.31% |
| 2021 | 37,576 mi | $41,404 | +$4,591 | +9.98% | 82.54% | 17.46% |
| 2022 | 46,970 mi | $33,798 | +$7,606 | +18.37% | 67.37% | 32.63% |
| → Visit 2018 FORD F-150 depreciation page to see full data. | ||||||
Price vs Mileage
The graph below shows how mileage affects the price for 2018 FORD F-150. This data was calculated using sales records from BADVIN database.
The table below shows average price for used 2018 FORD F-150 by mileage and number of sales.
You can scroll the table horizontally to see all columns.
| Mileage | Average Price | Sample Size |
|---|---|---|
| 10,000 mi | $31,949 | 14 sales |
| 15,000 mi | $33,995 | 25 sales |
| 20,000 mi | $41,986 | 23 sales |
| 25,000 mi | $34,900 | 43 sales |
| 30,000 mi | $36,415 | 75 sales |
| 35,000 mi | $33,394 | 110 sales |
| → Visit 2018 FORD F-150 depreciation page to see full data. | ||
Get FULL ACCESS to the vehicle history report and see all blurred info.
⭐ Read 206+ reviews from our customers who used BADVIN to avoid buying junk vehicles.
Testimonials from our customers
As a first time used car buyer, I was nervous about getting ripped off. The vehicle report from badvin gave me so much more confidence - it confirmed the car had a clean history and the mileage lined up. Such a relief to have that peace of mind.

Chloe Martin
verified on Trustpilot
I've tried many vehicle reports but badvin's is by far the most comprehensive. It shows accident photos, past sales, repairs and so much more. I won't buy a car now without getting a report first. It's a must-have.
Alexander Hunt
verified on Trustpilot
Ich hätte fast einen 2017 Mercedes-Benz C300 gekauft, bis der Bad Vin-Bericht zeigte, dass er als durch Überschwemmung beschädigt gemeldet wurde. Die detaillierten Schadensaufzeichnungen haben mich vor einem großen Fehler bewahrt!
Sophia Müller
verified on Trustpilot
I always rely on badvin to check out any used car before I buy. It gives such a complete history, including past accidents, service records, recalls and much more. Feel so much more confident as a used car shopper having this info.
Sofia Garcia
verified on Trustpilot
Compare to other 2018 FORD F-150

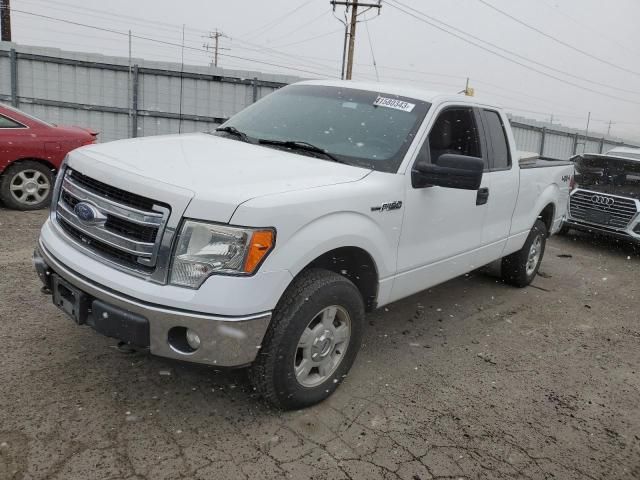
2013 FORD F-150
8 days ago, 143,668 mi
est retail value $13,278
buy now price $4,300
VIN 1FTFX1EF4DKF32161
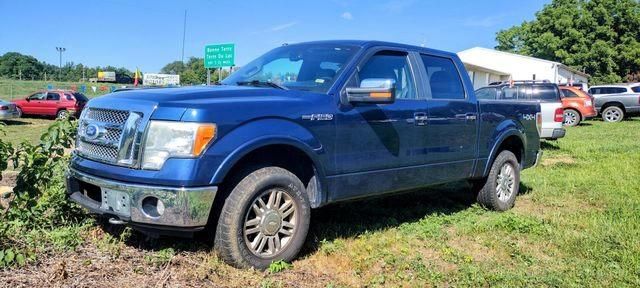
2010 FORD F-150
in 3 days, 198,141 mi
est retail value $15,980
buy now price $15,980
VIN 1FTFW1EV0AFB97009
2016 FORD F-150
3 months ago, 128,447 mi
est retail value $29,733
buy now price $12,000
VIN 1FTEX1CPXGKE16765

2018 FORD F-SERIES
in 6 days, 36,350 mi
est retail value $55,412
buy now price $14,000
VIN 1FTFW1E17JFB89163
2011 FORD F-150
in 3 days, 121,577 mi
est retail value $17,293
buy now price $5,900
VIN 1FTFW1ET2BFB32596
2007 FORD F-150
in 6 days, 119,265 mi
est retail value $13,850
buy now price $5,800
VIN 1FTPW14V77KD22142
Other vehicles sales records

1956 CADILLAC ALL OTHER
in 5 days, 47,728 mi
est retail value $8,261
buy now price $5,550
VIN 5662142295


Frequently asked questions
A reconstructed title, if issued, indicates significant past repairs after severe damage, which can impact the 2018 FORD vehicle’s safety and value.
VIN decoding can prevent fraud in the sale of 2018 FORD F-150 vehicles by ensuring the vehicle's details match those recorded officially, thus confirming its identity and legality.
Documentation, if available, includes details of theft and vandalism incidents, showing the extent of damage and any recovery actions taken for the 2018 FORD vehicle.
The manufacturing location can be interpreted from the first character of the VIN, which indicates the country of assembly, and sometimes more specific location details are included in the first few characters.
Water damage, if documented, is detailed with information on the extent and impact, affecting the 2018 FORD's electrical systems, engine, and overall functionality.
Factors to consider when estimating the future resale value include the car's historical depreciation rate, current market trends, overall vehicle condition, and mileage.


