
BADVIN vehicle history report for
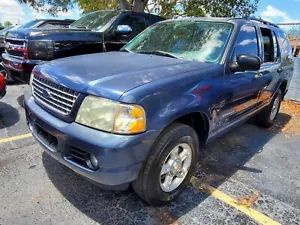
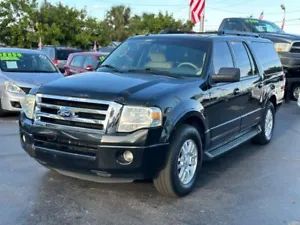
2017 FORD EXPLORERVIN: 1FM5K8DH4HGA19552
Get FULL ACCESS to the vehicle history report and see all blurred info.
⭐ Read 205+ reviews from our customers who used BADVIN to avoid buying junk vehicles.
Historical Records
events
Photos
24 images
Sales History
2 records
Sale Prices
2 records
Market report
Price analytics
Historical Records
Historical records may include service and maintenance records, title status (clean, junk, salvage), insurance records, number of owners, registration events and states, and other information.
You can find more information about historical records in BADVIN reports and see more examples here.
Available historical records for VIN 1FM5K8DH4HGA19552
Latest reported mileage: 772 mi
Below you can see some examples of what these records could look like.
2023-09-11
9 months ago
106,898 mi
Damage reported: very minor damage
Damage to rear
Damage to rear
2021-09-14
3 years ago
6,480 mi
SALVAGE TITLE/CERTIFICATE ISSUED
2021-05-08
3 years ago
31,961 mi
TOTAL LOSS VEHICLE
Collision damage reported
Collision damage reported
3372
| Year | 2017 |
| Title | Hidden text |
| ODO | 5074 mi |
| Condition | Hidden text |
| Seller | Hidden text (Hidden text) |
| Buy Now Price | $7075 |
| Location | Koons Motors |
| Date | ended 4 years ago |
| Sale Website Type | classifieds |
sale information provided by user #679428


All photos above are REAL and display ACTUAL car. After you get the report you will see full resolution photos.
Tech Specs
| Body Style | SUV |
| Color | Silver |
| Transmission | Automatic |
| Engine | 2.3L I4 EcoBoost |
| Drive | 4WD |
| Fuel Type | Gasoline |
Model Analytics & Market Report
We've analyzed more than 248,000 sales records of this model and here are some numbers.
The average price for new (MSRP) 2017 FORD EXPLORER in 2017 was $43,180.
The average price for used 2017 FORD EXPLORER nowadays in 2024 is $18,995 which is 44% from the original price.
Estimated mileage driven per year is 10,414 miles.
For this model we also have depreciation curve, photos, list of features and options, and other analytics.
Take a look at 2017 FORD EXPLORER model page in BADVIN vehicles catalog.
Depreciation
The graph below is a depreciation curve for 2017 FORD EXPLORER. It shows how much this model looses per year in price. This analytics is calculated using sales records from BADVIN database.
The table below shows average price for used 2017 FORD EXPLORER in each year since the year of manufacturing, current year price and projected price in the future years.
You can scroll the table horizontally to see all columns.
| Year | Average Mileage | Average Price | % Left | % Lost | ||
|---|---|---|---|---|---|---|
| 2017 MSRP | 0 mi | $43,180 | — | — | 100% | 0% |
| 2017 | 10,414 mi | $46,166 | −$2,986 | −6.92% | 106.92% | -6.92% |
| 2018 | 20,828 mi | $38,000 | +$8,166 | +17.69% | 88% | 12% |
| 2019 | 31,242 mi | $34,383 | +$3,617 | +9.52% | 79.63% | 20.37% |
| 2020 | 41,656 mi | $30,995 | +$3,388 | +9.85% | 71.78% | 28.22% |
| 2021 | 52,070 mi | $28,998 | +$1,997 | +6.44% | 67.16% | 32.84% |
| → Visit 2017 FORD EXPLORER depreciation page to see full data. | ||||||
Price vs Mileage
The graph below shows how mileage affects the price for 2017 FORD EXPLORER. This data was calculated using sales records from BADVIN database.
The table below shows average price for used 2017 FORD EXPLORER by mileage and number of sales.
You can scroll the table horizontally to see all columns.
| Mileage | Average Price | Sample Size |
|---|---|---|
| 20,000 mi | $25,240 | 21 sales |
| 30,000 mi | $24,998 | 32 sales |
| 35,000 mi | $22,983 | 39 sales |
| 40,000 mi | $23,594 | 67 sales |
| 45,000 mi | $22,999 | 103 sales |
| 50,000 mi | $21,910 | 155 sales |
| → Visit 2017 FORD EXPLORER depreciation page to see full data. | ||
Get FULL ACCESS to the vehicle history report and see all blurred info.
⭐ Read 205+ reviews from our customers who used BADVIN to avoid buying junk vehicles.
Testimonials from our customers
I always rely on badvin to check out any used car before I buy. It gives such a complete history, including past accidents, service records, recalls and much more. Feel so much more confident as a used car shopper having this info.

Sofia Garcia
verified on Trustpilot
I buy rebuilt title cars at copart to fix and resell. was hoping BadVin reports wud have more detail on damage history to help me value cars before bidding, Carfax is better for that. but for clean title vehicles it seems pretty useful
Fatima
verified on Trustpilot
I've tried a bunch of different vehicle history reports over the years and badvin.org has been the most comprehensive by far. Stuff like service records, ownership history, lien and repo info that I haven't found elsewhere. Def go-to resource when shopping for used vehicles now.
Levi Johnson
verified on Trustpilot
Was shopping for a used Range Rover and found one that seemed suspiciously cheap. The badVIN report revealed it had been in a major front end collision, with photos showing the damage. Steered clear of that one and saved myself a ton of headaches!!
Ava Patel
verified on Trustpilot
Compare to other 2017 FORD EXPLORER


Other vehicles sales records


Frequently asked questions
Car depreciation is the decrease in value of a vehicle over time. It's a crucial factor to consider when calculating the total cost of vehicle ownership.
Most VIN decoders do not provide color information as this is not typically encoded in the VIN; color information is usually obtained from vehicle registration documents or manufacturer records.
Market value is generally estimated based on the 2017 FORD vehicle’s history, condition, and comparable sales, helping to provide a guideline for buyers and sellers, though specific values can vary.
The window sticker for 2017 FORD vehicles provides emissions information including compliance with federal or state standards and the vehicle's environmental impact ratings.
The window sticker plays a crucial role in the car buying process by ensuring transparency about the vehicle's features, costs, and certifications, aiding consumers in making informed purchasing decisions.
Reports might include collision data, crash ratings, vehicle specifications from VIN decode, and more, providing a detailed profile of the 2017 FORD vehicle, depending on data availability.


