
BADVIN vehicle history report for
2018 FORD EXPLORERVIN: 1FM5K8AR7JGC17173
Get FULL ACCESS to the vehicle history report and see all blurred info.
⭐ Read 206+ reviews from our customers who used BADVIN to avoid buying junk vehicles.
Historical Records
events
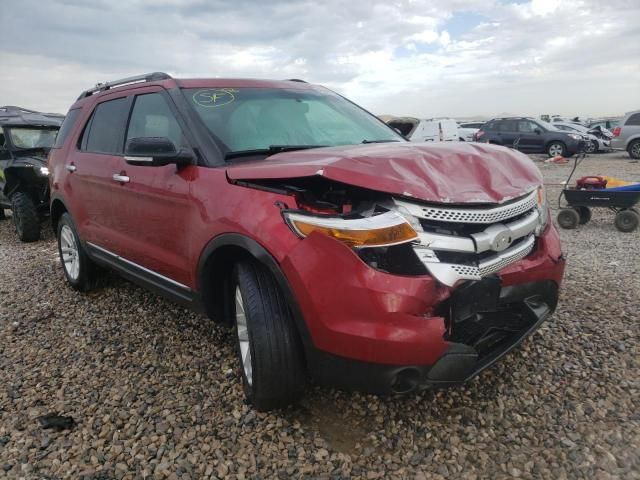
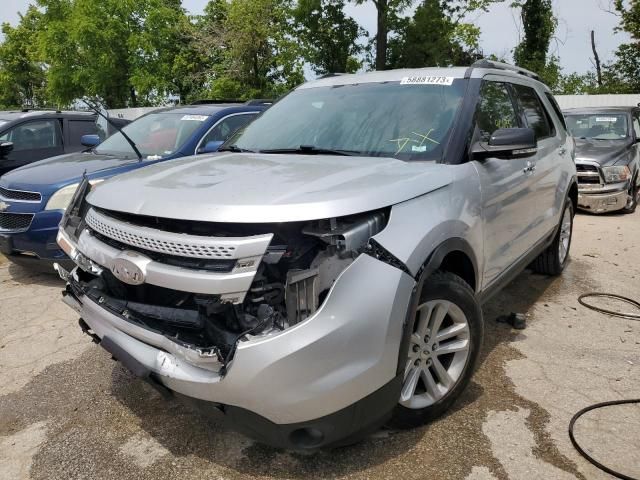
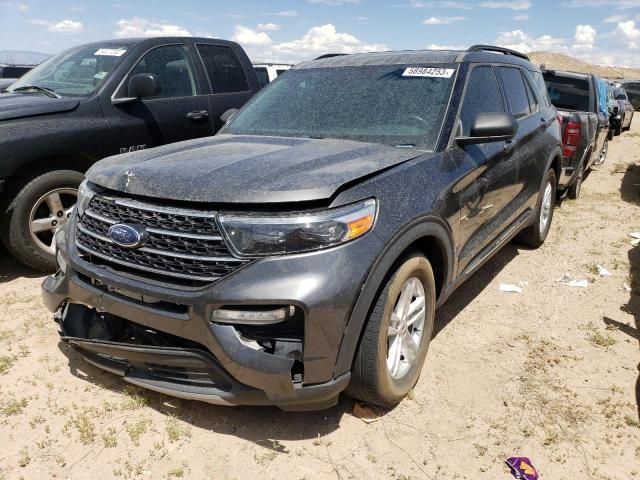
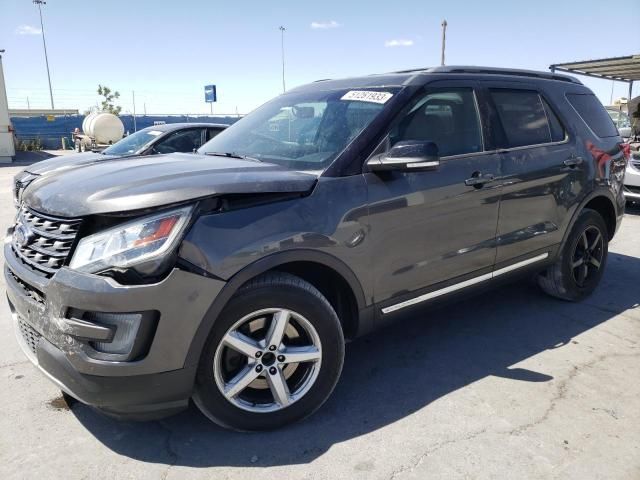
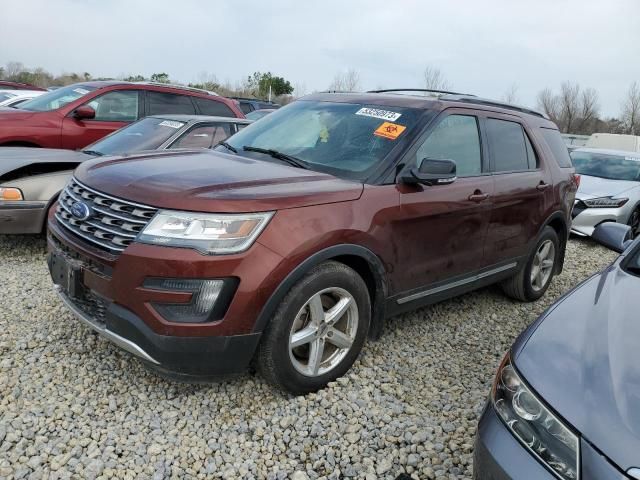
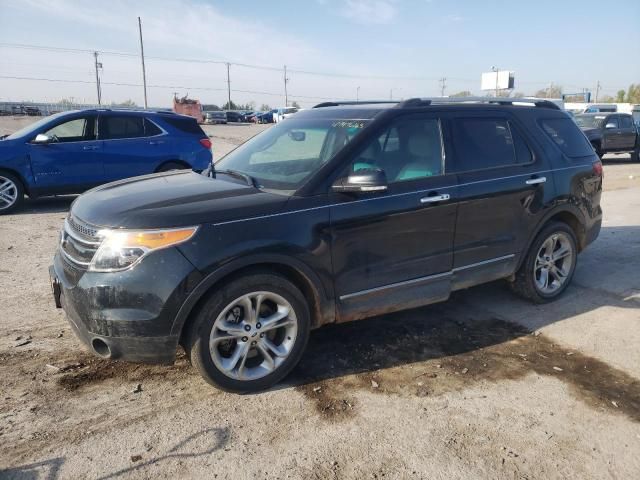
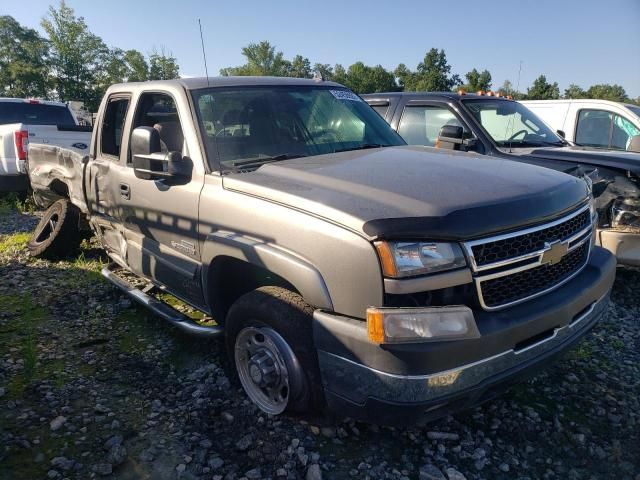
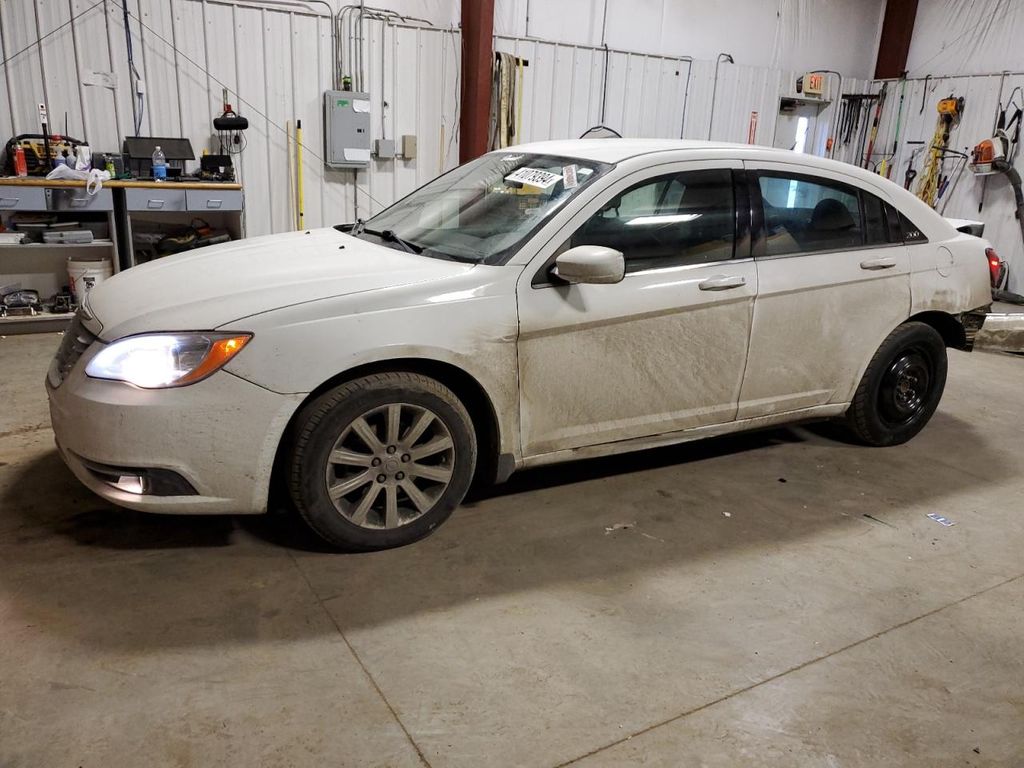
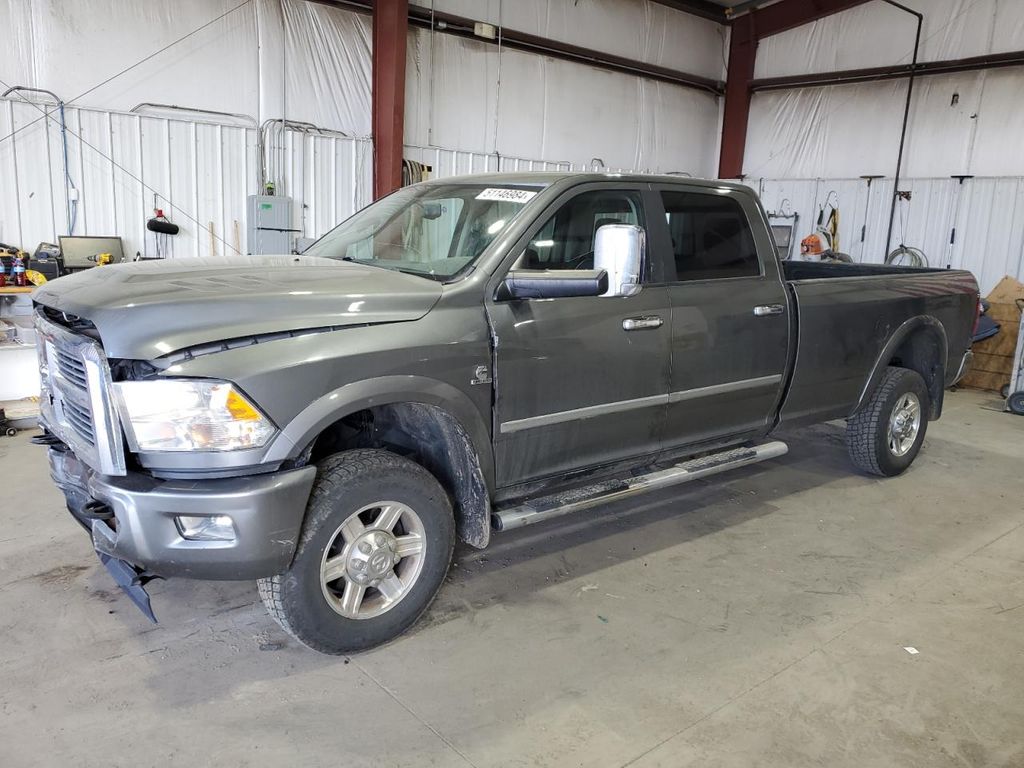
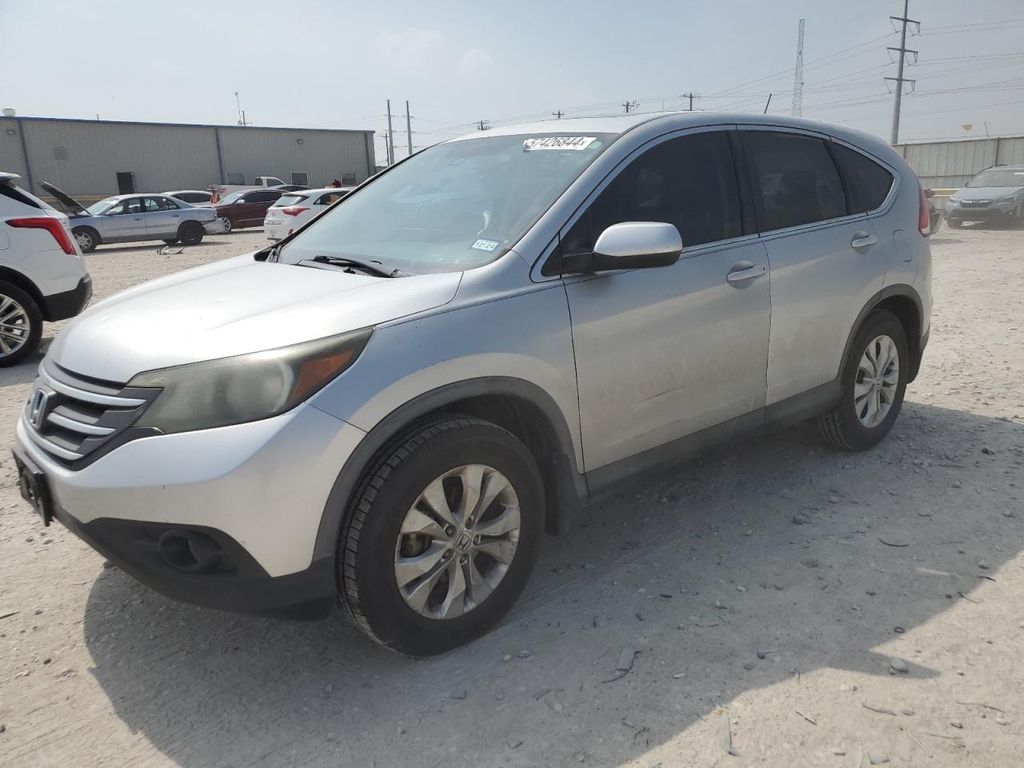
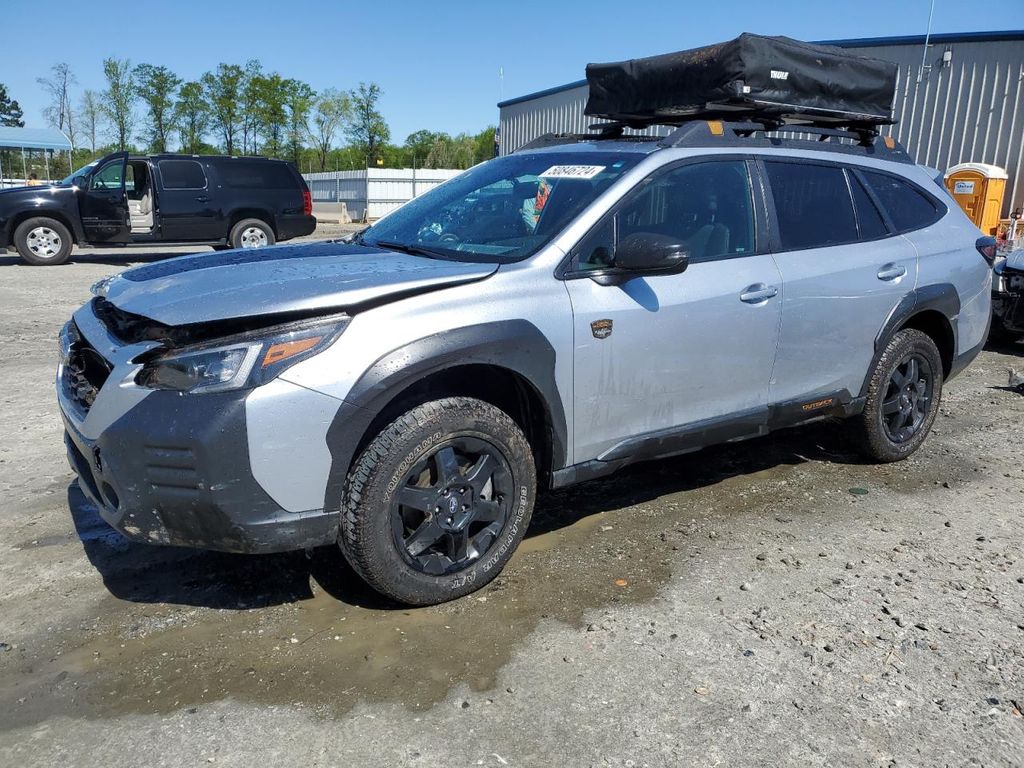
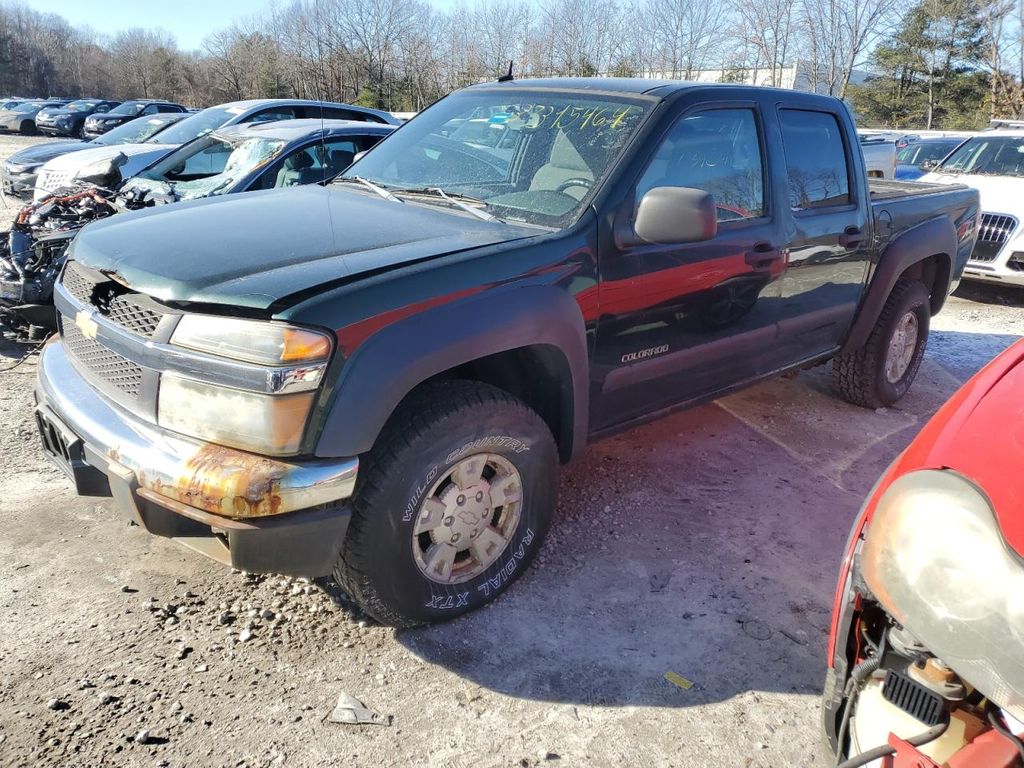
Photos
10 images
Sales History
1 records
Market report
Price analytics
Historical Records
Historical records may include service and maintenance records, title status (clean, junk, salvage), insurance records, number of owners, registration events and states, and other information.
You can find more information about historical records in BADVIN reports and see more examples here.
Available historical records for VIN 1FM5K8AR7JGC17173
Latest reported mileage: 703 mi
Below you can see some examples of what these records could look like.
2023-05-08
a year ago
145,571 mi
REBUILT TITLE ISSUED
2021-11-30
3 years ago
10,077 mi
NOT ACTUAL MILEAGE TITLE ISSUED
Titled or registered as lease vehicle
Titled or registered as lease vehicle
2020-11-05
4 years ago
26,549 mi
Vehicle sold
MILEAGE INCONSISTENCY
MILEAGE INCONSISTENCY
Sale Record
Sale Date
2 years ago
Location
Richmond, VA, 23225
2018 FORD EXPLORER POLICE INTERCEPTOR
sold
| Year | 2018 |
| Title | Hidden text (Hidden text) |
| ODO | — (Hidden text) |
| Damage | Hidden text, Hidden text |
| Estimated Retail Value | $1471 |
| Location | Richmond, VA, 23225 |
| Date | ended 2 years ago |
| Sale Website Type | salvage or insurance auction |
sale information provided by user #929815


All photos above are REAL and display ACTUAL car. After you get the report you will see full resolution photos.
Tech Specs
| Color | GRAY |
| Transmission | AUTOMATIC |
| Engine | 3.7L 6 |
| Drive | 4x4 w/Front Whl Drv |
| Fuel Type | GAS |
Model Analytics & Market Report
We've analyzed more than 208,700 sales records of this model and here are some numbers.
The average price for new (MSRP) 2018 FORD EXPLORER in 2018 was $43,180.
The average price for used 2018 FORD EXPLORER nowadays in 2024 is $21,500 which is 50% from the original price.
Estimated mileage driven per year is 10,414 miles.
For this model we also have depreciation curve, photos, list of features and options, and other analytics.
Take a look at 2018 FORD EXPLORER model page in BADVIN vehicles catalog.
Depreciation
The graph below is a depreciation curve for 2018 FORD EXPLORER. It shows how much this model looses per year in price. This analytics is calculated using sales records from BADVIN database.
The table below shows average price for used 2018 FORD EXPLORER in each year since the year of manufacturing, current year price and projected price in the future years.
You can scroll the table horizontally to see all columns.
| Year | Average Mileage | Average Price | % Left | % Lost | ||
|---|---|---|---|---|---|---|
| 2018 MSRP | 0 mi | $43,180 | — | — | 100% | 0% |
| 2018 | 10,414 mi | $46,166 | −$2,986 | −6.92% | 106.92% | -6.92% |
| 2019 | 20,828 mi | $38,000 | +$8,166 | +17.69% | 88% | 12% |
| 2020 | 31,242 mi | $34,383 | +$3,617 | +9.52% | 79.63% | 20.37% |
| 2021 | 41,656 mi | $30,995 | +$3,388 | +9.85% | 71.78% | 28.22% |
| 2022 | 52,070 mi | $28,998 | +$1,997 | +6.44% | 67.16% | 32.84% |
| → Visit 2018 FORD EXPLORER depreciation page to see full data. | ||||||
Price vs Mileage
The graph below shows how mileage affects the price for 2018 FORD EXPLORER. This data was calculated using sales records from BADVIN database.
The table below shows average price for used 2018 FORD EXPLORER by mileage and number of sales.
You can scroll the table horizontally to see all columns.
| Mileage | Average Price | Sample Size |
|---|---|---|
| 10,000 mi | $28,997 | 14 sales |
| 15,000 mi | $27,995 | 25 sales |
| 20,000 mi | $26,258 | 40 sales |
| 25,000 mi | $26,997 | 66 sales |
| 30,000 mi | $26,150 | 84 sales |
| 35,000 mi | $25,998 | 123 sales |
| → Visit 2018 FORD EXPLORER depreciation page to see full data. | ||
Get FULL ACCESS to the vehicle history report and see all blurred info.
⭐ Read 206+ reviews from our customers who used BADVIN to avoid buying junk vehicles.
Testimonials from our customers
As a used car dealer, I rely on badvin.org for checking every vehicle I'm considering purchasing at auction. The comprehensive reports give me peace of mind and help me avoid problem cars. Photos of past sales have saved me from overpaying many times. Worth every penny!

Misha
verified on Trustpilot
Bad Vin's vehicle history report showed that the 2018 Audi A4 I was about to buy had been in a major accident that was not disclosed by the seller. The severity analysis helped me avoid a bad purchase. Great service!
Sophie Dubois
verified on Trustpilot
BadVin's vehicle history report is a must-have before buying any used vehicle. It's saved me from a few lemons over the years - cars that looked great on the surface but had hidden issues like accidents or title problems. Well worth the price.
Camila Santos
verified on Trustpilot
I've tried many vehicle reports but badvin's is by far the most comprehensive. It shows accident photos, past sales, repairs and so much more. I won't buy a car now without getting a report first. It's a must-have.
Alexander Hunt
verified on Trustpilot
Compare to other 2018 FORD EXPLORER

2023 FORD EXPLORER
in 2 days, 8,833 mi
est retail value $38,933
buy now price $26,200
VIN 1FMSK7DH0PGB18087
2016 FORD EXPLORER
22 days ago, 164,505 mi
est retail value $15,485
buy now price $4,000
VIN 1FM5K8D83GGD02619


2016 FORD EXPLORER
24 days ago, 64,874 mi
est retail value $20,514
buy now price $4,500
VIN 1FM5K8F80GGC09117


Other vehicles sales records


2012 FORD F450
5 days ago, 224,953 mi
est retail value $19,340
buy now price $1,600
VIN 1FDUF4HY2CED10705


Frequently asked questions
Ownership history, including the number of previous owners and how long they owned the vehicle, can indicate how well the 2018 FORD vehicle was maintained, if such records are available.
Yes, the choice of vehicle color can impact the depreciation rate, with neutral colors typically being easier to sell and potentially holding their value better than more unconventional colors.
Yes, the window sticker for 2018 FORD vehicles includes warranty information, detailing the coverage for various components and the duration of the warranty.
Sales prices from past transactions may be documented in our reports, providing a price history that aids in determining current market value, if such data is available.
A salvage title generally indicates that the vehicle was declared a total loss by an insurance company due to severe damage from an accident, flood, or other causes, if such information is recorded.
MSRP on a Monroney label stands for Manufacturer's Suggested Retail Price, which is the recommended selling price for a vehicle.
Regulatory changes can affect what is included on future Monroney labels, particularly as governments implement new requirements for transparency in vehicle pricing, fuel efficiency, and safety.
Some models may depreciate faster due to factors like lower demand, higher maintenance costs, or outdated technology compared to newer versions.


