
BADVIN vehicle history report for
2011 FORD SUPER DUTYVIN: 1FDUF4GT0BEB10815
Get FULL ACCESS to the vehicle history report and see all blurred info.
⭐ Read 206+ reviews from our customers who used BADVIN to avoid buying junk vehicles.
Historical Records
events
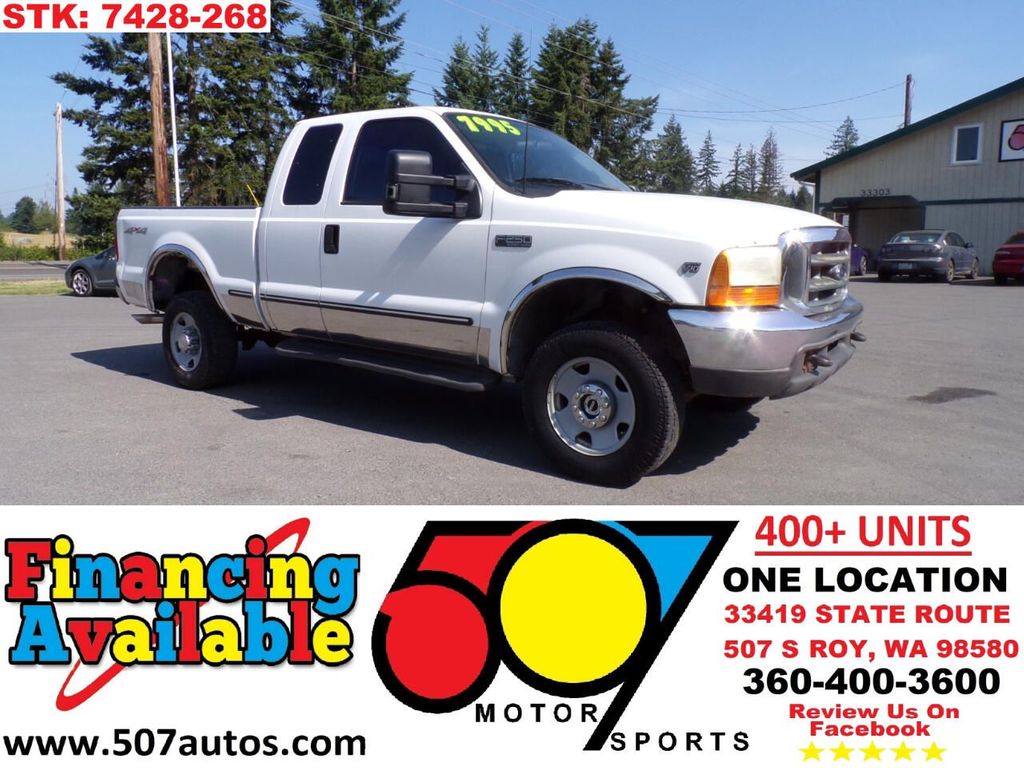
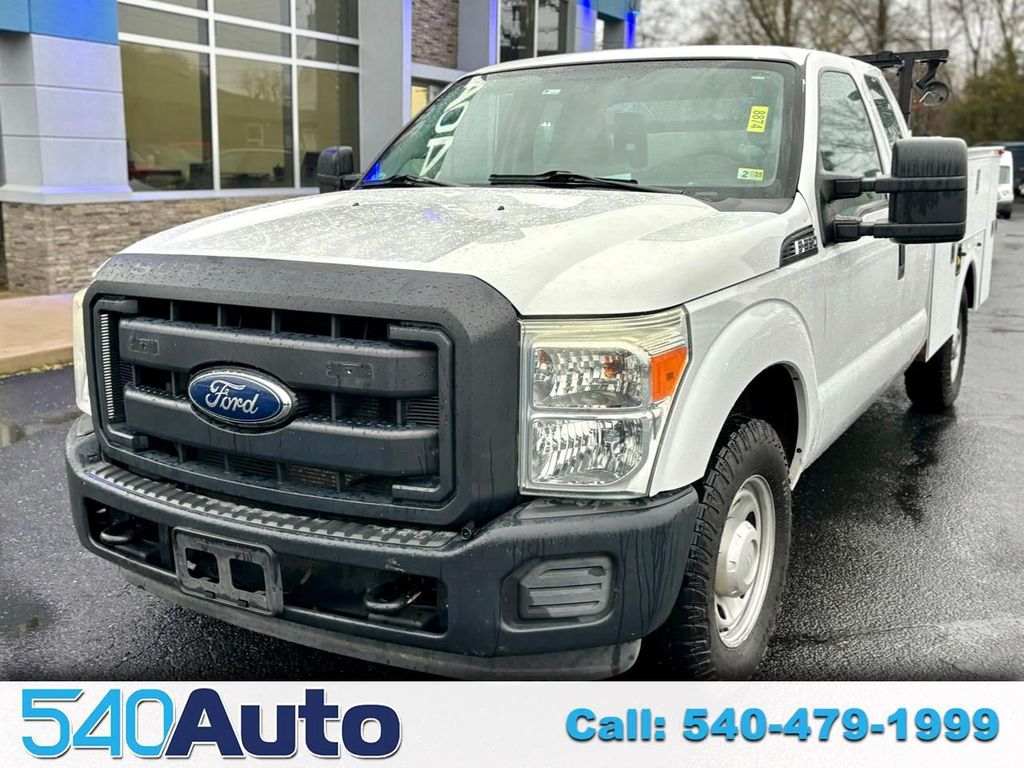
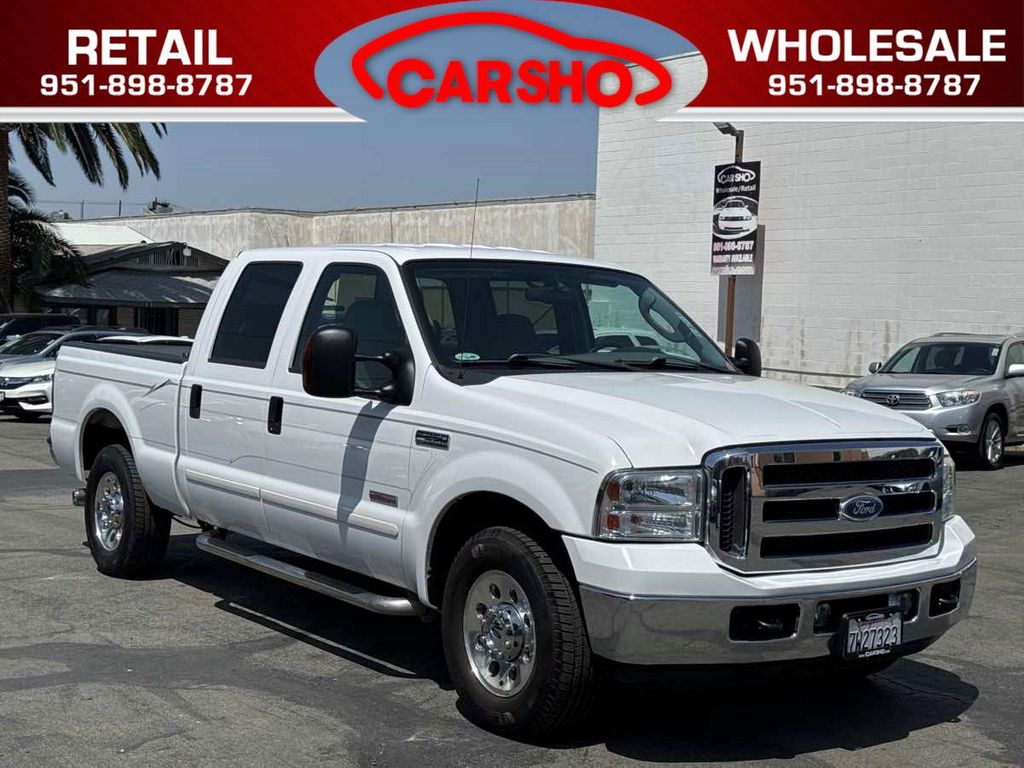
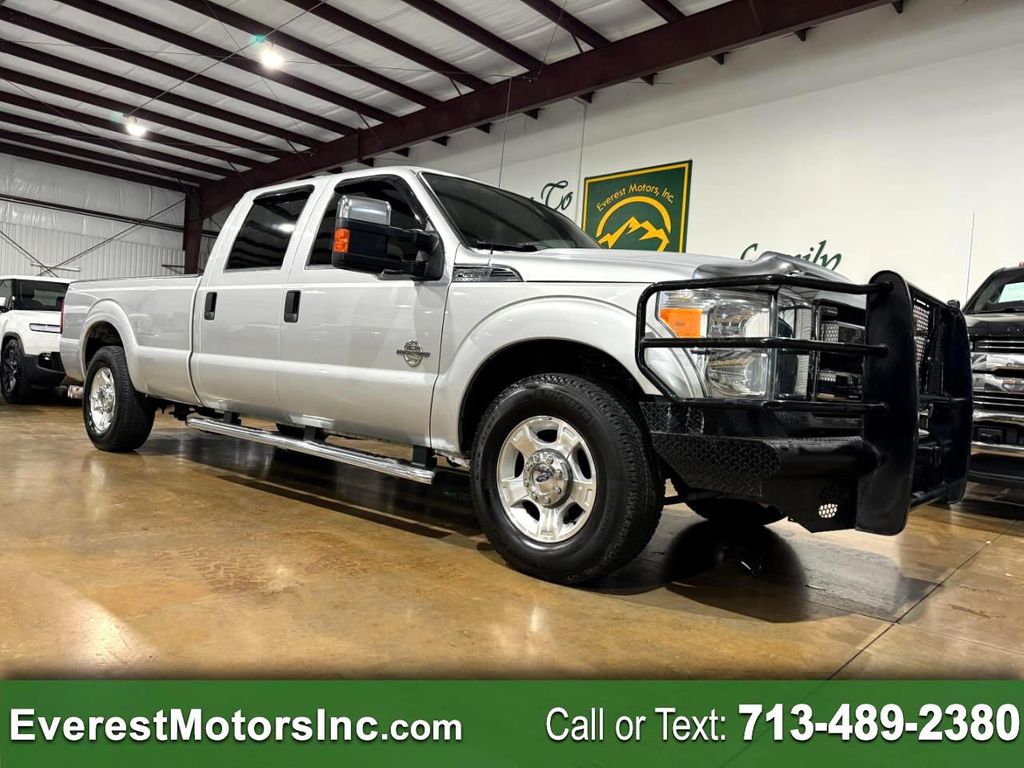
Photos
23 images
Sales History
2 records
Sale Prices
1 records
Market report
Price analytics
Historical Records
Historical records may include service and maintenance records, title status (clean, junk, salvage), insurance records, number of owners, registration events and states, and other information.
You can find more information about historical records in BADVIN reports and see more examples here.
Available historical records for VIN 1FDUF4GT0BEB10815
Latest reported mileage: 662 mi
Below you can see some examples of what these records could look like.
2023-08-04
10 months ago
32,546 mi
SALVAGE TITLE/CERTIFICATE ISSUED
2022-03-24
2 years ago
19,197 mi
Damage reported
Damage to front
Damage to front
2021-03-26
3 years ago
38,699 mi
New owner reported
REBUILT TITLE ISSUED
REBUILT TITLE ISSUED
2011 Ford Super Duty F-450 DRW
| Year | 2011 |
| ODO | 4851 mi |
| Seller | Hidden text (Hidden text) |
| Location | Auburn, WA, 98092 |
| Date | appeared 3 years ago latest price $6271 |
| Sale Website Type | classifieds |
| Notes | |
| Hidden text | |
sale information provided by user #546299


All photos above are REAL and display ACTUAL car. After you get the report you will see full resolution photos.
Tech Specs
| Color | white |
| Cylinders | 8 |
| Drive | RWD |
| Fuel Type | Diesel |
Sale Record
| Year | 2011 |
| Title | Hidden text |
| ODO | 3503 mi (Hidden text) |
| Loss | Hidden text |
| Damage | Hidden text, Hidden text |
| Estimated Retail Value | $389 |
| Seller | Hidden text |
| Location | Specialty Division, IL |
| Date | ended 3 years ago |
| Sale Website Type | salvage or insurance auction |
sale information provided by user #284749


All photos above are REAL and display ACTUAL car. After you get the report you will see full resolution photos.
Tech Specs
| Cylinders | 8 Cylinders |
| Drive | Rear Wheel Drive |
| Fuel Type | Diesel |
Model Analytics & Market Report
We've analyzed more than 2,400 sales records of this model and here are some numbers.
The average price for new (MSRP) 2011 FORD SUPER DUTY in 2011 was $58,300.
The average price for used 2011 FORD SUPER DUTY nowadays in 2024 is $24,990 which is 43% from the original price.
Estimated mileage driven per year is 11,941 miles.
For this model we also have depreciation curve, photos, list of features and options, and other analytics.
Take a look at 2011 FORD SUPER DUTY model page in BADVIN vehicles catalog.
Depreciation
The graph below is a depreciation curve for 2011 FORD SUPER DUTY. It shows how much this model looses per year in price. This analytics is calculated using sales records from BADVIN database.
The table below shows average price for used 2011 FORD SUPER DUTY in each year since the year of manufacturing, current year price and projected price in the future years.
You can scroll the table horizontally to see all columns.
| Year | Average Mileage | Average Price | % Left | % Lost | ||
|---|---|---|---|---|---|---|
| 2011 MSRP | 0 mi | $58,300 | — | — | 100% | 0% |
| 2013 | 35,823 mi | $94,987 | +$0 | +0% | 162.93% | -62.93% |
| 2014 | 47,764 mi | $50,440 | +$44,547 | +46.9% | 86.52% | 13.48% |
| 2015 | 59,705 mi | $56,490 | −$6,050 | −11.99% | 96.9% | 3.1% |
| → Visit 2011 FORD SUPER DUTY depreciation page to see full data. | ||||||
Price vs Mileage
The graph below shows how mileage affects the price for 2011 FORD SUPER DUTY. This data was calculated using sales records from BADVIN database.
The table below shows average price for used 2011 FORD SUPER DUTY by mileage and number of sales.
You can scroll the table horizontally to see all columns.
| Mileage | Average Price | Sample Size |
|---|---|---|
| 160,000 mi | $39,990 | 28 sales |
| 170,000 mi | $24,990 | 22 sales |
| 210,000 mi | $21,890 | 24 sales |
| → Visit 2011 FORD SUPER DUTY depreciation page to see full data. | ||
Get FULL ACCESS to the vehicle history report and see all blurred info.
⭐ Read 206+ reviews from our customers who used BADVIN to avoid buying junk vehicles.
Testimonials from our customers
I import used luxury cars from US auctions to resell in Russia. The vehicle history reports from badVIN are essential for avoiding problem cars. For a BMW I was bidding on, it uncovered a salvage title from flood damage that other reports missed! That alone pays for the service.

Dmitry Volkov
verified on Trustpilot
I almost bought a used Honda but luckily checked the BadVin report first. Turned out it had a salvage title from flood damage that the seller didn't disclose. Phew, dodged a huge issue!
Emily Turner
verified on Trustpilot
As a broke college kid I almost settled for a sketchy 2005 Altima cuz it was cheap. but splurged on the report from badvin 1st. soooo glad I did - turned out it had been totalled and rebuilt. spending a little saved me from wasting $1000s!
Sophie
verified on Trustpilot
After a bad experience buying a used car that turned out to have major issues, I now use Bad VIN to thoroughly check every vehicle i consider. It costs a bit more than other services but the detailed records and photos of past sales are wotrh it for the added peace of mind.
Olivia Johnson
verified on Trustpilot
Compare to other 2011 FORD SUPER DUTY


Other vehicles sales records


Frequently asked questions
A vehicle history report provides past data and records but cannot assess the current physical condition of a vehicle, underscoring the need for an independent inspection before purchase.
High mileage typically accelerates the depreciation of a vehicle, as it may indicate increased wear and tear and potential future repairs.
The market value of a vehicle is calculated based on its historical depreciation trends, current condition, mileage, and market trends.
The accident history section of our report may contain details about each incident, such as dates, severity, and any injuries reported, depending on the data available.
The economic climate can significantly affect the depreciation of vehicles, with higher demand and better economic conditions typically slowing depreciation rates.
You can verify the authenticity of a window sticker on a new car by checking that it includes official data from the manufacturer and matches the vehicle’s VIN and specifications.
The window sticker is important for new car buyers as it ensures transparency about the vehicle's origins, features, and costs, helping consumers make informed decisions.


