
BADVIN vehicle history report for
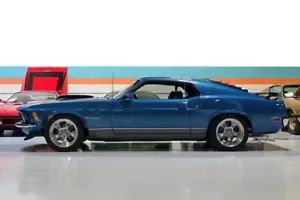
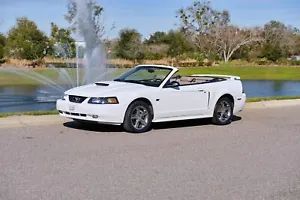
2016 FORD MUSTANGVIN: 1FATP8EM2G5280090
Get FULL ACCESS to the vehicle history report and see all blurred info.
⭐ Read 206+ reviews from our customers who used BADVIN to avoid buying junk vehicles.
Historical Records
events
Sales History
2 records
Market report
Price analytics
Historical Records
Historical records may include service and maintenance records, title status (clean, junk, salvage), insurance records, number of owners, registration events and states, and other information.
You can find more information about historical records in BADVIN reports and see more examples here.
Available historical records for VIN 1FATP8EM2G5280090
Latest reported mileage: 205 mi
Below you can see some examples of what these records could look like.
2023-07-10
a year ago
45,187 mi
Damage reported: minor to moderate damage
Damage to right rear
Damage to rear
Damage to right rear
Damage to rear
2022-06-26
2 years ago
16,528 mi
Vehicle serviced
Maintenance inspection completed
Maintenance inspection completed
2021-06-03
3 years ago
39,556 mi
Damage reported: very minor damage
Damage to rear
Damage to rear
Sale Record
| Year | 2016 |
| Title | Hidden text |
| ODO | 4829 mi |
| Location | Fayetteville, GA, 30215 |
| Date | ended a year ago |
| Sale Website Type | classifieds |
sale information provided by user #314527
Tech Specs
| Body Style | Convertible |
| Color | White |
| Transmission | Automatic |
| Engine | Regular Unleaded V-6 3.7 L/227 |
| Drive | 2dr Conv V6 |
| Fuel Type | Gasoline |
Model Analytics & Market Report
We've analyzed more than 128,600 sales records of this model and here are some numbers.
The average price for new (MSRP) 2016 FORD MUSTANG in 2016 was $39,240.
The average price for used 2016 FORD MUSTANG nowadays in 2024 is $21,995 which is 56% from the original price.
Estimated mileage driven per year is 3,603 miles.
For this model we also have depreciation curve, photos, list of features and options, and other analytics.
Take a look at 2016 FORD MUSTANG model page in BADVIN vehicles catalog.
Depreciation
The graph below is a depreciation curve for 2016 FORD MUSTANG. It shows how much this model looses per year in price. This analytics is calculated using sales records from BADVIN database.
The table below shows average price for used 2016 FORD MUSTANG in each year since the year of manufacturing, current year price and projected price in the future years.
You can scroll the table horizontally to see all columns.
| Year | Average Mileage | Average Price | % Left | % Lost | ||
|---|---|---|---|---|---|---|
| 2016 MSRP | 0 mi | $39,240 | — | — | 100% | 0% |
| 2016 | 3,603 mi | $44,583 | −$5,343 | −13.62% | 113.62% | -13.62% |
| 2017 | 7,206 mi | $37,998 | +$6,585 | +14.77% | 96.83% | 3.17% |
| 2018 | 10,809 mi | $36,998 | +$1,000 | +2.63% | 94.29% | 5.71% |
| 2019 | 14,412 mi | $28,677 | +$8,321 | +22.49% | 73.08% | 26.92% |
| 2020 | 18,015 mi | $29,888 | −$1,211 | −4.22% | 76.17% | 23.83% |
| → Visit 2016 FORD MUSTANG depreciation page to see full data. | ||||||
Price vs Mileage
The graph below shows how mileage affects the price for 2016 FORD MUSTANG. This data was calculated using sales records from BADVIN database.
The table below shows average price for used 2016 FORD MUSTANG by mileage and number of sales.
You can scroll the table horizontally to see all columns.
| Mileage | Average Price | Sample Size |
|---|---|---|
| 0 mi | $57,950 | 37 sales |
| 5,000 mi | $47,500 | 89 sales |
| 10,000 mi | $37,999 | 127 sales |
| 15,000 mi | $33,995 | 127 sales |
| 20,000 mi | $32,995 | 204 sales |
| 25,000 mi | $31,338 | 195 sales |
| → Visit 2016 FORD MUSTANG depreciation page to see full data. | ||
Get FULL ACCESS to the vehicle history report and see all blurred info.
⭐ Read 206+ reviews from our customers who used BADVIN to avoid buying junk vehicles.
Testimonials from our customers
I almost bought a 2019 Malibu that seemed like a great deal - low miles and price. But the badvin report showed it used to be a rental fleet vehicle, which the seller didn't disclose. Glad I found out before buying someone else's abused rental!

Benjamin Torres
verified on Trustpilot
Ich hätte fast einen 2017 Mercedes-Benz C300 gekauft, bis der Bad Vin-Bericht zeigte, dass er als durch Überschwemmung beschädigt gemeldet wurde. Die detaillierten Schadensaufzeichnungen haben mich vor einem großen Fehler bewahrt!
Sophia Müller
verified on Trustpilot
Was shopping for a used Range Rover and found one that seemed suspiciously cheap. The badVIN report revealed it had been in a major front end collision, with photos showing the damage. Steered clear of that one and saved myself a ton of headaches!!
Ava Patel
verified on Trustpilot
Report showed a car I was considering had a prior salvage title from a major accident, even though carfax listed it as clean. Messaged seller asking about it and they made shady excuses. Def avoided a scam thanks to badvin!
Mia Johnson
verified on Trustpilot
Compare to other 2016 FORD MUSTANG


Other vehicles sales records


Frequently asked questions
To verify that a VIN has not been tampered with, check for inconsistencies in the VIN's font, alignment, and location, and compare the VIN displayed in various parts of the vehicle with that on the official documents.
A VIN decoder can help verify the authenticity of 2016 FORD parts by matching them with the vehicle's original specifications listed under its VIN.
A VIN decoder can uncover discrepancies such as mismatches in reported and actual vehicle specifications, including year, model, and equipment, which can indicate potential fraud or errors in listings.
Discrepancies between a window sticker and actual dealer pricing can occur due to additional dealer markup, optional add-ons not included in the sticker, or regional pricing differences.
Taxes are not typically shown on the Monroney label for 2016 FORD vehicles as they vary by location and are usually calculated and added at the time of purchase.
Gray market status, if noted, indicates the 2016 FORD was imported outside official channels, potentially affecting its compliance with local regulations and parts availability.


